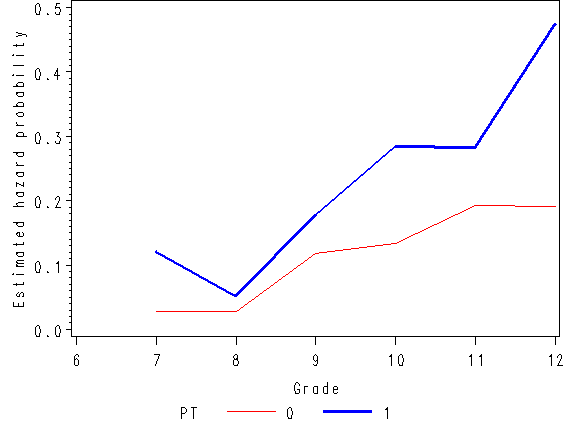
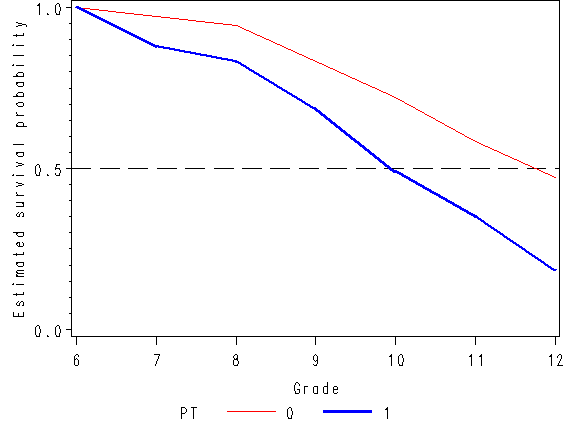
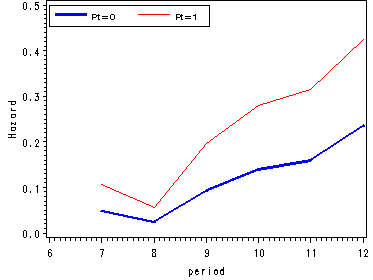
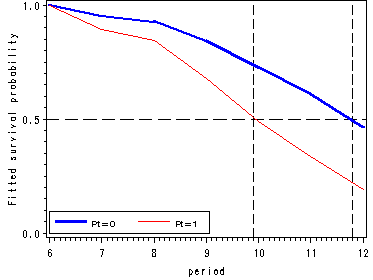
Figure 11.1, page 359
proc sort data = 'c:\alda\firstsex';
  by pt;
run;
proc lifetest data = 'c:\alda\firstsex';
  time time*censor(1);
  by pt;
     ods output ProductLimitEstimates = tsex;
run;
data fig11_1b;
  set tsex (where = (survival~=.));
  if time = 0 then time = 6;
  lags = lag(survival);
  by pt;
  if ~ first.pt then do;
  hazard = 1 - survival/lags;
  end;
  keep survival hazard time pt;
run;
goptions reset=all device=gif570;
symbol1 c=red i=join;
symbol2 c=blue i=join width=2;
axis1 order=(0 to .5 by 0.1) label=(a=90 'Estimated hazard probability');
axis2 order = (0 to 1 by .5) label=(a=90 'Estimated survival probability');
axis3 order = (6 to 12 by 1) minor = none label=('Grade');
proc gplot data=fig11_1b;
   format time 2.0 survival hazard 3.1;
  plot hazard*time  = pt / vaxis=axis1 haxis=axis3;
  plot survival*time = pt / vaxis=axis2 haxis=axis3 vref=0.5 lvref=21;
run;
quit;
Table 11.1, page 360. We will do create the table in two parts. The first part is based on the result from previous example. The data set tsex came from proc lifetest from previous example.
options nocenter nodate;
data table11_1by_pt;
  set tsex (where = (survival~=.));
  format left 4.0;
  myleft = lag(left);
  myfail = lag(failed);
  if time = 0 then time = 6;
  lags = lag(survival);
  by pt;
  if ~ first.pt then do;
  failed = failed - myfail;
  hazard = 1 - survival/lags;
  end;
  keep survival hazard time pt myleft failed;
run;
proc print data = table11_1by_pt noobs;
 where hazard ~=.;
  format time 3.0;
  var time myleft failed hazard survival;
run;
TIME myleft Failed hazard Survival
  7        72        2      0.02778      0.9722
  8        70        2      0.02857      0.9444
  9        68        8      0.11765      0.8333
 10        60        8      0.13333      0.7222
 11        52       10      0.19231      0.5833
 12        42        8      0.19048      0.4722
  7       108       13      0.12037      0.8796
  8        95        5      0.05263      0.8333
  9        90       16      0.17778      0.6852
 10        74       21      0.28378      0.4907
 11        53       15      0.28302      0.3519
 12        38       18      0.47368      0.1852
Now, we will create the part of Table 11.1 for overall survival regardless the parenting transitions.
proc lifetest data = alda.firstsex;
  time time*censor(1);
  ods output ProductLimitEstimates = tall;
run;
data table11_1all;
  set tall (where = (survival~=.));
  format left 4.0;
  myleft = lag(left);
  myfail = lag(failed);
  if time = 0 then time = 6;
  lags = lag(survival);
  failed = failed - myfail;
  hazard = 1 - survival/lags;
  keep survival hazard time pt myleft failed;
run;
proc print data = table11_1all noobs;
 where hazard ~=.;
  format time 3.0;
  var time myleft failed hazard survival;
run;
TIME myleft Failed hazard Survival
  7       180       15      0.08333      0.9167
  8       165        7      0.04242      0.8778
  9       158       24      0.15190      0.7444
 10       134       29      0.21642      0.5833
 11       105       25      0.23810      0.4444
 12        80       26      0.32500      0.3000
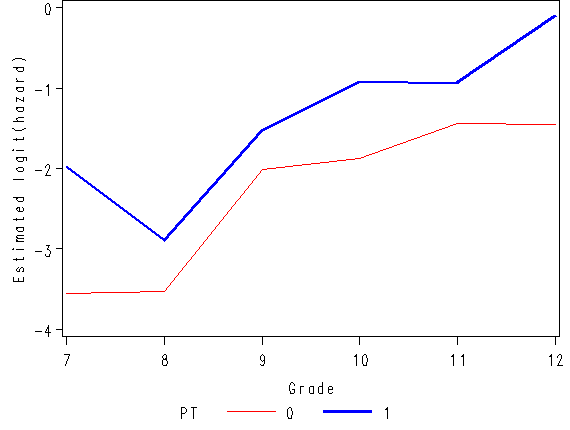
Figure 11.2, page 363
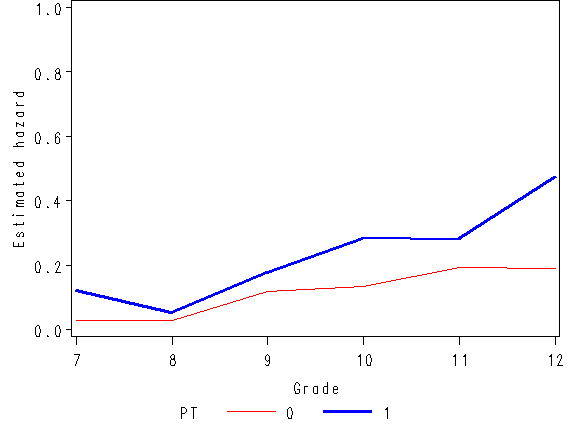
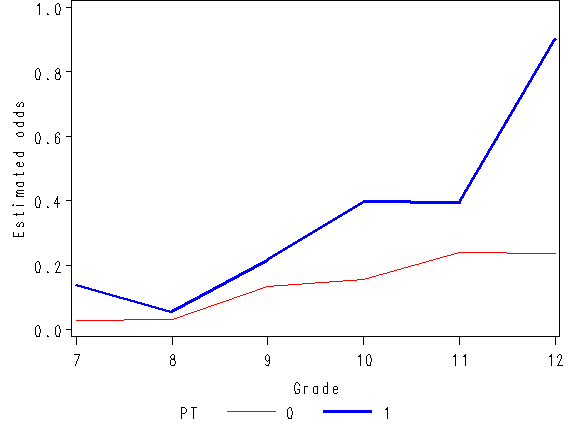
Manipulate the data set fig11_1b containing the hazard function created for Figure 11.1 in order to create the estimated odds and the estimated logit(hazard).
data fig11_2;
  set fig11_1b;
  odds = hazard/(1-hazard);
  logith = log(odds);
run;

goptions reset=all ;
symbol1 c=red i=join;
symbol2 c=blue i=join width=2;
axis1 order=(0 to 1 by 0.2) minor = none label=(a=90 'Estimated hazard');
axis2 order=(0 to 1 by 0.2) minor = none label=(a=90 'Estimated odds');
axis3 order=(-4 to 0 by 1) minor = none label=(a=90 'Estimated logit(hazard)');
axis4 order =(7 to 12 by 1) minor = none label=('Grade');
proc gplot data=fig11_2;
  format time 3.0;
  plot hazard*time = pt / vaxis=axis1 haxis=axis4;
  plot odds*time = pt / vaxis=axis2 haxis = axis4;
  plot logith*time = pt / vaxis=axis3 haxis = axis4;
run;
quit;
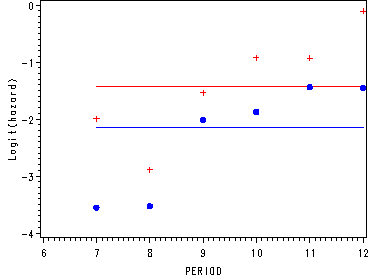
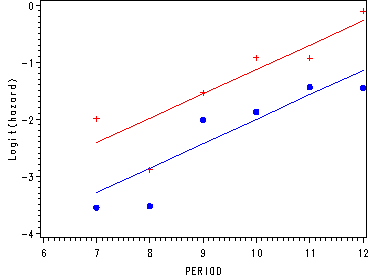
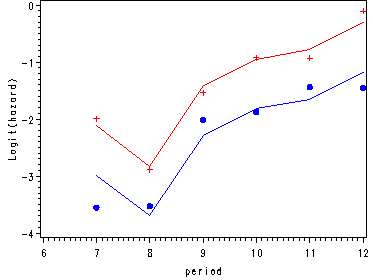
Figure 11.3, page 366
Producing the empirical logits–the dots and pluses in the graphs.
proc sort data=datasets.firstsex_pp out=sort;
  by period pt event;
run;
proc means data=sort1 noprint;
  by period pt;
  var id;
  output out=test n=c1;
run;
proc sort data=test;
  by period pt;
run;
data m1;
  merge first test;
  by period pt;
run;
proc means data=sort noprint;
  by period pt event;
  var id;
  output out=test1 n=c2;
run;
proc sort data=m1;
  by period pt event;
run;
proc sort data=test1;
  by period pt event;
run;
data m2;
  merge m1 test1;
  by period pt event;
run;
proc sort data=m2;
  by c1 c2;
run;
data small;
  set m2;
  by c1 c2;
  if first.c1 or first.c2;
  keep period pt event c1 c2;
  if event=1;
run;
data small;
  set small;
  prob = c2/c1 ;
  if pt=0 then pt0 = log(prob/(1-prob));
  if pt=1 then pt1 = log(prob/(1-prob));
run;
proc sort data=small out=period;
  by period;
run;
Fitting the constant model and graphing the predicted model and the empirical logits.
ods listing close;
ods output parameterestimates=est_c;
proc logistic data=datasets.firstsex_pp descending;
  model event= pt ;
run;
ods listing;
data _null_;
  set est_c;
  if variable='PT' then call symput('PT', estimate);
  if variable='Intercept' then call symput('int', estimate);
run;
data constant;
  set period;
  c0 = &int ;
  c1 = &int + &pt;
run;
goptions reset=all;
symbol1 c=blue i=j;
symbol2 c=red i=j;
symbol3 c=blue v=dot;
symbol4 c=red v=plus;
axis1 order=(-4 to 0 by 1) label=(a=90 'Logit(hazard)');
axis2 order=(6 to 12 by 1);
proc gplot data=constant;
  plot (c0 c1 pt0 pt1)*period / overlay vaxis=axis1 haxis=axis2;
run;
quit;
Fitting the linear model and graphing the predicted model and the empirical logits.
ods output parameterestimates=est_l;
ods listing close;
proc logistic data=datasets.firstsex_pp descending;
  model event=period pt ;
run;
ods listing;
data _null_;
  set est_l;
  if variable='PT' then call symput('PT', estimate);
  if variable='PERIOD' then call symput('per', estimate);
  if variable='Intercept' then call symput('int', estimate);
run;
data linear;
  set period;
  lin0 = &int + &per*period;
  lin1 = &int + &pt + &per*period;
run;
goptions reset=all;
symbol1 c=blue i=j;
symbol2 c=red i=j;
symbol3 c=blue v=dot;
symbol4 c=red v=plus;
axis1 order=(-4 to 0 by 1) label=(a=90 'Logit(hazard)');
axis2 order=(6 to 12 by 1);
proc gplot data=linear;
  plot (lin0 lin1 pt0 pt1)*period / overlay vaxis=axis1 haxis=axis2;
run;
quit;
Fitting the non-linear model and graphing the predicted model and the empirical logits.
ods output parameterestimates=est;
ods listing close;
proc logistic data=datasets.firstsex_pp descending;
  model event=D7-D12 pt / noint;
run;
ods listing;
*computing the logit(hazard) for pt=1 as well as the odds and hazard estimates ;
* for each level of pt.;
data _null_;
  set est;
  if variable='PT' then call symput('PT', estimate);
run;
data nlin;
  set est;
  keep estimate estimate1 period;
  period = substr(variable, 2, 2) + 0;
  estimate1 = estimate + &pt;
  if variable = "PT" then delete;
run;
data nlingraph;
  merge nlin period;
  by period;
run;
goptions reset=all;
symbol1 c=blue i=j;
symbol2 c=red i=j;
symbol2 c=red i=j;
symbol3 c=blue v=dot;
axis1 order=(-4 to 0 by 1) label=(a=90 'Logit(hazard)');
axis2 order=(6 to 12 by 1);
proc gplot data=nlingraph;
  format estimate 2.;
  plot (estimate estimate1 pt0 pt1)*period / overlay vaxis=axis1 haxis=axis2;
run;
quit;
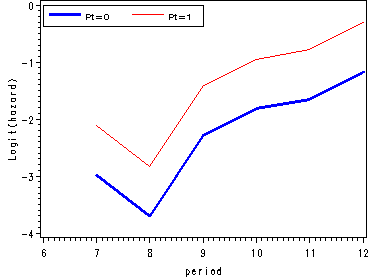
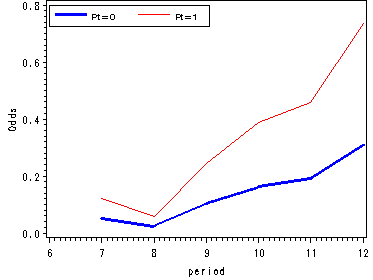
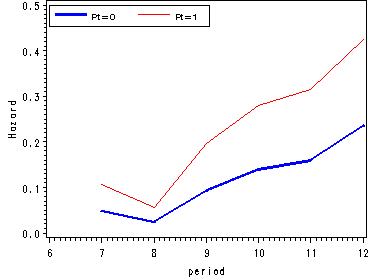
Figure 11.4, page 374
We fit a logit model to firstsex data using dummy variables for time and output the estimates from proc logistic in a data set called est. Since we are not focusing on the logistic output we have suppressed it using the ods listing close statement.
ods output parameterestimates=est;
ods listing close;
proc logistic data=datasets.firstsex_pp descending;
  model event=D7-D12 pt / noint;
run;
ods listing;
Using the macro variable syntax we save the value of the parameter estimate for pt in a macro variable called pt. In the next data step we are computing the logit(hazard) for pt=1 as well as the odds and hazard estimates for each level of pt.
data _null_;
  set est;
  if variable='PT' then call symput('PT', estimate);
run;
data fig3_4;
  set est;
  keep estimate estimate1 period hazard0 hazard1 odds0 odds1 beta;
  period = substr(variable, 2, 2) + 0;
  estimate1 = estimate + &pt;
  if variable = "PT" then delete;
  odds0 = exp(estimate);
  odds1 = exp(estimate1);
  hazard0 = odds0/(1+odds0);
  hazard1 = odds1/(1+odds1);
  beta = &pt;
run;
goptions reset=all;
symbol1 c=blue i=j width=2;
symbol2 c=red i=join;
axis1 order=(-4 to 0 by 1) label=(a=90 'Logit(hazard)');
axis2 order=(0 to 0.8 by 0.2) label=(a=90 'Odds');
axis3 order=(0 to 0.5 by 0.1) label=(a=90 'Hazard');
axis4 order=(6 to 12 by 1);
legend label=none value=(height=1 font=swiss 'Pt=0' 'Pt=1' )
        position=(top left inside) mode=share cborder=black;
proc gplot data=fig3_4;
  format estimate  2.;
  plot (estimate estimate1)*period / overlay vaxis=axis1 haxis=axis4 legend=legend;
  plot (odds0 odds1)*period / overlay vaxis=axis2 haxis=axis4 legend=legend;
  plot (hazard0 hazard1)*period / overlay vaxis=axis3 haxis=axis4 legend=legend;
run;
quit;
Table 11.3, page 386
* Model A ;
proc logistic data="c:\alda\firstsex_pp" descending ;
  model event = d7 d8 d9 d10 d11 d12 / noint ;
run;
         Model Fit Statistics

                Without         With
Criterion     Covariates     Covariates

AIC             1139.534        663.955
SC              1139.534        692.226
-2 Log L        1139.534        651.955

        Testing Global Null Hypothesis: BETA=0
Test                 Chi-Square       DF     Pr > ChiSq
Likelihood Ratio       487.5786        6         <.0001
Score                  421.4842        6         <.0001
Wald                   277.1388        6         <.0001

             Analysis of Maximum Likelihood Estimates

                               Standard          Wald
Parameter    DF    Estimate       Error    Chi-Square    Pr > ChiSq
D7            1     -2.3979      0.2697       79.0611        <.0001
D8            1     -3.1167      0.3862       65.1115        <.0001
D9            1     -1.7198      0.2217       60.2016        <.0001
D10           1     -1.2867      0.2098       37.6195        <.0001
D11           1     -1.1632      0.2291       25.7699        <.0001
D12           1     -0.7309      0.2387        9.3751        0.0022
* Model B ;
proc logistic data="c:\alda\firstsex_pp" descending ;
  model event = d7 d8 d9 d10 d11 d12 pt / noint ;
  pt:  test pt;
run;

         Model Fit Statistics
                Without         With
Criterion     Covariates     Covariates
AIC             1139.534        648.662
SC              1139.534        681.644
-2 Log L        1139.534        634.662

        Testing Global Null Hypothesis: BETA=0
Test                 Chi-Square       DF     Pr > ChiSq
Likelihood Ratio       504.8722        7         <.0001
Score                  429.6738        7         <.0001
Wald                   271.0944        7         <.0001

             Analysis of Maximum Likelihood Estimates

                               Standard          Wald
Parameter    DF    Estimate       Error    Chi-Square    Pr > ChiSq
D7            1     -2.9943      0.3175       88.9379        <.0001
D8            1     -3.7001      0.4206       77.4055        <.0001
D9            1     -2.2811      0.2724       70.1309        <.0001
D10           1     -1.8226      0.2585       49.7268        <.0001
D11           1     -1.6542      0.2691       37.7872        <.0001
D12           1     -1.1791      0.2716       18.8484        <.0001
PT            1      0.8736      0.2174       16.1471        <.0001

   Linear Hypotheses Testing Results

                Wald
 Label    Chi-Square      DF    Pr > ChiSq
 pt          16.1471       1        <.0001
* Model C ;
proc logistic data="c:\alda\firstsex_pp" descending ;
  model event = d7 d8 d9 d10 d11 d12  pas / noint ;
  pas:  test pas;
run;
         Model Fit Statistics
                Without         With
Criterion     Covariates     Covariates
AIC             1139.534        651.169
SC              1139.534        684.151
-2 Log L        1139.534        637.169

        Testing Global Null Hypothesis: BETA=0
Test                 Chi-Square       DF     Pr > ChiSq
Likelihood Ratio       502.3654        7         <.0001
Score                  428.8665        7         <.0001
Wald                   272.9013        7         <.0001

                               Standard          Wald
Parameter    DF    Estimate       Error    Chi-Square    Pr > ChiSq
D7            1     -2.4646      0.2741       80.8416        <.0001
D8            1     -3.1591      0.3890       65.9498        <.0001
D9            1     -1.7297      0.2245       59.3638        <.0001
D10           1     -1.2851      0.2127       36.5178        <.0001
D11           1     -1.1360      0.2324       23.8998        <.0001
D12           1     -0.6421      0.2428        6.9921        0.0082
PAS           1      0.4428      0.1140       15.0984        0.0001

    Linear Hypotheses Testing Results

                Wald
 Label    Chi-Square      DF    Pr > ChiSq
 pas         15.0984       1        0.0001
* Model D ;
proc logistic data="c:\alda\firstsex_pp" descending ;
  model event = d7 d8 d9 d10 d11 d12 pt pas / noint ;
  pt:  test pt;
  pas: test pas;
run;
         Model Fit Statistics

                Without         With
Criterion     Covariates     Covariates
AIC             1139.534        645.147
SC              1139.534        682.841
-2 Log L        1139.534        629.147

        Testing Global Null Hypothesis: BETA=0
Test                 Chi-Square       DF     Pr > ChiSq
Likelihood Ratio       510.3870        8         <.0001
Score                  432.4782        8         <.0001
Wald                   269.8099        8         <.0001

             Analysis of Maximum Likelihood Estimates
                               Standard          Wald
Parameter    DF    Estimate       Error    Chi-Square    Pr > ChiSq
D7            1     -2.8932      0.3206       81.4252        <.0001
D8            1     -3.5847      0.4231       71.7689        <.0001
D9            1     -2.1502      0.2775       60.0588        <.0001
D10           1     -1.6932      0.2647       40.9314        <.0001
D11           1     -1.5177      0.2757       30.2938        <.0001
D12           1     -1.0099      0.2811       12.9040        0.0003
PT            1      0.6605      0.2367        7.7855        0.0053
PAS           1      0.2964      0.1254        5.5872        0.0181

    Linear Hypotheses Testing Results
                Wald
 Label    Chi-Square      DF    Pr > ChiSq
 pt           7.7855       1        0.0053
 pas          5.5872       1        0.0181
Table 11.4, page 388
Interpreting the results of fitting an initial discrete-time hazard model including the main effect of time. Expressing parameter estimates as fitted odds and fitted hazard probabilities. Note that SAS, by default, will produce the parameter estimate and fitted odds without any extra effort. However, you can use the steps below to capture the output using ODS and then manipulate it to create the table below like Table 14.1 which includes the Fitted Hazard.
* Model A, repeated but capturing parameter estimates in file parest ;
ods output ParameterEstimates=parest ;
proc logistic data="c:\alda\firstsex_pp" descending ;
  model event = d7 d8 d9 d10 d11 d12 / noint ;
run;
ods output close;
<Output suppressed to save space>

* Computing odds and hazard;
data table11_4;
  set parest;
  FittedOdds = exp(Estimate);
  Hazard = 1 / (1 + exp(-Estimate)) ;
run;

proc print data=table11_4;
  var Variable Estimate FittedOdds Hazard ;
run;
                               Fitted
Obs    Variable    Estimate      Odds      Hazard

 1       D7         -2.3979    0.09091    0.08333
 2       D8         -3.1167    0.04430    0.04242
 3       D9         -1.7198    0.17910    0.15190
 4       D10        -1.2867    0.27619    0.21642
 5       D11        -1.1632    0.31250    0.23810
 6       D12        -0.7309    0.48148    0.32500
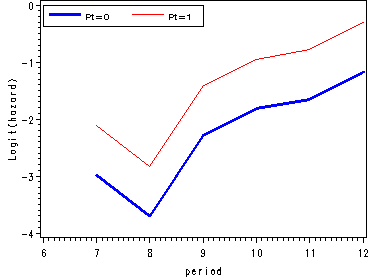
Figure 11.6, page 393
goptions reset=all;
symbol1 c=blue i=j width=2;
symbol2 c=red i=join;
axis1 order=(-4 to 0 by 1) label=(a=90 'Logit(hazard)');
axis2 order=(0 to 0.5 by 0.1) label=(a=90 'Hazard');
axis3 order=(0 to 1 by 0.5) label=(a=90 'Fitted survival probability');
axis4 order=(6 to 12 by 1);
legend1 label=none value=(height=1 font=swiss 'Pt=0' 'Pt=1' )
        position=(top left inside) mode=share cborder=black;
legend2 label=none value=(height=1 font=swiss 'Pt=0' 'Pt=1' )
        position=(bottom left inside) mode=share cborder=black;
proc gplot data=fig3_6;
  format estimate  2.;
  plot (estimate estimate1)*period / overlay vaxis=axis1 haxis=axis4 legend=legend1;
  plot (odds0 odds1)*period / overlay vaxis=axis2 haxis=axis4 legend=legend1;
  plot (survivor0 survivor1)*period / overlay vaxis=axis3 haxis=axis4 legend=legend2
                                      vref=.5 lvref=21 href=9.9 11.8 lhref=21;
run;
quit;
Figure 11.7, page 395
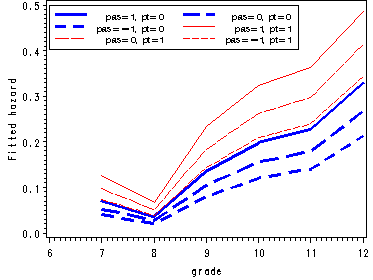
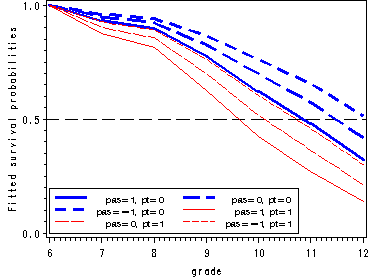
Presents the prototypical hazard and survivor functions for model D in Table 11.3.
Fitting the logistic model with main effects pt and pas and outputting the parameter estimates to the data set estimate.
proc logistic data=datasets.firstsex_pp descending out=estimate noprint;
  model event = d7-d12 PT PAS/noint;
run;
Reconstructing fitted hazard and survivor functions.
data estimate (replace=yes);
  set estimate;
  array time[6] d7-d12;
  do group = 0 to 1;
    do antisocial = -1 to 1;
      survivor = 1;
      do period = 1 to 6;
	grade = period + 6;
        x = time[period] + group*PT +antisocial*PAS;
	hazard = 1/(1 + exp(-x));
	survivor = (1 - hazard)*survivor;
	output;
      end;
    end;
  end;
  keep group antisocial grade x hazard survivor;
run;
Adding initial observations where grade=6 for each combination of pt and pas; generating a variable called ag for each combination of levels for pt and pas for graphing purposes and finally sorting the data.
data temp;
  input survivor antisocial group grade;
cards;
1  1  0  6
1  0  0  6
1 -1  0  6
1  1  1  6
1  0  1  6
1 -1  1  6
;
run;
data estimate;
  set temp estimate;
  if antisocial=1 and group=0 then ag = 1;
  if antisocial=0 and group=0 then ag = 2;
  if antisocial=-1 and group=0 then ag = 3;
  if antisocial=1 and group=1 then ag = 4;
  if antisocial=0 and group=1 then ag = 5;
  if antisocial=-1 and group=1 then ag = 6;
run;
proc sort data=estimate;
  by group antisocial;
run;
goptions reset=all;
symbol1 c=blue i=j width=2;
symbol2 c=blue i=j width=2 l=4;
symbol3 c=blue i=j width=2 l=3;
symbol4 c=red i=j;
symbol5 c=red i=j l=4;
symbol6 c=red i=j l=3;
axis1 order=(0 to 0.5 by 0.1) label=(a=90 'Fitted hazard');
axis2 order=(0 0.5 1.0) label=(a=90 'Fitted survival probabilities');
legend1 label=none value=(height=1 font=swiss
        'pas=1, pt=0'  'pas=0, pt=0' 'pas=-1, pt=0' 'pas=1, pt=1' 'pas=0, pt=1' 'pas=-1, pt=1')
        position=(top left inside) mode=share cborder=black;
legend2 label=none value=(height=1 font=swiss
        'pas=1, pt=0'  'pas=0, pt=0' 'pas=-1, pt=0' 'pas=1, pt=1' 'pas=0, pt=1' 'pas=-1, pt=1')
        position=(bottom left inside) mode=share cborder=black;
proc gplot data=estimate;
  plot hazard*grade=ag / overlay vaxis=axis1 legend=legend1;
  plot survivor*grade=ag / overlay vaxis=axis2 legend=legend2 vref=0.5 lvref=21;
run;
quit;

