Table 15.1, page 548
Including the effects of time-varying predictors in a Cox regression model.
Model A: Predictors include birthyr and the time-invariant predictors earlymj and earlyod.
proc phreg data='c:aldafirstcocaine';
  model cokeage*censor(1)= birthyr earlymj earlyod/ties = efron;
run;

<output omitted>

         Model Fit Statistics

                 Without           With
Criterion     Covariates     Covariates
-2 LOG L        5525.059       5277.228
AIC             5525.059       5283.228
SBC             5525.059       5295.064

                     Analysis of Maximum Likelihood Estimates

                   Parameter      Standard                                  Hazard
Variable    DF      Estimate         Error    Chi-Square    Pr > ChiSq       Ratio
BIRTHYR      1       0.15508       0.01993       60.5637        <.0001       1.168
EARLYMJ      1       1.21707       0.16403       55.0532        <.0001       3.377
EARLYOD      1       0.79121       0.19620       16.2626        <.0001       2.206
Model B: Predictors include birthyr and the time-varying predictors usedmj and usedod.
proc phreg data='c:aldafirstcocaine';
  model cokeage*censor(1)= birthyr usedmj usedod/ties = efron;
  if mjyes = 1 and mjage < cokeage then usedmj = 1;
    else usedmj = 0;
  if odyes = 1 and odage < cokeage then usedod = 1;
    else usedod = 0;
run;

<output omitted>

         Model Fit Statistics

                 Without           With
Criterion     Covariates     Covariates
-2 LOG L        5525.059       4669.096
AIC             5525.059       4675.096
SBC             5525.059       4686.932

                     Analysis of Maximum Likelihood Estimates

                   Parameter      Standard                                  Hazard
Variable    DF      Estimate         Error    Chi-Square    Pr > ChiSq       Ratio
BIRTHYR      1       0.10741       0.02145       25.0797        <.0001       1.113
usedmj       1       2.55177       0.28095       82.4918        <.0001      12.830
usedod       1       1.85386       0.12921      205.8483        <.0001       6.384
Model C: Includes predictor birthyr and the time-varying predictors usedmj, soldmj, usedod and moreod.
proc phreg data='c:aldafirstcocaine';
  model cokeage*censor(1)= birthyr usedmj soldmj usedod moreod/ties = efron;
  if mjyes = 1 and mjage < cokeage then usedmj = 1;
    else usedmj = 0;
  if sellmjyes = 1 and sellmjage < cokeage then soldmj = 1;
    else soldmj = 0;
  if odyes = 1 and odage < cokeage then usedod = 1;
    else usedod = 0;
  if sdyes = 1 and sdage < cokeage then moreod = 1;
    else moreod = 0;
run;

<output omitted>

         Model Fit Statistics

                 Without           With
Criterion     Covariates     Covariates
-2 LOG L        5525.059       4580.537
AIC             5525.059       4590.537
SBC             5525.059       4610.264

                     Analysis of Maximum Likelihood Estimates

                   Parameter      Standard                                  Hazard
Variable    DF      Estimate         Error    Chi-Square    Pr > ChiSq       Ratio
BIRTHYR      1       0.08493       0.02183       15.1321        0.0001       1.089
usedmj       1       2.45920       0.28357       75.2073        <.0001      11.695
soldmj       1       0.68989       0.12263       31.6518        <.0001       1.993
usedod       1       1.25110       0.15656       63.8587        <.0001       3.494
moreod       1       0.76037       0.13066       33.8656        <.0001       2.139
Model D: Includes predictors birthyr and the time-invariant predictors earlymj and earlyod as well as the time-varying predictors usedmj, soldmj, usedod and moreod.
proc phreg data='c:aldafirstcocaine';
  model cokeage*censor(1)= birthyr earlymj usedmj soldmj earlyod usedod moreod/ties = efron;
  if mjyes = 1 and mjage < cokeage then usedmj = 1;
    else usedmj = 0;
  if sellmjyes = 1 and sellmjage < cokeage then soldmj = 1;
    else soldmj = 0;
  if odyes = 1 and odage < cokeage then usedod = 1;
    else usedod = 0;
  if sdyes = 1 and sdage < cokeage then moreod = 1;
    else moreod = 0;
run;

<output omitted>

         Model Fit Statistics

                 Without           With
Criterion     Covariates     Covariates
-2 LOG L        5525.059       4580.311
AIC             5525.059       4594.311
SBC             5525.059       4621.929


                     Analysis of Maximum Likelihood Estimates

                   Parameter      Standard                                  Hazard
Variable    DF      Estimate         Error    Chi-Square    Pr > ChiSq       Ratio
BIRTHYR      1       0.08350       0.02257       13.6855        0.0002       1.087
EARLYMJ      1       0.07527       0.17090        0.1940        0.6596       1.078
usedmj       1       2.45222       0.28425       74.4230        <.0001      11.614
soldmj       1       0.67887       0.12496       29.5160        <.0001       1.972
EARLYOD      1      -0.08028       0.20325        0.1560        0.6929       0.923
usedod       1       1.25429       0.15723       63.6377        <.0001       3.505
moreod       1       0.76378       0.13219       33.3838        <.0001       2.146
Table 15.2, page 555
Comparing alternative imputation strategies for time-varying predictors.
Model A: Predictors include needle and basemood.
proc phreg data='c:aldarelapse_days';
  model days*censor(1)= nasal basemood/ties = efron;
run;

<output omitted>

         Model Fit Statistics

                 Without           With
Criterion     Covariates     Covariates
-2 LOG L         528.186        515.680
AIC              528.186        519.680
SBC              528.186        523.935

                           Analysis of Maximum Likelihood Estimates

                   Parameter      Standard                                  Hazard    Variable
Variable    DF      Estimate         Error    Chi-Square    Pr > ChiSq       Ratio    Label
NASAL        1       1.02073       0.31407       10.5627        0.0012       2.775    NEEDLE
BASEMOOD     1      -0.00375       0.01471        0.0649        0.7989       0.996
Model B: Predictors include needle and weekmood (the value in the immediate prior week).
proc phreg data='c:aldarelapse_days';
  model days*censor(1)=nasal weekmood /ties=efron;
  array mood[12] weekmood1-weekmood12;
  do i=1 to days;
    if (int(days/7)+1)=i then weekmood=mood[i];
  end;
run;

<output omitted>

         Model Fit Statistics

                 Without           With
Criterion     Covariates     Covariates
-2 LOG L         528.186        509.576
AIC              528.186        513.576
SBC              528.186        517.831

                           Analysis of Maximum Likelihood Estimates

                   Parameter      Standard                                  Hazard    Variable
Variable    DF      Estimate         Error    Chi-Square    Pr > ChiSq       Ratio    Label
NASAL        1       1.07958       0.31574       11.6912        0.0006       2.943    NEEDLE
weekmood     1      -0.03490       0.01387        6.3359        0.0118       0.966
Model C: Predictors include needle and daymood (a linearly interpolated estimates of the person's mood on the immediately prior day).
proc phreg data='c:aldarelapse_days';
  model days*censor(1)=nasal intmood/ties=efron;
  array avemood[13] avermood00-avermood12;
  do i=1 to days;
    thisweek = 1+int((i-1)/7);
    thisday  = i - ((thisweek-1)*7);
    intmood=((8-thisday)/7)*avemood[thisweek]+((thisday-1)/7)*avemood[thisweek+1];
  end;
run;

<output omitted>

         Model Fit Statistics

                 Without           With
Criterion     Covariates     Covariates
-2 LOG L         528.186        502.664
AIC              528.186        506.664
SBC              528.186        510.918

                           Analysis of Maximum Likelihood Estimates

                   Parameter      Standard                                  Hazard    Variable
Variable    DF      Estimate         Error    Chi-Square    Pr > ChiSq       Ratio    Label
NASAL        1       1.12075       0.31700       12.5000        0.0004       3.067    NEEDLE
intmood      1      -0.05438       0.01489       13.3307        0.0003       0.947
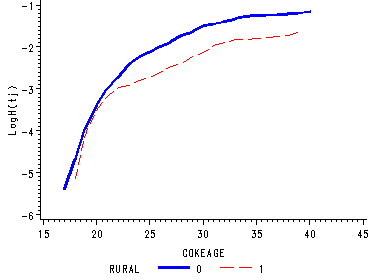
Figure 15.2, page 559
The graphs represent the sample functions of the log cumulative hazard functions for each level of rural.
proc phreg data='c:aldafirstcocaine' noprint;
  model cokeage*censor(1) = ;
  strata rural;
  baseline out=rural loglogs=logh ;
run;
goptions reset=all;
symbol1 c=blue i=j line=1 width=2;
symbol2 c=red i=j line=21;
axis1 label=(a=90 'LogH(tj)');
axis2 order=(15 to 45 by 5);
proc gplot data=rural;
  format cokeage 2.0;
  plot logh*cokeage = rural / vaxis=axis1 haxis=axis2 noframe;
run;
quit;
Table 15.3, page 560
Fitting a stratified Cox regression model
The unstratified model which corresponds to the first column of the table.
proc phreg data='c:aldafirstcocaine';
  model cokeage*censor(1)= birthyr usedmj soldmj usedod moreod/ties = efron;
  if mjyes = 1 and mjage < cokeage then usedmj = 1;
    else usedmj = 0;
  if sellmjyes = 1 and sellmjage < cokeage then soldmj = 1;
    else soldmj = 0;
  if odyes = 1 and odage < cokeage then usedod = 1;
    else usedod = 0;
  if sdyes = 1 and sdage < cokeage then moreod = 1;
    else moreod = 0;
run;

<output omitted>

         Model Fit Statistics

                 Without           With
Criterion     Covariates     Covariates
-2 LOG L        5525.059       4580.537
AIC             5525.059       4590.537
SBC             5525.059       4610.264

                     Analysis of Maximum Likelihood Estimates

                   Parameter      Standard                                  Hazard
Variable    DF      Estimate         Error    Chi-Square    Pr > ChiSq       Ratio
BIRTHYR      1       0.08493       0.02183       15.1321        0.0001       1.089
usedmj       1       2.45920       0.28357       75.2073        <.0001      11.695
soldmj       1       0.68989       0.12263       31.6518        <.0001       1.993
usedod       1       1.25110       0.15656       63.8587        <.0001       3.494
moreod       1       0.76037       0.13066       33.8656        <.0001       2.139
The stratified model corresponding to the second column in the table.
proc phreg data='c:aldafirstcocaine';
  model cokeage*censor(1)= birthyr usedmj soldmj usedod moreod/ties = efron;
  strata rural;
  if mjyes = 1 and mjage < cokeage then usedmj = 1;
    else usedmj = 0;
  if sellmjyes = 1 and sellmjage < cokeage then soldmj = 1;
    else soldmj = 0;
  if odyes = 1 and odage < cokeage then usedod = 1;
    else usedod = 0;
  if sdyes = 1 and sdage < cokeage then moreod = 1;
    else moreod = 0;
run;

<output omitted>

         Model Fit Statistics

                 Without           With
Criterion     Covariates     Covariates
-2 LOG L        5200.202       4271.899
AIC             5200.202       4281.899
SBC             5200.202       4301.626

                     Analysis of Maximum Likelihood Estimates

                   Parameter      Standard                                  Hazard
Variable    DF      Estimate         Error    Chi-Square    Pr > ChiSq       Ratio
BIRTHYR      1       0.08537       0.02187       15.2318        <.0001       1.089
usedmj       1       2.45805       0.28371       75.0643        <.0001      11.682
soldmj       1       0.68486       0.12284       31.0826        <.0001       1.984
usedod       1       1.25185       0.15665       63.8600        <.0001       3.497
moreod       1       0.74679       0.13126       32.3691        <.0001       2.110
Fitting the model separately for each level of rural.
proc sort data='c:aldafirstcocaine' out=sorted;
  by rural;
run;
proc phreg data=sorted;
  model cokeage*censor(1)= birthyr usedmj soldmj usedod moreod/ties = efron;
  by rural;
  if mjyes = 1 and mjage < cokeage then usedmj = 1;
    else usedmj = 0;
  if sellmjyes = 1 and sellmjage < cokeage then soldmj = 1;
    else soldmj = 0;
  if odyes = 1 and odage < cokeage then usedod = 1;
    else usedod = 0;
  if sdyes = 1 and sdage < cokeage then moreod = 1;
    else moreod = 0;
run;

<output omitted>

RURAL=0

         Model Fit Statistics

                 Without           With
Criterion     Covariates     Covariates
-2 LOG L        4586.246       3809.358
AIC             4586.246       3819.358
SBC             4586.246       3838.323

                     Analysis of Maximum Likelihood Estimates

                   Parameter      Standard                                  Hazard
Variable    DF      Estimate         Error    Chi-Square    Pr > ChiSq       Ratio
BIRTHYR      1       0.08127       0.02358       11.8814        0.0006       1.085
usedmj       1       2.43696       0.31545       59.6804        <.0001      11.438
soldmj       1       0.71514       0.13127       29.6793        <.0001       2.044
usedod       1       1.27272       0.17157       55.0304        <.0001       3.571
moreod       1       0.69249       0.14102       24.1143        <.0001       1.999

RURAL=1

         Model Fit Statistics

                 Without           With
Criterion     Covariates     Covariates
-2 LOG L         613.956        460.957
AIC              613.956        470.957
SBC              613.956        480.901

                     Analysis of Maximum Likelihood Estimates

                   Parameter      Standard                                  Hazard
Variable    DF      Estimate         Error    Chi-Square    Pr > ChiSq       Ratio
BIRTHYR      1       0.10977       0.05843        3.5296        0.0603       1.116
usedmj       1       2.51818       0.64874       15.0671        0.0001      12.406
soldmj       1       0.45410       0.35296        1.6552        0.1983       1.575
usedod       1       1.14528       0.38424        8.8840        0.0029       3.143
moreod       1       1.10510       0.35232        9.8383        0.0017       3.020
Table 15.4, page 566
Fitting a non-proportional hazards Cox regression model.
Model A: Predictors include the main effect of treat.
proc phreg data='c:aldalengthofstay';
  model days*censor(1)=treat/ties=efron;
run;

<output omitted>

         Model Fit Statistics

                 Without           With
Criterion     Covariates     Covariates
-2 LOG L        1437.520       1436.628
AIC             1437.520       1438.628
SBC             1437.520       1441.775

                     Analysis of Maximum Likelihood Estimates

                   Parameter      Standard                                  Hazard
Variable    DF      Estimate         Error    Chi-Square    Pr > ChiSq       Ratio
TREAT        1       0.14570       0.15415        0.8934        0.3446       1.157
Model B: The effects of treat varies linearly over time.
proc phreg data='c:aldalengthofstay';
  model days*censor(1)=treat treattime/ties=efron;
  treattime=treat*(days-1);
run;

<output omitted>

         Model Fit Statistics

                 Without           With
Criterion     Covariates     Covariates
-2 LOG L        1437.520       1431.374
AIC             1437.520       1435.374
SBC             1437.520       1441.669

                     Analysis of Maximum Likelihood Estimates

                    Parameter      Standard                                  Hazard
Variable     DF      Estimate         Error    Chi-Square    Pr > ChiSq       Ratio
TREAT         1       0.70613       0.29240        5.8321        0.0157       2.026
treattime     1      -0.02082       0.00921        5.1143        0.0237       0.979
Model C: The effects of treat differ week by week.
proc phreg data='c:aldalengthofstay';
  model days*censor(1)=treat1-treat6/ties=efron;
  array dummy[5] treat1-treat5;
  do i=1 to 5;
    if ceil(days/7) = i then dummy[i]=treat;
    else dummy[i]=0;
  end;
  if days >= 35 then treat6=treat; else treat6=0;
run;

<output omitted>

         Model Fit Statistics

                 Without           With
Criterion     Covariates     Covariates
-2 LOG L        1437.520       1417.730
AIC             1437.520       1429.730
SBC             1437.520       1448.615

                     Analysis of Maximum Likelihood Estimates

                   Parameter      Standard                                  Hazard
Variable    DF      Estimate         Error    Chi-Square    Pr > ChiSq       Ratio
treat1       1       1.57109       0.64060        6.0149        0.0142       4.812
treat2       1       0.56779       0.49285        1.3272        0.2493       1.764
treat3       1       0.84970       0.36207        5.5075        0.0189       2.339
treat4       1      -0.34986       0.36415        0.9231        0.3367       0.705
treat5       1      -0.76597       0.41608        3.3890        0.0656       0.465
treat6       1      -0.09929       0.31105        0.1019        0.7496       0.905
Model D: The effect of treat varies linearly with the logarithm (to base 2) of time.
proc phreg data='c:aldalengthofstay';
  model days*censor(1)=treat treatlt/ties=efron;
  treatlt=treat*log2(days);
run;

<output omitted>

         Model Fit Statistics

                 Without           With
Criterion     Covariates     Covariates
-2 LOG L        1437.520       1423.062
AIC             1437.520       1427.062
SBC             1437.520       1433.357

                     Analysis of Maximum Likelihood Estimates

                   Parameter      Standard                                  Hazard
Variable    DF      Estimate         Error    Chi-Square    Pr > ChiSq       Ratio
TREAT        1       2.53337       0.76031       11.1023        0.0009      12.596
treatlt      1      -0.53009       0.16188       10.7230        0.0011       0.589
Figure 15.3, page 567
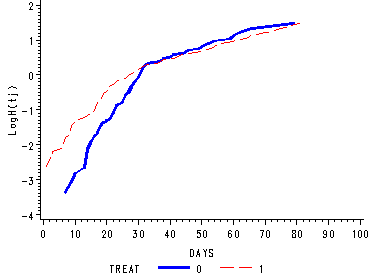
Figure 15.3--top panel
Depicts the log cumulative hazard functions for each level of treat when there is an interaction with time.
proc phreg data='c:aldalengthofstay' noprint;
  model days*censor(1)= /ties=efron;
  strata treat;
  baseline out=treat loglogs=logh;
run;
goptions reset=all;
symbol1 c=blue i=j line=1 width=2;
symbol2 c=red i=j line=21;
axis1 label=(a=90 'LogH(tj)');
proc gplot data=treat;
  plot logh*days=treat /vaxis=axis1 noframe ;
run;
quit;
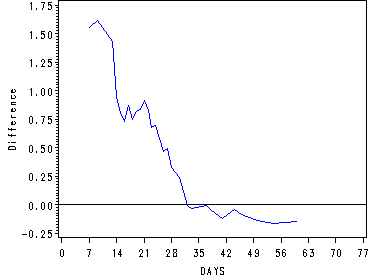
Figure 15.3--bottom panel
The difference in sample log cumulative hazard functions for each level of treat.
data treat0 (where=(treat=0) rename=(logh=logh0))
     treat1 (where=(treat=1) rename=(logh=logh1));
  set treat;
run;

data graph;
  merge treat0 treat1;
  by days;
  difflogh=logh1-logh0;
  drop treat;
run;
goptions reset=all;
symbol1 c=blue i=j;
axis1 label=(a=90 'Difference') order=(-0.25 to 1.75 by 0.25);
axis2 order=(0 to 77 by 7);
proc gplot data=graph;
  plot difflogh*days /vaxis=axis1 haxis=axis2 vref=0;
run;
quit;
Figure 15.4, page 573
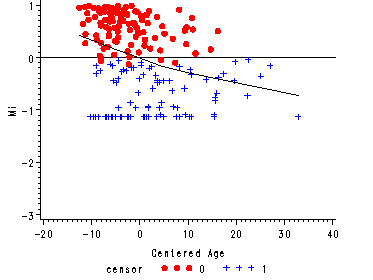
Figure 15.4--top panel
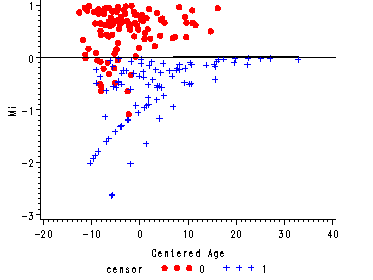
The martingale residual versus the predictor age from the null model with a lowess curve overlaid.
** Computing the martingale residuals for the Null Model **;
proc phreg data='c:aldarearrest' noprint;
  model months*censor(1)=  /ties=efron;
  id id;
  output out=nullres resmart=nullmart  /method=pl;
run;
proc sort data=nullres;
  by id;
run;
data combo_null;
  merge 'c:aldarearrest' nullres;
  drop personal property;
run;
ods output OutputStatistics=nullsm;
ods listing close;
proc loess data=combo_null;
  model nullmart=cage;
  id id;
run;
ods listing;
data nullsm;
  set nullsm;
  Nsmooth = pred;
  keep id Nsmooth;
run;
proc sort data=nullsm;
  by id;
run;
data graph_null;
  merge nullsm combo_null;
  by id;
run;
proc sort data=graph_null;
  by cage;
run;
goptions reset=all;
axis1 order=(-3 to 1 by 1) label=(a=90 'Mi');
axis2 order=(-20 to 40 by 10) label=('Centered Age');
symbol1 color=red  value=dot i=none;
symbol2 color=blue value=plus i=none;
symbol3 color=black value=none i=join;
proc gplot data=graph_null;
  plot1 nullmart*cage=censor/haxis=axis2 vaxis=axis1 vref=0 noframe;
  plot2 Nsmooth *cage=3 / haxis=axis2 vaxis=axis1 noaxis;
run;
quit;
Figure 15.4--bottom panel
The martingale residual versus age for a model that includes age, personal and property (model D of Table 15.1)
proc phreg data='c:aldarearrest' noprint;
  model months*censor(1)=cage personal property/ties=efron;
  id id;
  output out=Dres resdev=Ddev resmart=Dmart/method=pl;
run;
proc sort data=Dres;
  by id;
run;
data comboD;
  merge 'c:aldarearrest' Dres;
  drop personal property;
run;
ods output OutputStatistics=Dsm;
ods listing close;
proc loess data=comboD;
  model Dmart=cage;
  id id;
run;
ods listing;
data Dsm;
  set Dsm;
  Dsmooth = pred;
  keep id Dsmooth;
run;
proc sort data=Dsm;
  by id;
run;
data graphD;
  merge Dsm comboD;
  by id;
run;
proc sort data=graphD;
  by cage;
run;
goptions reset=all;
axis1 order=(-3 to 1 by 1) label=(a=90 'Mi');
axis2 order=(-20 to 40 by 10) label=('Centered Age');
symbol1 color=red  value=dot i=none;
symbol2 color=blue value=plus i=none;
symbol3 color=black value=none i=join;
proc gplot data=graphD;
  plot1 Dmart*cage=censor/ haxis=axis2 vaxis=axis1 vref=0 noframe;
  plot2 Dsmooth*cage=3 / haxis=axis2 vaxis=axis1 noaxis;
run;
quit;
Figure 15.5, page 576
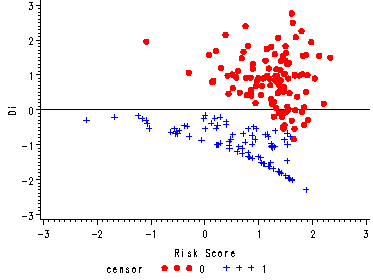
Stem-and-leaf plot, boxplot and scatter plot of the deviance residuals. In the scatter plot the residuals are plotted versus the risk score.
proc phreg data='c:aldarearrest' noprint;
  model months*censor(1)=cage personal property/ties=efron;
  id id;
  output out=Dres resdev=Ddev resmart=Dmart xbeta=risk/method=pl;
run;
proc univariate data=Dres plot;
  var Ddev;
run;

<output omitted>

  Stem Leaf                     #  Boxplot
     26 7                        1     |
     24 00                       2     |
     22 6                        1     |
     20 785                      3     |
     18 23356                    5     |
     16 04795                    5     |
     14 1228055578              10     |
     12 0115                     4     |
     10 022335725789            12     |
      8 1135690001233889999     19  +-----+
      6 2588919                  7  |     |
      4 123678802337            12  |     |
      2 0318                     4  |     |
      0 268978                   6  |  +  |
     -0 97597551                 8  *-----*
     -2 850099554110            12  |     |
     -4 444443332877644210      18  |     |
     -6 876321098874400         15  |     |
     -8 99852176443             11  +-----+
    -10 208776542110            12     |
    -12 87654741                 8     |
    -14 54216                    5     |
    -16 969221                   6     |
    -18 6491                     4     |
    -20 21                       2     |
    -22 09                       2     |
        ----+----+----+----+
    Multiply Stem.Leaf by 10**-1

goptions reset=all;
axis1 order=(-3 to 3 by 1) label=(a=90 'Di');
axis2 label=('Risk Score');
symbol1 color=red  value=dot;
symbol2 color=blue value=plus;
proc gplot data=one;
  plot Ddev*risk=censor/ haxis=axis2 vaxis=axis1 vref=0 noframe;
run;
quit;
Figure 15.6, page 580
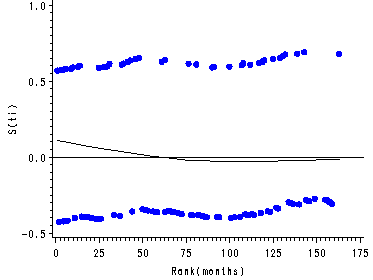
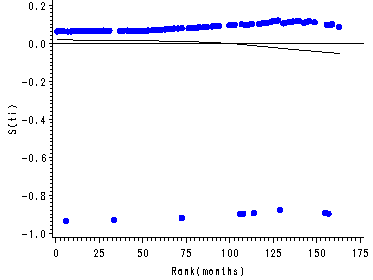
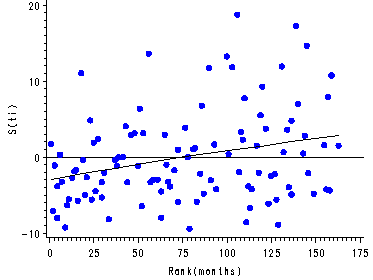
The Schoenfeld residuals from Model D versus ranked event time for the predictors personal, property and age. Each graph includes a lowess curve.
proc rank data='c:aldarearrest' out=one;
  var months;
  ranks ranktime;
run;
proc phreg data='c:aldarearrest' noprint;
  model months*censor(1)=cage property personal/ties=efron;
  id id;
  output out=fitres ressch=schage schprop schpers /method=pl;
run;
proc sort data=fitres;
  by id;
run;
data combo;
  merge one fitres;
  by id;
  if censor = 0;  *only keeping observed observations*;
run;
*Lowess smoothing for AGE *;
ods output OutputStatistics=agesm;
ods listing close;
proc loess data=combo;
  model schage=ranktime;
  id id;
run;
ods listing;
data agesm;
  set agesm;
  lowage = pred;
  keep id lowage;
run;
proc sort data=agesm;
  by id;
run;
* Lowess smoothing for PROPERTY *;
ods output OutputStatistics=propsm;
ods listing close;
proc loess data=combo;
  model schprop=ranktime;
  id id;
run;
ods listing;
data propsm;
  set propsm;
  lowprop = pred;
  keep id lowprop;
run;
proc sort data=propsm;
  by id;
run;
* Lowess smoothing for PERSON *;
ods output OutputStatistics=perssm;
ods listing close;
proc loess data=combo;
  model schpers=ranktime;
  id id;
run;
ods listing;
data perssm;
  set perssm;
  lowpers = pred;
  keep id lowpers;
run;
proc sort data=perssm;
  by id;
run;
* Merging the Schoenfeld residuals and lowess smooths together *;
data all;
  merge combo agesm propsm perssm;
  by id;
run;
proc corr data=all;
  with schpers schprop schage;
  var months ranktime;
run;

<output omitted>

         Pearson Correlation Coefficients, N = 106
                 Prob > |r| under H0: Rho=0

                                        months      ranktime
schpers                               -0.07564      -0.08711
Schoenfeld Residual for personal        0.4409        0.3746

schprop                               -0.09639      -0.06769
Schoenfeld Residual for property        0.3256        0.4906

schage                                 0.25906       0.28199
Schoenfeld Residual for cage            0.0073        0.0034

proc sort data=all;
  by ranktime;
run;
goptions reset=all;
symbol1 color=blue  value=dot;
symbol2 i=join;
axis1  label=('Rank(months)') order=(0 to 175 by 25);
axis2 label=(a=90 'S(ti)') order=(-0.5 to 1.0 by 0.5);
axis3 label=(a=90 'S(ti)') order=(-1 to 0.20 by 0.2);
axis4 label=(a=90 'S(ti)') order=(-10 to 20.0 by 10);
proc gplot data=all;
  plot (schpers lowpers)*ranktime/ overlay haxis=axis1 vaxis=axis2 noframe;
  plot (schprop lowprop)*ranktime/ overlay haxis=axis1 vaxis=axis3 noframe;
  plot (schage lowage)*ranktime/ overlay haxis=axis1 vaxis=axis4 noframe;
run;
quit;
Figure 15.7, page 583
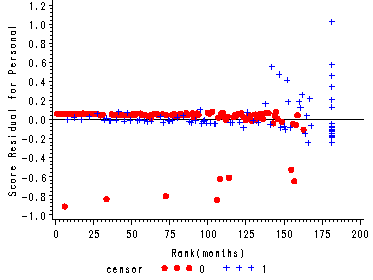
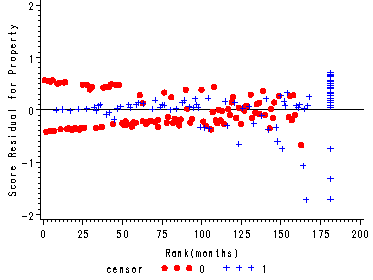
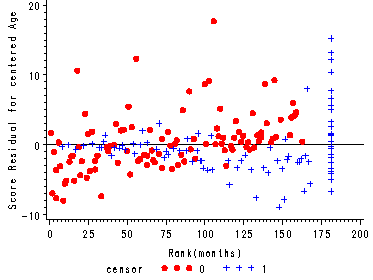
The score residuals versus the ranked event times for each predictor in the three predictor model which includes personal, property and age.
*using the same rank data from fig. 7.6;
proc phreg data='c:aldarearrest' noprint;
  model months*censor(1)=cage personal property/ties=efron;
  id id;
  output out=scores ressco=scoage scoprop scopers/method=pl;
run;
proc sort data=scores;
  by id;
run;
data combo;
  merge one scores;
  by id;
run;
goptions reset=all;
symbol1 color=red  value=dot;
symbol2 color=blue value=plus;
axis1  label=('Rank(months)') order=(0 to 200 by 25);
axis2 label=(a=90 'Score Residual for Personal') order=(-1 to 1.2 by 0.2);
axis3 label=(a=90 'Score Residual for Property') order=(-2 to 2 by 1);
axis4 label=(a=90 'Score Residual for centered Age') order=(-10 to 20.0 by 10);
proc gplot data=combo;
  plot scopers*ranktime=censor/ vref=0 haxis=axis1 vaxis=axis2 noframe;
  plot scoprop*ranktime=censor/ vref=0 haxis=axis1 vaxis=axis3 noframe;
  plot scoage*ranktime=censor/ vref=0 haxis=axis1 vaxis=axis4 noframe;
run;
quit;
Table 15.6, page 587
Illustrates the structure of the Supreme Court data set by displaying the data for three individual judges.
data judges;
  set 'c:aldajudges';
  yearleft = .;
  if leave=1 then yearleft = year + tenure;
  left = 0;
  if dead = 1 then left = 1;
  if retire = 1 then left = 2;
run;
proc format;
  value left 0='censored' 1='dead' 2='retired';
run;
proc print data=judges noobs;
  format left left.;
  where id=2 or id=13 or id=107;
  var id year yearleft left tenure dead retire leave;
run;

 id    year    yearleft    left        tenure    dead    retire    leave
  2    1789      1795      retired        6        0        1        1
 13    1801      1835      dead          34        1        0        1
107    1991         .      censored       8        0        0        0
Table 15.7, page 592
Competing-risk survival analysis.
Model A: Fitting the model for the event of death only.
proc phreg data=judges;
  model tenure*left(0 2) = age year / ties=efron;
run;

<output omitted>

         Model Fit Statistics

                 Without           With
Criterion     Covariates     Covariates
-2 LOG L         351.053        331.447
AIC              351.053        335.447
SBC              351.053        339.147

                     Analysis of Maximum Likelihood Estimates

                   Parameter      Standard                                  Hazard
Variable    DF      Estimate         Error    Chi-Square    Pr > ChiSq       Ratio
age          1       0.06711       0.02386        7.9096        0.0049       1.069
year         1      -0.01160       0.00289       16.0675        <.0001       0.988
Model B: Fitting the model for the event of retirement only.
proc phreg data=judges;
  model tenure*left(0 1) = age year / ties=efron;
run;

<output omitted>

         Model Fit Statistics

                 Without           With
Criterion     Covariates     Covariates
-2 LOG L         395.406        373.497
AIC              395.406        377.497
SBC              395.406        381.437

                     Analysis of Maximum Likelihood Estimates

                   Parameter      Standard                                  Hazard
Variable    DF      Estimate         Error    Chi-Square    Pr > ChiSq       Ratio
age          1       0.10611       0.02579       16.9329        <.0001       1.112
year         1     0.0007141       0.00264        0.0730        0.7870       1.001
Model C: Fitting the model for the combined events of death or retirement.
proc phreg data=judges;
  model tenure*left(0) = age year / ties=efron;
run;

<output omitted>

         Model Fit Statistics

                 Without           With
Criterion     Covariates     Covariates
-2 LOG L         739.620        711.765
AIC              739.620        715.765
SBC              739.620        720.975

                     Analysis of Maximum Likelihood Estimates

                   Parameter      Standard                                  Hazard
Variable    DF      Estimate         Error    Chi-Square    Pr > ChiSq       Ratio
age          1       0.08606       0.01766       23.7585        <.0001       1.090
year         1      -0.00522       0.00188        7.7118        0.0055       0.995
Table 15.8, page 601
Accounting for late entry into the risk set.
Model A: Appropriately including the late entrants.
proc phreg data='c:aldadoctors';
  model exit*censor(1)= parttime age yrage / entry=entry ties=efron;
  yrage = exit*age;
run;

<output omitted>

         Model Fit Statistics

                 Without           With
Criterion     Covariates     Covariates
-2 LOG L        4264.335       4214.515
AIC             4264.335       4220.515
SBC             4264.335       4232.459

                             Analysis of Maximum Likelihood Estimates

                   Parameter      Standard                                  Hazard    Variable
Variable    DF      Estimate         Error    Chi-Square    Pr > ChiSq       Ratio    Label
parttime     1      -1.34730       0.27638       23.7641        <.0001       0.260
age          1       0.04781       0.02421        3.8999        0.0483       1.049    Age at start
yrage        1      -0.02867       0.00906       10.0130        0.0016       0.972
Model B: Fitting the model only to those physicians hired during the measurement window.
proc phreg data='c:aldadoctors';
  where entry=0;
  model exit*censor(1)= parttime age yrage / ties=efron;
  yrage = exit*age;
run;

<output omitted>

         Model Fit Statistics

                 Without           With
Criterion     Covariates     Covariates
-2 LOG L         560.760        558.391
AIC              560.760        564.391
SBC              560.760        570.521

                             Analysis of Maximum Likelihood Estimates

                   Parameter      Standard                                  Hazard    Variable
Variable    DF      Estimate         Error    Chi-Square    Pr > ChiSq       Ratio    Label
parttime     1      -0.17055       0.52080        0.1072        0.7433       0.843
age          1       0.03981       0.04553        0.7647        0.3819       1.041    Age at start
yrage        1      -0.00388       0.04458        0.0076        0.9306       0.996
Model C: Ignoring the presence of late entrants--shown for pedagogical purposes only since it an INCORRECT MODEL.
proc phreg data='c:aldadoctors';
  model exit*censor(1)= parttime age yrage / ties=efron;
  yrage = exit*age;
run;

<output omitted>

         Model Fit Statistics

                 Without           With
Criterion     Covariates     Covariates
-2 LOG L        4539.431       4482.988
AIC             4539.431       4488.988
SBC             4539.431       4500.932

                             Analysis of Maximum Likelihood Estimates

                   Parameter      Standard                                  Hazard    Variable
Variable    DF      Estimate         Error    Chi-Square    Pr > ChiSq       Ratio    Label
parttime     1      -1.33938       0.27649       23.4671        <.0001       0.262
age          1       0.09768       0.01918       25.9326        <.0001       1.103    Age at start
yrage        1      -0.03705       0.00779       22.6284        <.0001       0.964
Table 15.9, page 604
Empirically comparing alternative metrics for clocking time in Cox regression analysis.
Model A: Clocks time using session number.
proc phreg data='c:aldamonkeys';
  model sessions*censor(1) = female bodywt initial_age / ties=efron;
run;

<output omitted>

         Model Fit Statistics

                 Without           With
Criterion     Covariates     Covariates
-2 LOG L         944.449        919.898
AIC              944.449        925.898
SBC              944.449        934.310

                      Analysis of Maximum Likelihood Estimates

                      Parameter      Standard                                  Hazard
Variable       DF      Estimate         Error    Chi-Square    Pr > ChiSq       Ratio
FEMALE          1       0.37197       0.19024        3.8229        0.0506       1.451
BODYWT          1       0.11632       0.02804       17.2124        <.0001       1.123
INITIAL_AGE     1       0.10636       0.03386        9.8698        0.0017       1.112
Model B: Clocks time using age but not accounting for late entry into the risk set.
proc phreg data='c:aldamonkeys';
  model end_age*censor(1) = female bodywt initial_age / ties=efron;
run;

<output omitted>

         Model Fit Statistics

                 Without           With
Criterion     Covariates     Covariates
-2 LOG L         944.449        915.073
AIC              944.449        921.073
SBC              944.449        929.485

                      Analysis of Maximum Likelihood Estimates

                      Parameter      Standard                                  Hazard
Variable       DF      Estimate         Error    Chi-Square    Pr > ChiSq       Ratio
FEMALE          1       0.29077       0.18876        2.3727        0.1235       1.337
BODYWT          1       0.10209       0.02770       13.5841        0.0002       1.107
INITIAL_AGE     1      -0.09391       0.03014        9.7064        0.0018       0.910
Model C: Clocks time using age and appropriately accounts for late entry.
proc phreg data='c:aldamonkeys';
  model end_age*censor(1) = female bodywt initial_age / ties=efron entry=initial_age;
run;

         Model Fit Statistics

                 Without           With
Criterion     Covariates     Covariates
-2 LOG L         914.654        896.822
AIC              914.654        902.822
SBC              914.654        911.234

                      Analysis of Maximum Likelihood Estimates

                      Parameter      Standard                                  Hazard
Variable       DF      Estimate         Error    Chi-Square    Pr > ChiSq       Ratio
FEMALE          1       0.31176       0.18785        2.7543        0.0970       1.366
BODYWT          1       0.10255       0.02771       13.6994        0.0002       1.108
INITIAL_AGE     1      -0.01891       0.03493        0.2931        0.5883       0.981

