Note: This page is done using SAS 9.3 and is based on SAS code provided by Raymond R. Balise of Stanford University. We thank Raymond R. Balise for sharing his SAS 9.2 code with us.
*Figure 2.1 on page 18.;
title1 "Figure 2.1a 'Person-level' data set";
proc print data='c:\alda\tolerance';
run;

Figure 2.1a Person-level data set

Obs      ID    TOL11    TOL12    TOL13    TOL14    TOL15    MALE    EXPOSURE
  1       9     2.23     1.79     1.90     2.12     2.66      0       1.54
  2      45     1.12     1.45     1.45     1.45     1.99      1       1.16
  3     268     1.45     1.34     1.99     1.79     1.34      1       0.90
  4     314     1.22     1.22     1.55     1.12     1.12      0       0.81
  5     442     1.45     1.99     1.45     1.67     1.90      0       1.13
  6     514     1.34     1.67     2.23     2.12     2.44      1       0.90
  7     569     1.79     1.90     1.90     1.99     1.99      0       1.99
  8     624     1.12     1.12     1.22     1.12     1.22      1       0.98
  9     723     1.22     1.34     1.12     1.00     1.12      0       0.81
 10     918     1.00     1.00     1.22     1.99     1.22      0       1.21
 11     949     1.99     1.55     1.12     1.45     1.55      1       0.93
 12     978     1.22     1.34     2.12     3.46     3.32      1       1.59
 13    1105     1.34     1.90     1.99     1.90     2.12      1       1.38
 14    1542     1.22     1.22     1.99     1.79     2.12      0       1.44
 15    1552     1.00     1.12     2.23     1.55     1.55      0       1.04
 16    1653     1.11     1.11     1.34     1.55     2.12      0       1.25
 *Creating a person-period data set from a balanced person-level data set;
data tolerance_pp;
set 'c:\alda\tolerance';
array Atol [11:15] tol11-tol15;
do age=11 to 15; tol = Atol[age];
time = age - 11;
output;
end;
keep id age time tol male exposure;
run;
title1 "Figure 2.1b 'Person-Period' data set";
proc print data=tolerance_pp;
var id age tol male exposure; run;
*Figure 2.1b Person-Period data set; Obs ID age tol MALE EXPOSURE 1 9 11 2.23 0 1.54 2 9 12 1.79 0 1.54 3 9 13 1.90 0 1.54 4 9 14 2.12 0 1.54 5 9 15 2.66 0 1.54 6 45 11 1.12 1 1.16 7 45 12 1.45 1 1.16 ……………………………………. 72 1552 12 1.12 0 1.04 73 1552 13 2.23 0 1.04 74 1552 14 1.55 0 1.04 75 1552 15 1.55 0 1.04 76 1653 11 1.11 0 1.25 77 1653 12 1.11 0 1.25 78 1653 13 1.34 0 1.25 79 1653 14 1.55 0 1.25 80 1653 15 2.12 0 1.25
 *Table 2.1, page 20; title1 'Table 2.1: Estimated bivariate correlations among tolerance scores'; options nocenter nodate nolabel;
proc corr data='c:/alda/tolerance' nosimple noprob;
var tol11-tol15;
run;
Table 2.1: Estimated bivariate correlations among tolerance scores The CORR Procedure 5 Variables: TOL11 TOL12 TOL13 TOL14 TOL15 Pearson Correlation Coefficients, N = 16 TOL11 TOL12 TOL13 TOL14 TOL15 TOL11 1.00000 0.65729 0.06195 0.14076 0.26354 TOL12 0.65729 1.00000 0.24755 0.20562 0.39228 TOL13 0.06195 0.24755 1.00000 0.58717 0.56921 TOL14 0.14076 0.20562 0.58717 1.00000 0.82546 TOL15 0.26354 0.39228 0.56921 0.82546 1.00000
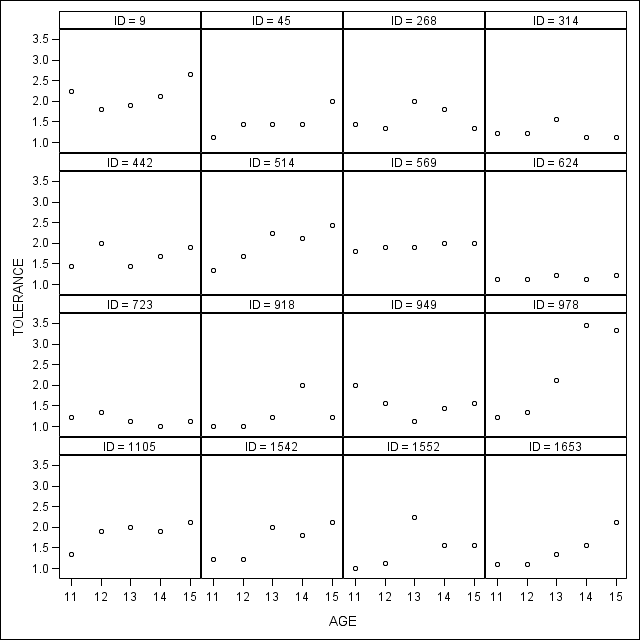
 *Figure 2.2 , page 25.;
proc sgpanel data = tolerance_pp;
panelby id /columns=4 rows= 4;
scatter y = tol x = age; run;
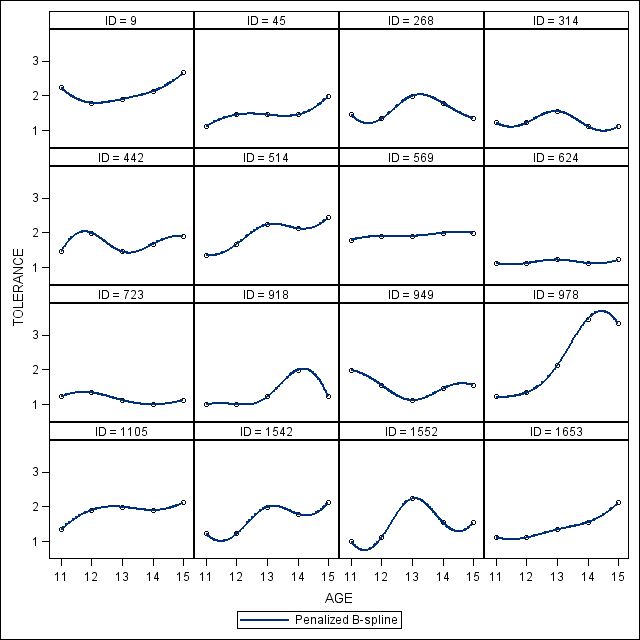
 *Figure 2.3, page 27.;
proc sgpanel data = tolerance_pp (rename=(tol=tolerance));
panelby id /columns=4 rows= 4;
pbspline y = tolerance x = age;
run;
*Table 2.2, page 30.; proc sort data = tolerance_pp; by male exposure id; run;
proc reg data = tolerance_pp outest = expl (drop = _MODEL_ _in_ _p_ _edf_) outseb rsquare noprint; by male exposure id; model tol = time; run;
proc sort data = expl; by id _type_; run;
data expl2 (rename = (a0=intercept a1 = time)); set expl; by id; r2 = lag(_rsq_); retain a0 se_intercept a1 se_time res_var r2; if first.id then do; a0 = intercept; a1 = time; end; if _type_ =”SEB” then do; se_intercept = intercept; se_time = time; res_var = _rmse_**2; end; if last.id; keep id a0 se_intercept a1 se_time res_var r2 male exposure; run;
proc print data = expl2 noobs; var id intercept se_intercept time se_time res_var r2 male exposure; format _numeric_ 4.2; format id 4.0; run; ID intercept se_intercept time se_time res_var r2 MALE EXPOSURE 9 1.90 0.25 0.12 0.10 0.11 0.31 0.00 1.54 45 1.14 0.13 0.17 0.05 0.03 0.77 1.00 1.16 268 1.54 0.26 0.02 0.11 0.11 0.02 1.00 0.90 314 1.31 0.15 -.03 0.06 0.04 0.07 0.00 0.81 442 1.58 0.21 0.06 0.08 0.07 0.13 0.00 1.13 514 1.43 0.14 0.26 0.06 0.03 0.88 1.00 0.90 569 1.82 0.03 0.05 0.01 0.00 0.88 0.00 1.99 624 1.12 0.04 0.02 0.02 0.00 0.33 1.00 0.98 723 1.27 0.08 -.05 0.03 0.01 0.45 0.00 0.81 918 1.00 0.30 0.14 0.12 0.15 0.31 0.00 1.21 949 1.73 0.24 -.10 0.10 0.10 0.25 1.00 0.93 978 1.03 0.32 0.63 0.13 0.17 0.89 1.00 1.59 1105 1.54 0.15 0.16 0.06 0.04 0.68 1.00 1.38 1542 1.19 0.18 0.24 0.07 0.05 0.78 0.00 1.44 1552 1.18 0.37 0.15 0.15 0.23 0.25 0.00 1.04 1653 0.95 0.14 0.25 0.06 0.03 0.86 0.00 1.25
 *Figure 2.4, page 31;
proc univariate data=expl2 plot;
var intercept time res_var r2;
run;
<output edited to show just stem and leaf plot> Variable: intercept Stem Leaf 18 20 16 3 14 3448 12 71 10 032489 8 5 —-+—-+—-+—-+ Multiply Stem.Leaf by 10**-1 Variable: time Stem Leaf 6 3 5 4 3 2 456 1 24567 0 2256 -0 53 -1 0 —-+—-+—-+—-+ Multiply Stem.Leaf by 10**-1 Variable: res_var Stem Leaf 2 3 1 57 1 011 0 57 0 00133344 —-+—-+—-+—-+ Multiply Stem.Leaf by 10**-1 Variable: r2 Stem Leaf 8 6889 7 78 6 8 5 4 5 3 113 2 55 1 3 0 27 —-+—-+—-+—-+ Multiply Stem.Leaf by 10**-1
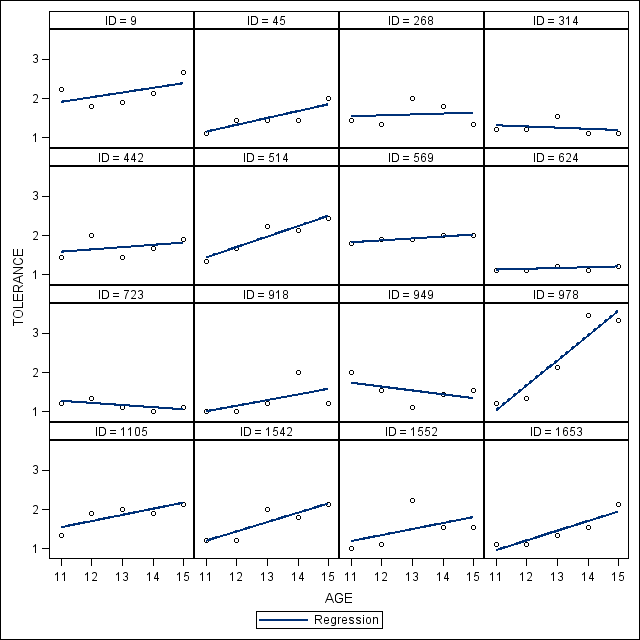
 *Figure 2.5, page 32.;
proc sgpanel data = tolerance_pp (rename=(tol=tolerance));
panelby id /columns=4 rows= 4;
reg y = tolerance x = age;
run;
quit;
 *Figure 2.6, page 34;
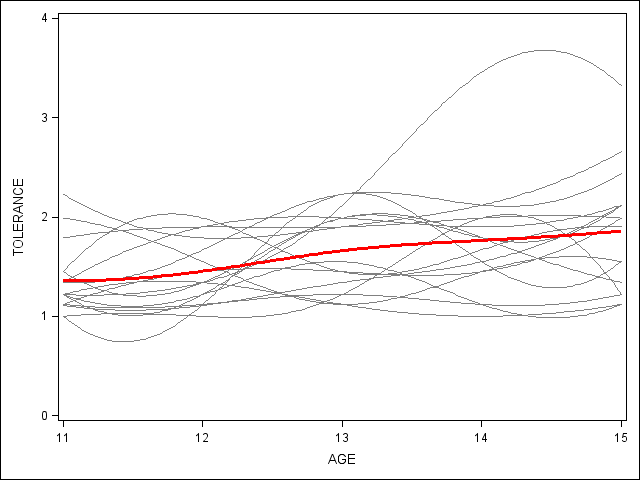
proc sgplot data=tolerance_pp (rename=(tol=tolerance)) noautolegend ;
* spaghetti plot;
yaxis min = 0 max = 4; pbspline x=age y=tolerance / group = id nomarkers LINEATTRS = (COLOR= gray PATTERN = 1 THICKNESS = 1) ;
* overall spline;
pbspline x=age y=tolerance / nomarkers LINEATTRS = (COLOR= red PATTERN = 1 THICKNESS = 3) ;
run;
quit;
proc sgplot data=tolerance_pp (rename=(tol=tolerance)) noautolegend ;
* spaghetti plot;
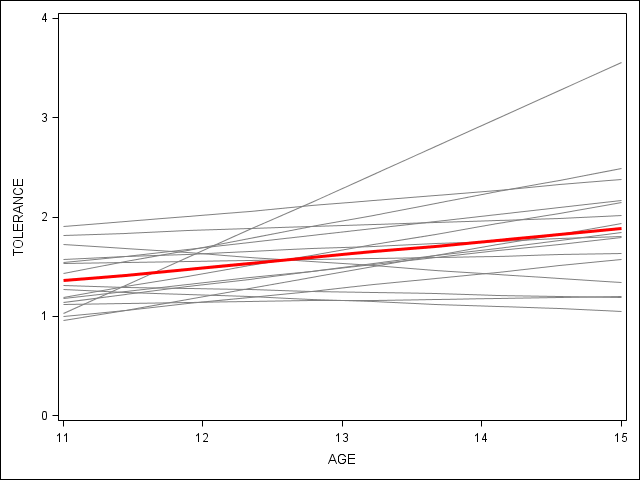
yaxis min = 0 max = 4; reg x=age y=tolerance / group = id nomarkers LINEATTRS = (COLOR= gray PATTERN = 1 THICKNESS = 1) ;
* overall spline;
reg x=age y=tolerance / nomarkers LINEATTRS = (COLOR= red PATTERN = 1 THICKNESS = 3) ;
run;
quit;
 *Table 2.3, page 37;
proc corr data = expl2;
var intercept time;
run;
Simple Statistics Variable N Mean Std Dev Sum Minimum Maximum Label intercept 16 1.35775 0.29778 21.72400 0.95400 1.90200 Initial Status time 16 0.13081 0.17230 2.09300 -0.09800 0.63200 Rate of Change Pearson Correlation Coefficients, N = 16 Prob > |r| under H0: Rho=0 intercept time intercept 1.00000 -0.44811 Initial Status 0.0817 time -0.44811 1.00000 Rate of Change 0.0817
 *Figure 2.7, page 38.;
proc sgpanel data=tolerance_pp (rename=(tol=tolerance)) noautolegend;
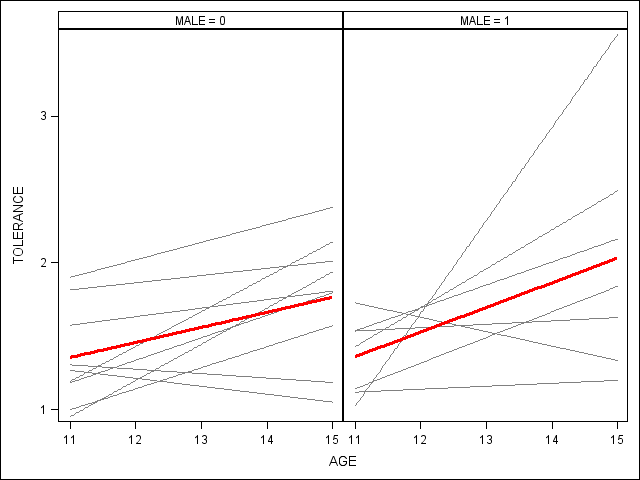
 panelby male;
reg x=age y=tolerance / group = id nomarkers LINEATTRS = (COLOR= gray PATTERN = 1 THICKNESS = 1);
* overall spline;
reg x=age y=tolerance / nomarkers LINEATTRS = (COLOR= red PATTERN = 1 THICKNESS = 3);
run;
proc means data = tolerance_pp median; var exposure;
output out = t median = m;
run;

data _null_;
set t;
call symput('exp', m);
run;

proc format;
value exp 0 = "Low exposure" 1 = "High exposure"; run; data to_exp; set tolerance_pp; if exposure < &exp then exp_cat = 0;
else exp_cat = 1; format exp_cat exp.;
rename tol = tolerance;
run;

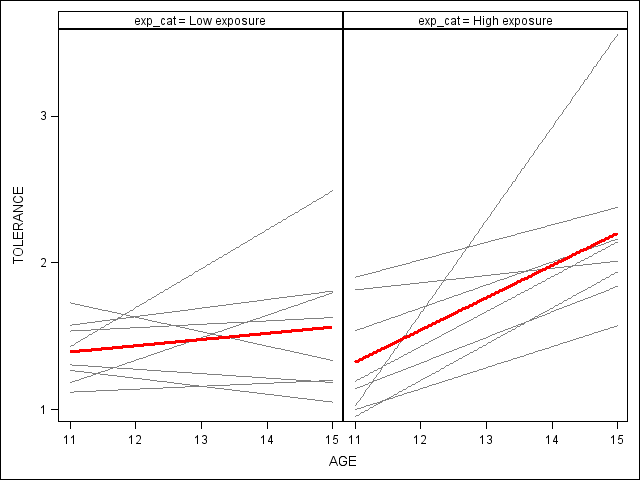
proc sgpanel data=to_exp noautolegend;
panelby exp_cat; reg x=age y=tolerance / group = id nomarkers LINEATTRS = (COLOR= gray PATTERN = 1 THICKNESS = 1);
* overall spline;
reg x=age y=tolerance / nomarkers LINEATTRS = (COLOR= red PATTERN = 1 THICKNESS = 3);
run;
quit;
 *Figure 2.8, page 40;
ods output PearsonCorr = pcorr;
proc corr data = expl2 nosimple noprob;
var intercept time;
with male exposure;
run;

data _null_;
set pcorr;
if _n_ = 1 then do;
call symput('male_int', put(intercept, 4.2));
call symput('male_time', put(time, 4.2));
end;
if _n_ = 2 then do;
call symput('exp_int', put(intercept, 4.2));
call symput('exp_time', put(time, 4.2));
end;
run;

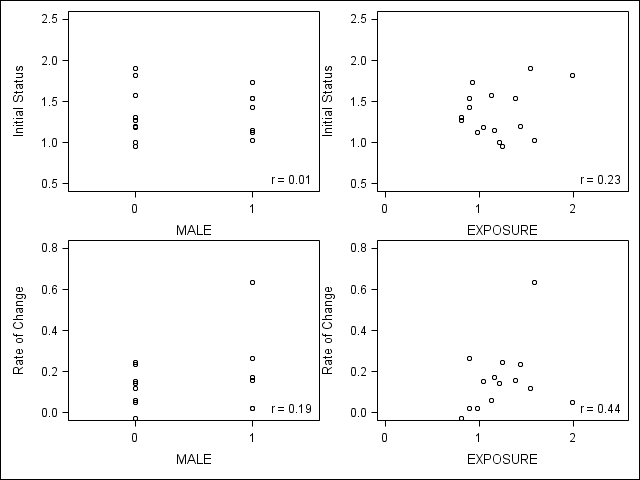
title "Figure 2.8 'Examining relationship'";
proc template;
define statgraph fourPlots;
begingraph;
layout gridded / columns=2 rows=2;
layout overlay / yaxisopts=(linearopts=(viewmin=.5 viewmax= 2.5)) xaxisopts=(linearopts=(viewmin=-.5 viewmax= 1.5 tickvaluelist=(0 1))) autoalign=(topleft topright);
scatterplot x=male y=intercept;
layout gridded / autoalign=(BottomRight) border = false ;
entry halign=left "r = &male_int" ; endlayout; endlayout;
layout overlay / yaxisopts=(linearopts=(viewmin=.5 viewmax= 2.5)) xaxisopts=(linearopts=(viewmin=0 viewmax= 2.5 tickvaluelist=(0 1 2)));
scatterplot x=exposure y=intercept;
layout gridded / autoalign=(BottomRight) border = false ;
entry halign=left "r = &exp_int" ; endlayout; endlayout; layout overlay / yaxisopts=(linearopts=(viewmin=0 viewmax= .8)) xaxisopts=(linearopts=(viewmin=-0.5 viewmax= 1.5 tickvaluelist=(0 1)));
scatterplot x=male y=time; layout gridded / autoalign=(BottomRight) border = false ;
entry halign=left "r = &male_time" ;
endlayout;
endlayout;
layout overlay / yaxisopts=(linearopts=(viewmin=0 viewmax= .8)) xaxisopts=(linearopts=(viewmin=0 viewmax= 2.5 tickvaluelist=(0 1 2)));
scatterplot x=exposure y=time;
layout gridded / autoalign=(BottomRight) border = false ;
entry halign=left "r = &exp_time" ;
endlayout;
endlayout;
endlayout;
endgraph;
end;
run;

proc sgrender data=expl2 template=fourPlots;
run;
