page 3 Table 1.1 Age and coronary heart disease (chd) status of 100 subjects.
data chdage1;
  set 'd:hosmerdatachdage';
  agrp = .;
  if age le 29 then agrp = 1;
  if age ge 30 and age < 35 then agrp = 2;
  if age ge 35 and age < 40 then agrp = 3;
  if age ge 40 and age < 45 then agrp = 4;
  if age ge 45 and age < 50 then agrp = 5;
  if age ge 50 and age < 55 then agrp = 6;
  if age ge 55 and age < 60 then agrp = 7;
  if age ge 60 then agrp = 8;
run;
proc print data=chdage1;
  var id age agrp chd;
run;
Obs ID AGE agrp CHD 1 1 20 1 0 2 2 23 1 0 3 3 24 1 0 4 4 25 1 0 5 5 25 1 1 6 6 26 1 0 7 7 26 1 0 8 8 28 1 0 9 9 28 1 0 10 10 29 1 0 11 11 30 2 0 12 12 30 2 0 13 13 30 2 0 14 14 30 2 0 15 15 30 2 0 16 16 30 2 1 17 17 32 2 0 18 18 32 2 0 19 19 33 2 0 20 20 33 2 0 21 21 34 2 0 22 22 34 2 0 23 23 34 2 1 24 24 34 2 0 25 25 34 2 0 26 26 35 3 0 27 27 35 3 0 28 28 36 3 0 29 29 36 3 1 30 30 36 3 0 31 31 37 3 0 32 32 37 3 1 33 33 37 3 0 34 34 38 3 0 35 35 38 3 0 36 36 39 3 0 37 37 39 3 1 38 38 40 4 0 39 39 40 4 1 40 40 41 4 0 41 41 41 4 0 42 42 42 4 0 43 43 42 4 0 44 44 42 4 0 45 45 42 4 1 46 46 43 4 0 47 47 43 4 0 48 48 43 4 1 49 49 44 4 0 50 50 44 4 0 51 51 44 4 1 52 52 44 4 1Obs ID AGE agrp CHD 53 53 45 5 0 54 54 45 5 1 55 55 46 5 0 56 56 46 5 1 57 57 47 5 0 58 58 47 5 0 59 59 47 5 1 60 60 48 5 0 61 61 48 5 1 62 62 48 5 1 63 63 49 5 0 64 64 49 5 0 65 65 49 5 1 66 66 50 6 0 67 67 50 6 1 68 68 51 6 0 69 69 52 6 0 70 70 52 6 1 71 71 53 6 1 72 72 53 6 1 73 73 54 6 1 74 74 55 7 0 75 75 55 7 1 76 76 55 7 1 77 77 56 7 1 78 78 56 7 1 79 79 56 7 1 80 80 57 7 0 81 81 57 7 0 82 82 57 7 1 83 83 57 7 1 84 84 57 7 1 85 85 57 7 1 86 86 58 7 0 87 87 58 7 1 88 88 58 7 1 89 89 59 7 1 90 90 59 7 1 91 91 60 8 0 92 92 60 8 1 93 93 61 8 1 94 94 62 8 1 95 95 62 8 1 96 96 63 8 1 97 97 64 8 0 98 98 64 8 1 99 99 65 8 1 100 100 69 8 1
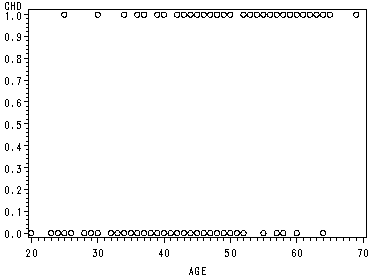
page 4 Figure 1.1 Scatterplot of chd by age for 100 subjects.
filename outgraph 'd:https://stats.idre.ucla.edu/wp-content/uploads/2016/02/hlch1sas1.gif';
goptions gsfname=outgraph dev=gif373;
symbol1 value=circle;
proc gplot data=chdage1;
  plot chd*age;
run;
quit;
page 4 Table 1.2 Frequency table of age group by chd.
NOTE: The row percent gives the data listed in the ‘mean’ column. Because SAS gives a percent instead of a proportion (as shown in the text) the decimal is moved over two places.
proc freq data=chdage1;
  tables agrp*chd / out=chdage2 outpct;
run;
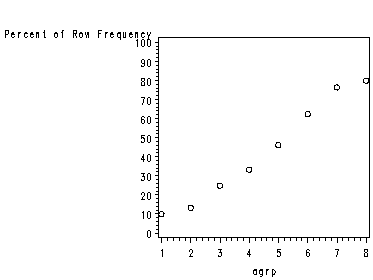
page 5 Figure 1.2 Plot of the percentage of subjects with CHD in each age group.
filename outgraph 'd:https://stats.idre.ucla.edu/wp-content/uploads/2016/02/hlch1sas2.gif';
goptions gsfname=outgraph dev=gif373;
symbol1 color=black i=none value=circle height=1;
axis1 order=(0 to 100 by 10);
axis2 order=(1 to 8 by 1);
proc gplot data=chdage2;
  where chd = 1;
  plot pct_row*agrp / haxis=axis2 vaxis=axis1;
run;
quit;
page 10 Table 1.3 Results of fitting the logistic regression model to the data in Table 1.1.
NOTE: To get the Wald tests shown in the text, take the square root of the chi-squares given in the SAS output.
NOTE: We have bolded the relevant output.
proc logistic data=chdage1 covout outest=chdage3 descending;
  model chd = age;
run;
quit;
The LOGISTIC ProcedureModel Information Data Set WORK.CHDAGE1 Response Variable CHD Number of Response Levels 2 Number of Observations 100 Link Function Logit Optimization Technique Fisher’s scoring Response Profile
Ordered Total Value CHD Frequency 1 1 43 2 0 57 Model Convergence Status Convergence criterion (GCONV=1E-8) satisfied. Model Fit Statistics
Intercept Intercept and Criterion Only Covariates AIC 138.663 111.353 SC 141.268 116.563 -2 Log L 136.663 107.353 Testing Global Null Hypothesis: BETA=0
Test Chi-Square DF Pr > ChiSq Likelihood Ratio 29.3099 1 <.0001 Score 26.3989 1 <.0001 Wald 21.2541 1 <.0001 Analysis of Maximum Likelihood Estimates
Standard Parameter DF Estimate Error Chi-Square Pr > ChiSq Intercept 1 -5.3095 1.1337 21.9350 <.0001 AGE 1 0.1109 0.0241 21.2541 <.0001
The LOGISTIC Procedure
Odds Ratio Estimates
Point 95% Wald Effect Estimate Confidence Limits AGE 1.117 1.066 1.171 Association of Predicted Probabilities and Observed Responses Percent Concordant 79.0 Somers’ D 0.600 Percent Discordant 19.0 Gamma 0.612 Percent Tied 2.0 Tau-a 0.297 Pairs 2451 c 0.800
page 20 Table 1.4 Estimated covariance matrix of the estimated coefficients in Table 1.3.
proc print data=chdage3;
run;
Obs _LINK_ _TYPE_ _STATUS_ _NAME_ Intercept AGE _LNLIKE_1 LOGIT PARMS 0 Converged CHD -5.30945 0.11092 -53.6765 2 LOGIT COV 0 Converged Intercept 1.28517 -0.02668 -53.6765 3 LOGIT COV 0 Converged AGE -0.02668 0.00058 -53.6765


