options nodate nocenter;
Inputting the Toluca Company data.
data ch1tab01;
  input x y;
  label x = 'Lot Size'
        y = 'Work Hrs';
cards;
   80  399
   30  121
   50  221
   90  376
   70  361
   60  224
  120  546
   80  352
  100  353
   50  157
   40  160
   70  252
   90  389
   20  113
  110  435
  100  420
   30  212
   50  268
   90  377
  110  421
   30  273
   90  468
   40  244
   80  342
   70  323
;
run;
Table 1.1, p. 21.
proc sql;
  create table temp as
  select *, x - mean(x) as xdif, y - mean(y) as ydif, (x - mean(x))*( y - mean(y)) as crp,
           (x - mean(x))*(x - mean(x)) as sqdevx, (y - mean(y))*(y - mean(y)) as sqdevy
  from ch1tab01;
quit;
proc print data = temp;
  var x y xdif ydif crp sqdevx sqdevy;
run;
Obs x y xdif ydif crp sqdevx sqdevy1 80 399 10 86.72 867.2 100 7520.36 2 30 121 -40 -191.28 7651.2 1600 36588.04 3 50 221 -20 -91.28 1825.6 400 8332.04 4 90 376 20 63.72 1274.4 400 4060.24 5 70 361 0 48.72 0.0 0 2373.64 6 60 224 -10 -88.28 882.8 100 7793.36 7 120 546 50 233.72 11686.0 2500 54625.04 8 80 352 10 39.72 397.2 100 1577.68 9 100 353 30 40.72 1221.6 900 1658.12 10 50 157 -20 -155.28 3105.6 400 24111.88 11 40 160 -30 -152.28 4568.4 900 23189.20 12 70 252 0 -60.28 0.0 0 3633.68 13 90 389 20 76.72 1534.4 400 5885.96 14 20 113 -50 -199.28 9964.0 2500 39712.52 15 110 435 40 122.72 4908.8 1600 15060.20 16 100 420 30 107.72 3231.6 900 11603.60 17 30 212 -40 -100.28 4011.2 1600 10056.08 18 50 268 -20 -44.28 885.6 400 1960.72 19 90 377 20 64.72 1294.4 400 4188.68 20 110 421 40 108.72 4348.8 1600 11820.04 21 30 273 -40 -39.28 1571.2 1600 1542.92 22 90 468 20 155.72 3114.4 400 24248.72 23 40 244 -30 -68.28 2048.4 900 4662.16 24 80 342 10 29.72 297.2 100 883.28 25 70 323 0 10.72 0.0 0 114.92
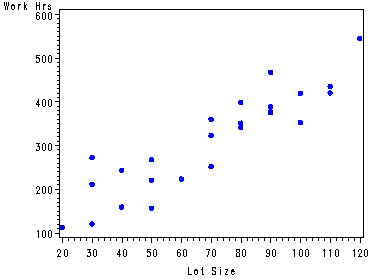
Fig. 1.10a, p. 22.
symbol1 v=dot h=.8 c=blue;
proc gplot data = ch1tab01;
  plot y*x;
run;
quit;
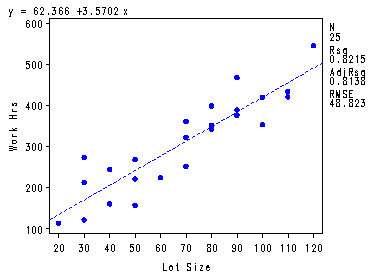
Fig. 1.10b, p. 22.
proc reg data = ch1tab01;
  model y = x;
  plot y*x;
run;
quit;
Fig. 1.11, p.23.
The REG Procedure Model: MODEL1 Dependent Variable: y Work HrsAnalysis of Variance
Sum of Mean Source DF Squares Square F Value Pr > F
Model 1 252378 252378 105.88 <.0001 Error 23 54825 2383.71562 Corrected Total 24 307203
Root MSE 48.82331 R-Square 0.8215 Dependent Mean 312.28000 Adj R-Sq 0.8138 Coeff Var 15.63447
Parameter Estimates
Parameter Standard Variable Label DF Estimate Error t Value Pr > |t|
Intercept Intercept 1 62.36586 26.17743 2.38 0.0259 x Lot Size 1 3.57020 0.34697 10.29 <.0001
Obtaining the residuals and the squared residuals, table 1.2, p. 24.
proc reg data = ch1tab01 noprint;
  model y = x;
  output out=temp p=yhat r=residual;
run;
quit;
data temp1;
  set temp;
  rsq = residual**2;
run;
proc print data = temp1;
  var x y yhat residual rsq;
run;
Obs x y yhat residual rsq1 80 399 347.982 51.018 2602.83 2 30 121 169.472 -48.472 2349.53 3 50 221 240.876 -19.876 395.05 4 90 376 383.684 -7.684 59.04 5 70 361 312.280 48.720 2373.64 6 60 224 276.578 -52.578 2764.44 7 120 546 490.790 55.210 3048.13 8 80 352 347.982 4.018 16.14 9 100 353 419.386 -66.386 4407.11 10 50 157 240.876 -83.876 7035.18 11 40 160 205.174 -45.174 2040.68 12 70 252 312.280 -60.280 3633.68 13 90 389 383.684 5.316 28.26 14 20 113 133.770 -20.770 431.39 15 110 435 455.088 -20.088 403.53 16 100 420 419.386 0.614 0.38 17 30 212 169.472 42.528 1808.64 18 50 268 240.876 27.124 735.71 19 90 377 383.684 -6.684 44.68 20 110 421 455.088 -34.088 1162.00 21 30 273 169.472 103.528 10718.06 22 90 468 383.684 84.316 7109.18 23 40 244 205.174 38.826 1507.46 24 80 342 347.982 -5.982 35.78 25 70 323 312.280 10.720 114.92


