Inputting the Wine Judging Data, table 29.2, p. 1169.
data wine;
  input rating judge wine;
cards;
  20  1  1
  24  1  2
  28  1  3
  28  1  4
  15  2  1
  18  2  2
  23  2  3
  24  2  4
  18  3  1
  19  3  2
  24  3  3
  23  3  4
  26  4  1
  26  4  2
  30  4  3
  30  4  4
  22  5  1
  24  5  2
  28  5  3
  26  5  4
  19  6  1
  21  6  2
  27  6  3
  25  6  4
;
run;
ANOVA table of the wine data, table 29.3, p. 1171, including a test of the main effect of wine, p. 1170.
From the means statement we obtain the factor means and the grand mean is part of the standard output of proc glm, table 29.2, p. 1169.
proc glm data=wine;
  class wine judge;
  model rating = wine judge;
  means judge wine;
run;
quit;
The GLM ProcedureClass Level Information
Class Levels Values wine 4 1 2 3 4 judge 6 1 2 3 4 5 6
Number of observations 24 The GLM Procedure Dependent Variable: rating Sum of Source DF Squares Mean Square F Value Pr > F Model 8 357.3333333 44.6666667 41.87 <.0001 Error 15 16.0000000 1.0666667 Corrected Total 23 373.3333333
R-Square Coeff Var Root MSE rating Mean 0.957143 4.363925 1.032796 23.66667
Source DF Type I SS Mean Square F Value Pr > F wine 3 184.0000000 61.3333333 57.50 <.0001 judge 5 173.3333333 34.6666667 32.50 <.0001
Source DF Type III SS Mean Square F Value Pr > F wine 3 184.0000000 61.3333333 57.50 <.0001 judge 5 173.3333333 34.6666667 32.50 <.0001
The GLM Procedure
Level of ————rating———– judge N Mean Std Dev 1 4 25.0000000 3.82970843 2 4 20.0000000 4.24264069 3 4 21.0000000 2.94392029 4 4 28.0000000 2.30940108 5 4 25.0000000 2.58198890 6 4 23.0000000 3.65148372 Level of ————rating———– wine N Mean Std Dev 1 6 20.0000000 3.74165739 2 6 22.0000000 3.16227766 3 6 26.6666667 2.65832027 4 6 26.0000000 2.60768096
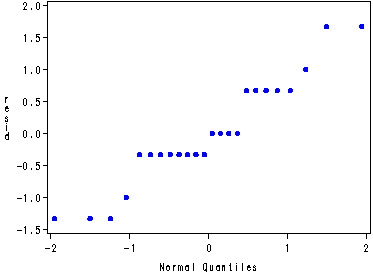
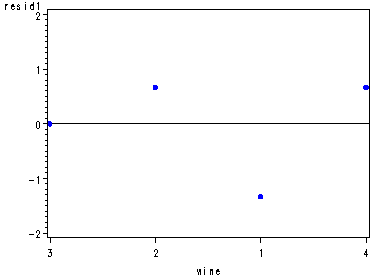
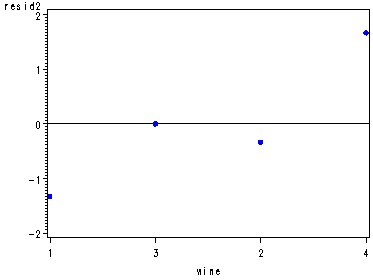
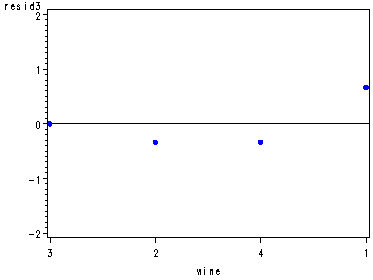
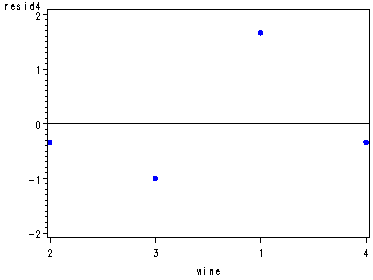
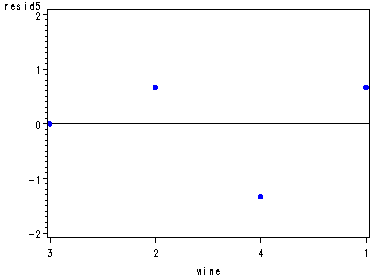
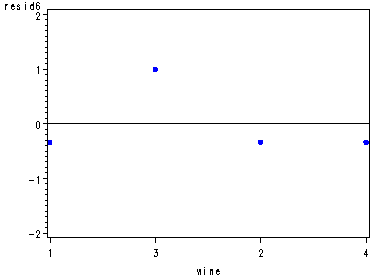
Diagnostic residual plots for the wine data set, fig. 29.3, p. 1173.
Note: In the normal probability plot proc capability shows a dot for each observation instead of writing a number for the total number of observations as in the book.
proc glm data=wine noprint;
  class wine judge;
  model rating = wine judge;
  output out=resid r=resid;
run;
quit;
symbol1 c=blue v=dot h=.8;
proc capability data=resid noprint;
  qqplot resid;
run;
data resid;
  set resid;
  if judge=1 then resid1=resid;
  if judge=2 then resid2=resid;
  if judge=3 then resid3=resid;
  if judge=4 then resid4=resid;
  if judge=5 then resid5=resid;
  if judge=6 then resid6=resid;
run;
axis1 order=(-2 to 2 by 1);
axis2 order=(3 2 1 4);
axis3 order=(1 3 2 4);
axis4 order=(3 2 4 1);
axis5 order=(2 3 1 4);
proc gplot data=resid;
  plot resid1*wine / vref=0 vaxis=axis1 haxis=axis2;
  plot resid2*wine / vref=0 vaxis=axis1 haxis=axis3;
  plot resid3*wine / vref=0 vaxis=axis1 haxis=axis4;
  plot resid4*wine / vref=0 vaxis=axis1 haxis=axis5;
  plot resid5*wine / vref=0 vaxis=axis1 haxis=axis4;
  plot resid6*wine / vref=0 vaxis=axis1 haxis=axis3;
run;
quit;
It is the lsmeans statement with a pdiff option that provides us with all possible pair-wise comparisons of the mean rating of the wines, p. 1174.
proc glm data=wine ;
  class wine judge;
  model rating = wine judge ;
  lsmeans wine / pdiff adjust=tukey cl;
run;
quit;
<output omitted>The GLM Procedure Least Squares Means Adjustment for Multiple Comparisons: Tukey
rating LSMEAN wine LSMEAN Number 1 20.0000000 1 2 22.0000000 2 3 26.6666667 3 4 26.0000000 4
Least Squares Means for effect wine Pr > |t| for H0: LSMean(i)=LSMean(j)
Dependent Variable: rating
i/j 1 2 3 4 1 0.0202 <.0001 <.0001 2 0.0202 <.0001 <.0001 3 <.0001 <.0001 0.6844 4 <.0001 <.0001 0.6844
rating wine LSMEAN 95% Confidence Limits 1 20.000000 19.101302 20.898698 2 22.000000 21.101302 22.898698 3 26.666667 25.767969 27.565365 4 26.000000 25.101302 26.898698
Least Squares Means for Effect wine
Difference Simultaneous 95% Between Confidence Limits for i j Means LSMean(i)-LSMean(j) 1 2 -2.000000 -3.718582 -0.281418 1 3 -6.666667 -8.385248 -4.948085 1 4 -6.000000 -7.718582 -4.281418 2 3 -4.666667 -6.385248 -2.948085 2 4 -4.000000 -5.718582 -2.281418 3 4 0.666667 -1.051915 2.385248
Inputting the Coffee Sweeteners data, table 29.5, p. 1175.
data sweet;
  input rank subject sweet;
cards;
  5  1  1
  1  1  2
  2  1  3
  4  1  4
  3  1  5
  4  2  1
  2  2  2
  1  2  3
  5  2  4
  3  2  5
  3  3  1
  2  3  2
  1  3  3
  4  3  4
  5  3  5
  5  4  1
  2  4  2
  3  4  3
  4  4  4
  1  4  5
  4  5  1
  1  5  2
  2  5  3
  3  5  4
  5  5  5
  4  6  1
  1  6  2
  3  6  3
  5  6  4
  2  6  5
;
run;
Calculating the mean score for each sweetener, table 29.5, p. 1175.
proc means data=sweet mean;
  class sweet;
  var rank;
run;
The MEANS ProcedureAnalysis Variable : rank
N sweet Obs Mean ———————————– 1 6 4.1666667 2 6 1.5000000 3 6 2.0000000 4 6 4.1666667 5 6 3.1666667 ———————————–
Nonparametric F-test, p. 1175. The lsmeans statement with the pdiff option provides us with all pair-wise comparisons of the means of all the sweeteners, the cl option is necessary in order to see the differences between the means, p. 1176.
proc glm data=sweet;
  class sweet subject;
  model rank = sweet subject;
  lsmeans sweet / pdiff adjust=bon alpha=.2 cl;
run;
quit;
The GLM ProcedureClass Level Information
Class Levels Values sweet 5 1 2 3 4 5 subject 6 1 2 3 4 5 6
Number of observations 30
The GLM Procedure Dependent Variable: rank Sum of Source DF Squares Mean Square F Value Pr > F Model 9 36.00000000 4.00000000 3.33 0.0119 Error 20 24.00000000 1.20000000 Corrected Total 29 60.00000000
R-Square Coeff Var Root MSE rank Mean 0.600000 36.51484 1.095445 3.000000
Source DF Type I SS Mean Square F Value Pr > F sweet 4 36.00000000 9.00000000 7.50 0.0007 subject 5 0.00000000 0.00000000 0.00 1.0000 Source DF Type III SS Mean Square F Value Pr > F sweet 4 36.00000000 9.00000000 7.50 0.0007 subject 5 0.00000000 0.00000000 0.00 1.0000
The GLM Procedure Least Squares Means Adjustment for Multiple Comparisons: Bonferroni
LSMEAN sweet rank LSMEAN Number 1 4.16666667 1 2 1.50000000 2 3 2.00000000 3 4 4.16666667 4 5 3.16666667 5
Least Squares Means for effect sweet Pr > |t| for H0: LSMean(i)=LSMean(j)
Dependent Variable: rank
i/j 1 2 3 4 5 1 0.0042 0.0268 1.0000 1.0000 2 0.0042 1.0000 0.0042 0.1587 3 0.0268 1.0000 0.0268 0.7995 4 1.0000 0.0042 0.0268 1.0000 5 1.0000 0.1587 0.7995 1.0000
sweet rank LSMEAN 80% Confidence Limits 1 4.166667 3.573956 4.759377 2 1.500000 0.907290 2.092710 3 2.000000 1.407290 2.592710 4 4.166667 3.573956 4.759377 5 3.166667 2.573956 3.759377
Least Squares Means for Effect sweet
Difference Simultaneous 80% Between Confidence Limits for i j Means LSMean(i)-LSMean(j) 1 2 2.666667 1.067834 4.265500 1 3 2.166667 0.567834 3.765500 1 4 0 -1.598833 1.598833 1 5 1.000000 -0.598833 2.598833 2 3 -0.500000 -2.098833 1.098833 2 4 -2.666667 -4.265500 -1.067834 2 5 -1.666667 -3.265500 -0.067834 3 4 -2.166667 -3.765500 -0.567834 3 5 -1.166667 -2.765500 0.432166 4 5 1.000000 -0.598833 2.598833
Inputting the Blood Flow data, table 29.7, p. 1181.
data flow;
  input score subject a b;
cards;
   2   1  1  1
  -1   2  1  1
   0   3  1  1
   3   4  1  1
   1   5  1  1
   2   6  1  1
  -2   7  1  1
   4   8  1  1
  -2   9  1  1
  -2  10  1  1
   2  11  1  1
  -1  12  1  1
  10   1  1  2
   8   2  1  2
  11   3  1  2
  15   4  1  2
   5   5  1  2
  12   6  1  2
  10   7  1  2
  16   8  1  2
   7   9  1  2
  10  10  1  2
   8  11  1  2
   8  12  1  2
   9   1  2  1
   6   2  2  1
   8   3  2  1
  11   4  2  1
   6   5  2  1
   9   6  2  1
   8   7  2  1
  12   8  2  1
   7   9  2  1
  10  10  2  1
  10  11  2  1
   6  12  2  1
  25   1  2  2
  21   2  2  2
  24   3  2  2
  31   4  2  2
  20   5  2  2
  27   6  2  2
  22   7  2  2
  30   8  2  2
  24   9  2  2
  28  10  2  2
  25  11  2  2
  23  12  2  2
;
run;
ANOVA table for blood flow data, fig. 29.5, p. 1182.
The lsmeans statement with the pdiff and adjust=bon options provides all the pair-wise differences using Bonferroni adjustment, p. 1184.
Note: The differences are the reverse of those in the book with the result that they and their confidence intervals are the additive inverses of those in the book. Furthermore, SAS by default outputs all the pair-wise differences not just those shown in the book.
proc glm data=flow;
  class a b subject;
  model score = subject a b a*b / ss3;
  lsmeans a*b /pdiff adjust=bon cl;
run;
quit;
The GLM ProcedureClass Level Information
Class Levels Values a 2 1 2 b 2 1 2
subject 12 1 2 3 4 5 6 7 8 9 10 11 12
Number of observations 48 The GLM Procedure Dependent Variable: score Sum of Source DF Squares Mean Square F Value Pr > F Model 14 4020.500000 287.178571 122.28 <.0001 Error 33 77.500000 2.348485 Corrected Total 47 4098.000000
R-Square Coeff Var Root MSE score Mean 0.981088 13.93161 1.532477 11.00000
Source DF Type III SS Mean Square F Value Pr > F subject 11 258.500000 23.500000 10.01 <.0001 a 1 1587.000000 1587.000000 675.75 <.0001 b 1 2028.000000 2028.000000 863.54 <.0001 a*b 1 147.000000 147.000000 62.59 <.0001
The GLM Procedure Least Squares Means Adjustment for Multiple Comparisons: Bonferroni
LSMEAN a b score LSMEAN Number 1 1 0.5000000 1 1 2 10.0000000 2 2 1 8.5000000 3 2 2 25.0000000 4
Least Squares Means for effect a*b Pr > |t| for H0: LSMean(i)=LSMean(j)
Dependent Variable: score
i/j 1 2 3 4 1 <.0001 <.0001 <.0001 2 <.0001 0.1339 <.0001 3 <.0001 0.1339 <.0001 4 <.0001 <.0001 <.0001
a b score LSMEAN 95% Confidence Limits 1 1 0.500000 -0.400045 1.400045 1 2 10.000000 9.099955 10.900045 2 1 8.500000 7.599955 9.400045 2 2 25.000000 24.099955 25.900045
Least Squares Means for Effect a*b
Difference Simultaneous 95% Between Confidence Limits for i j Means LSMean(i)-LSMean(j) 1 2 -9.500000 -11.255997 -7.744003 1 3 -8.000000 -9.755997 -6.244003 1 4 -24.500000 -26.255997 -22.744003 2 3 1.500000 -0.255997 3.255997 2 4 -15.000000 -16.755997 -13.244003 3 4 -16.500000 -18.255997 -14.744003
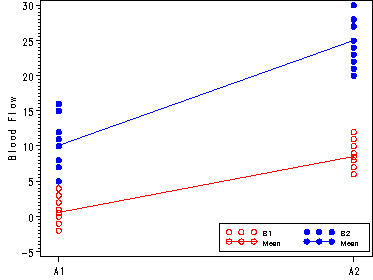
Fig. 29.6, p. 1183.
data flow;
  set flow;
  if a=1 and b=1 then c=1;
  if a=1 and b=2 then c=2;
  if a=2 and b=1 then c=3;
  if a=2 and b=2 then c=4;
proc sql;
  create table temp as
  select*, mean(score) as mean
  from flow
  group by c;
quit;
data plot;
  set temp;
  if b=1 then do;
    b1=score;
    mean1=mean;
    end;
  if b=2 then do;
    b2=score;
	mean2=mean;
	end;
run;
goptions reset=all;

symbol1 c=red v=circle;
symbol2 c=blue v=dot;
symbol3 c=red i=join v=circle;
symbol4 c=blue i=join v=dot;
axis1 label=(a=90 'Blood Flow') order=(-5 to 30 by 5);
axis2 value=('A1' 'A2') order=(1 2) offset=(3, 3) label=('');
legend1 label=none value=(height=.8 font=swiss 'B1' 'B2' 'Mean' 'Mean' )
        position=(bottom right inside) mode=share cborder=black across=2;
proc gplot data=plot;
 plot (b1 b2 mean1 mean2)*a/ overlay vaxis=axis1 haxis=axis2 legend=legend1;
run;
quit;
Inputting the Athletic Shoes Sales data, table 29.10, p. 1190.
data shoes;
  input sales subject a b;
  label subject = 'Test Market'
              a = 'Campaign'
	      b = 'Time';
cards;
    958  1  1  1
   1005  2  1  1
    351  3  1  1
    549  4  1  1
    730  5  1  1
   1047  1  1  2
   1122  2  1  2
    436  3  1  2
    632  4  1  2
    784  5  1  2
    933  1  1  3
    986  2  1  3
    339  3  1  3
    512  4  1  3
    707  5  1  3
    780  1  2  1
    229  2  2  1
    883  3  2  1
    624  4  2  1
    375  5  2  1
    897  1  2  2
    275  2  2  2
    964  3  2  2
    695  4  2  2
    436  5  2  2
    718  1  2  3
    202  2  2  3
    817  3  2  3
    599  4  2  3
    351  5  2  3
;
run;
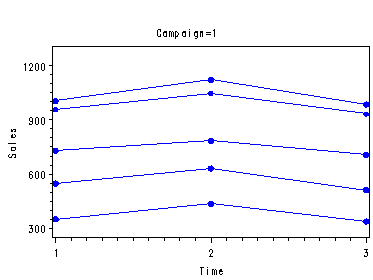
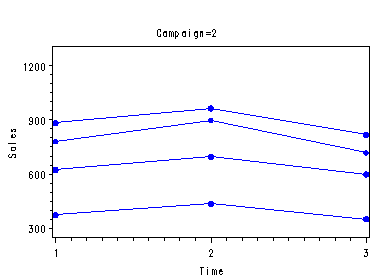
Fig. 29.8, p. 1191.
data plot;
  set shoes;
  if subject=1 then s1=sales;
  if subject=2 then s2=sales;
  if subject=3 then s3=sales;
  if subject=4 then s4=sales;
  if subject=5 then s5=sales;
run;
symbol1 c=blue v=dot i=join;
symbol2 c=blue v=dot i=join;
symbol3 c=blue v=dot i=join;
symbol4 c=blue v=dot i=join;
symbol5 c=blue v=dot i=join;
axis1 label=(a=90 'Sales') offset=(1, 2) order=(300 to 1200 by 300);
proc gplot data=plot;
  by a;
  plot (s1 s2 s3 s4 s5)*b / overlay vaxis=axis1;
run;
quit;
Fig. 29.9, p. 1192 which includes the test of the interaction, p. 1191 and the test of the main effect of time periods (factor b). The test statement supplies the test of the main effects of campaign (factor a) where we have to specify that the denominator is the sums of squares of subject nested within campaign (factor a). The first lsmeans statement provides the means of sales for each level of factor a, table 29.9. The second lsmeans with the pdiff and adjust=Tukey options provides not only the means of sales for each level of b but also all the pair-wise differences and their confidence intervals using the Tukey procedure with alpha=.01, p. 1193.
proc glm data=shoes;
  class a b subject;
  model sales = a subject(a) b a*b;
  lsmeans a;
  lsmeans b / pdiff cl adjust=tukey alpha=.01;
  test h=a e=subject(a);
run;
quit;
The GLM ProcedureClass Level Information
Class Levels Values a 2 1 2 b 3 1 2 3 subject 5 1 2 3 4 5
Number of observations 30 The GLM Procedure Dependent Variable: sales
Sum of Source DF Squares Mean Square F Value Pr > F Model 13 2069296.000 159176.615 444.67 <.0001 Error 16 5727.467 357.967 Corrected Total 29 2075023.467
R-Square Coeff Var Root MSE sales Mean 0.997240 2.847112 18.92001 664.5333
Source DF Type I SS Mean Square F Value Pr > F a 1 168150.533 168150.533 469.74 <.0001 subject(a) 8 1833680.933 229210.117 640.31 <.0001 b 2 67073.067 33536.533 93.69 <.0001 a*b 2 391.467 195.733 0.55 0.5892
Source DF Type III SS Mean Square F Value Pr > F a 1 168150.533 168150.533 469.74 <.0001 subject(a) 8 1833680.933 229210.117 640.31 <.0001 b 2 67073.067 33536.533 93.69 <.0001 a*b 2 391.467 195.733 0.55 0.5892
The GLM Procedure Least Squares Means
a sales LSMEAN 1 739.400000 2 589.666667
The GLM Procedure Least Squares Means Adjustment for Multiple Comparisons: Tukey
LSMEAN b sales LSMEAN Number 1 648.400000 1 2 728.800000 2 3 616.400000 3
Least Squares Means for effect b Pr > |t| for H0: LSMean(i)=LSMean(j)
Dependent Variable: sales
i/j 1 2 3 1 <.0001 0.0044 2 <.0001 <.0001 3 0.0044 <.0001
b sales LSMEAN 99% Confidence Limits 1 648.400000 630.924871 665.875129 2 728.800000 711.324871 746.275129 3 616.400000 598.924871 633.875129
Least Squares Means for Effect b
Difference Simultaneous 99% Between Confidence Limits for i j Means LSMean(i)-LSMean(j) 1 2 -80.400000 -109.031863 -51.768137 1 3 32.000000 3.368137 60.631863 2 3 112.400000 83.768137 141.031863
The GLM Procedure
Dependent Variable: sales
Tests of Hypotheses Using the Type III MS for subject(a) as an Error Term
Source DF Type III SS Mean Square F Value Pr > F a 1 168150.5333 168150.5333 0.73 0.4166

