Table 7.1, p. 261.
data ch7tab01;
  input X1 X2 X3 Y;
  label x1 = 'Triceps'
        x2 = 'Thigh cir.'
	x3 = 'Midarm cir.'
         y = 'body fat';
  cards;
  19.5  43.1  29.1  11.9
  24.7  49.8  28.2  22.8
  30.7  51.9  37.0  18.7
  29.8  54.3  31.1  20.1
  19.1  42.2  30.9  12.9
  25.6  53.9  23.7  21.7
  31.4  58.5  27.6  27.1
  27.9  52.1  30.6  25.4
  22.1  49.9  23.2  21.3
  25.5  53.5  24.8  19.3
  31.1  56.6  30.0  25.4
  30.4  56.7  28.3  27.2
  18.7  46.5  23.0  11.7
  19.7  44.2  28.6  17.8
  14.6  42.7  21.3  12.8
  29.5  54.4  30.1  23.9
  27.7  55.3  25.7  22.6
  30.2  58.6  24.6  25.4
  22.7  48.2  27.1  14.8
  25.2  51.0  27.5  21.1
;
run;
Table 7.2, p. 262-263.
proc reg data = ch7tab01;
  model y = x1;
  model y = x2;
  model y = x1 x2;
  model y = x1-x3;
run;
quit;
The REG Procedure Model: MODEL1 Dependent Variable: Y body fatAnalysis of Variance
Sum of Mean Source DF Squares Square F Value Pr > F
Model 1 352.26980 352.26980 44.30 <.0001 Error 18 143.11970 7.95109 Corrected Total 19 495.38950
Root MSE 2.81977 R-Square 0.7111 Dependent Mean 20.19500 Adj R-Sq 0.6950 Coeff Var 13.96271
Parameter Estimates
Parameter Standard Variable Label DF Estimate Error t Value Pr > |t|
Intercept Intercept 1 -1.49610 3.31923 -0.45 0.6576 X1 Triceps 1 0.85719 0.12878 6.66 <.0001
The REG Procedure Model: MODEL2 Dependent Variable: Y body fat
Analysis of Variance
Sum of Mean Source DF Squares Square F Value Pr > F
Model 1 381.96582 381.96582 60.62 <.0001 Error 18 113.42368 6.30132 Corrected Total 19 495.38950
Root MSE 2.51024 R-Square 0.7710 Dependent Mean 20.19500 Adj R-Sq 0.7583 Coeff Var 12.43002
Parameter Estimates
Parameter Standard Variable Label DF Estimate Error t Value Pr > |t|
Intercept Intercept 1 -23.63449 5.65741 -4.18 0.0006 X2 Thigh cir. 1 0.85655 0.11002 7.79 <.0001
The REG Procedure Model: MODEL3 Dependent Variable: Y body fat
Analysis of Variance
Sum of Mean Source DF Squares Square F Value Pr > F
Model 2 385.43871 192.71935 29.80 <.0001 Error 17 109.95079 6.46769 Corrected Total 19 495.38950
Root MSE 2.54317 R-Square 0.7781 Dependent Mean 20.19500 Adj R-Sq 0.7519 Coeff Var 12.59305
Parameter Estimates
Parameter Standard Variable Label DF Estimate Error t Value Pr > |t|
Intercept Intercept 1 -19.17425 8.36064 -2.29 0.0348 X1 Triceps 1 0.22235 0.30344 0.73 0.4737 X2 Thigh cir. 1 0.65942 0.29119 2.26 0.0369
The REG Procedure Model: MODEL4 Dependent Variable: Y body fat
Analysis of Variance
Sum of Mean Source DF Squares Square F Value Pr > F
Model 3 396.98461 132.32820 21.52 <.0001 Error 16 98.40489 6.15031 Corrected Total 19 495.38950
Root MSE 2.47998 R-Square 0.8014 Dependent Mean 20.19500 Adj R-Sq 0.7641 Coeff Var 12.28017
Parameter Estimates
Parameter Standard Variable Label DF Estimate Error t Value Pr > |t|
Intercept Intercept 1 117.08469 99.78240 1.17 0.2578 X1 Triceps 1 4.33409 3.01551 1.44 0.1699 X2 Thigh cir. 1 -2.85685 2.58202 -1.11 0.2849 X3 Midarm cir. 1 -2.18606 1.59550 -1.37 0.1896
Table 7.4, p. 267.
Test1 is for the example of testing one variable, p. 269.
Test2 is for the example of testing two variables at once, p. 270-271.
proc reg data = ch7tab01;
  model y = x1-x3/ss1;
  test1: test x3 = 0;
  test2: test x2=x3=0;
run;
quit;
The REG Procedure Model: MODEL1 Dependent Variable: Y body fatAnalysis of Variance
Sum of Mean Source DF Squares Square F Value Pr > F
Model 3 396.98461 132.32820 21.52 <.0001 Error 16 98.40489 6.15031 Corrected Total 19 495.38950
Root MSE 2.47998 R-Square 0.8014 Dependent Mean 20.19500 Adj R-Sq 0.7641 Coeff Var 12.28017
Parameter Estimates
Parameter Standard Variable Label DF Estimate Error t Value Pr > |t| Type I SS
Intercept Intercept 1 117.08469 99.78240 1.17 0.2578 8156.76050 X1 Triceps 1 4.33409 3.01551 1.44 0.1699 352.26980 X2 Thigh cir. 1 -2.85685 2.58202 -1.11 0.2849 33.16891 X3 Midarm cir. 1 -2.18606 1.59550 -1.37 0.1896 11.54590
The REG Procedure Model: MODEL1
Test test1 Results for Dependent Variable Y
Mean Source DF Square F Value Pr > F
Numerator 1 11.54590 1.88 0.1896 Denominator 16 6.15031
The REG Procedure Model: MODEL1
Test test2 Results for Dependent Variable Y
Mean Source DF Square F Value Pr > F
Numerator 2 22.35741 3.64 0.0500 Denominator 16 6.15031
Coefficients of partial determination, p. 275.
ry1.2 and ry2.1 are from the first model.
ry3.12 is the coef. from X3 in the second model.
proc reg data = ch7tab01;
  model y = x1 x2 / pcorr2;
  model y = x1-x3 / pcorr2;
run;
quit;
The REG Procedure Model: MODEL1 Dependent Variable: Y body fatAnalysis of Variance
Sum of Mean Source DF Squares Square F Value Pr > F
Model 2 385.43871 192.71935 29.80 <.0001 Error 17 109.95079 6.46769 Corrected Total 19 495.38950
Root MSE 2.54317 R-Square 0.7781 Dependent Mean 20.19500 Adj R-Sq 0.7519 Coeff Var 12.59305
Parameter Estimates
Squared Parameter Standard Partial Variable Label DF Estimate Error t Value Pr > |t| Corr Type II
Intercept Intercept 1 -19.17425 8.36064 -2.29 0.0348 . X1 Triceps 1 0.22235 0.30344 0.73 0.4737 0.03062 X2 Thigh cir. 1 0.65942 0.29119 2.26 0.0369 0.23176
The REG Procedure Model: MODEL2 Dependent Variable: Y body fat
Analysis of Variance
Sum of Mean Source DF Squares Square F Value Pr > F
Model 3 396.98461 132.32820 21.52 <.0001 Error 16 98.40489 6.15031 Corrected Total 19 495.38950
Root MSE 2.47998 R-Square 0.8014 Dependent Mean 20.19500 Adj R-Sq 0.7641 Coeff Var 12.28017
Parameter Estimates
Squared Parameter Standard Partial Variable Label DF Estimate Error t Value Pr > |t| Corr Type II
Intercept Intercept 1 117.08469 99.78240 1.17 0.2578 . X1 Triceps 1 4.33409 3.01551 1.44 0.1699 0.11435 X2 Thigh cir. 1 -2.85685 2.58202 -1.11 0.2849 0.07108 X3 Midarm cir. 1 -2.18606 1.59550 -1.37 0.1896 0.10501
Inputting the Dwaine Studio Data from Ch. 6, Table 5 (p. 241).
data ch6fig05;
  input x1 x2 y;
  label y  = 'sales'
        x1 = 'targtpop'
        x2 = 'dispoinc';
cards;
  68.5  16.7  174.4
  45.2  16.8  164.4
  91.3  18.2  244.2
  47.8  16.3  154.6
  46.9  17.3  181.6
  66.1  18.2  207.5
  49.5  15.9  152.8
  52.0  17.2  163.2
  48.9  16.6  145.4
  38.4  16.0  137.2
  87.9  18.3  241.9
  72.8  17.1  191.1
  88.4  17.4  232.0
  42.9  15.8  145.3
  52.5  17.8  161.1
  85.7  18.4  209.7
  41.3  16.5  146.4
  51.7  16.3  144.0
  89.6  18.1  232.6
  82.7  19.1  224.1
  52.3  16.0  166.5
  ;
run;
Creating the standardized variables of the Dwaine Studios Data, p. 282.
proc sql;
  create table temp as
  select *, ( y - mean(y) )/( std(y)*( sqrt( count(y)-1 ) ) ) as yprime,
            ( x1 - mean(x1) )/( std(x1)*( sqrt( count(x1)-1 ) ) ) as x1prime,
            ( x2 - mean(x2) )/( std(x2)*( sqrt( count(x2)-1 ) ) ) as x2prime
  from ch6fig05;
quit;
Table 7.5a, p. 283.
proc print data = temp (obs= 10);
  var y x1 x2;
run;
proc means data = temp mean std ;
  var y x1 x2;
run;
Obs y x1 x21 174.4 68.5 16.7 2 164.4 45.2 16.8 3 244.2 91.3 18.2 4 154.6 47.8 16.3 5 181.6 46.9 17.3 6 207.5 66.1 18.2 7 152.8 49.5 15.9 8 163.2 52.0 17.2 9 145.4 48.9 16.6 10 137.2 38.4 16.0
The MEANS Procedure
Variable Label Mean Std Dev —————————————————- y sales 181.9047619 36.1913039 x1 targtpop 62.0190476 18.6203281 x2 dispoinc 17.1428571 0.9703460 —————————————————-
Table 7.5b, p. 283.
proc print data = temp;
  var yprime x1prime x2prime;
run;
Obs yprime x1prime x2prime1 -0.04637 0.07783 -0.10205 2 -0.10815 -0.20198 -0.07901 3 0.38489 0.35163 0.24361 4 -0.16870 -0.17075 -0.19423 5 -0.00188 -0.18156 0.03621 6 0.15814 0.04901 0.24361 7 -0.17982 -0.15034 -0.28640 8 -0.11557 -0.12032 0.01317 9 -0.22554 -0.15754 -0.12510 10 -0.27621 -0.28364 -0.26336 11 0.37068 0.31080 0.26665 12 0.05681 0.12947 -0.00988 13 0.30951 0.31680 0.05926 14 -0.22616 -0.22960 -0.30945 15 -0.12854 -0.11431 0.15143 16 0.17173 0.28438 0.28970 17 -0.21937 -0.24881 -0.14814 18 -0.23419 -0.12392 -0.19423 19 0.31322 0.33121 0.22056 20 0.26070 0.24835 0.45100 21 -0.09518 -0.11671 -0.26336
Table 7.5c, p. 283.
proc reg data = temp;
  model yprime = x1prime x2prime;
run;
quit;
The REG Procedure Model: MODEL1 Dependent Variable: yprimeAnalysis of Variance
Sum of Mean Source DF Squares Square F Value Pr > F
Model 2 0.91675 0.45837 99.10 <.0001 Error 18 0.08325 0.00463 Corrected Total 20 1.00000
Root MSE 0.06801 R-Square 0.9167 Dependent Mean 3.23815E-17 Adj R-Sq 0.9075 Coeff Var 2.100236E17
Parameter Estimates
Parameter Standard Variable DF Estimate Error t Value Pr > |t|
Intercept 1 -8.9542E-18 0.01484 -0.00 1.0000 x1prime 1 0.74837 0.10896 6.87 <.0001 x2prime 1 0.25110 0.10896 2.30 0.0333
Inputting the data of the Work Crew data.
data ch7tab06;
  input x1 x2 y;
  label x1 = 'Crew size'
        x2 = 'Bonus Pay'
         y = 'Crew productivity';
cards;
  4  2  42
  4  2  39
  4  3  48
  4  3  51
  6  2  49
  6  2  53
  6  3  61
  6  3  60
;
run;
Table 7.6, p. 286.
proc print data = ch7tab06;
run;
Obs x1 x2 y1 4 2 42 2 4 2 39 3 4 3 48 4 4 3 51 5 6 2 49 6 6 2 53 7 6 3 61 8 6 3 60
Table 7.7, p. 287.
proc reg data = ch7tab06;
  model y = x1 x2;
  model y = x1;
  model y = x2;
run;
The REG Procedure Model: MODEL1 Dependent Variable: y Crew productivityAnalysis of Variance
Sum of Mean Source DF Squares Square F Value Pr > F
Model 2 402.25000 201.12500 57.06 0.0004 Error 5 17.62500 3.52500 Corrected Total 7 419.87500
Root MSE 1.87750 R-Square 0.9580 Dependent Mean 50.37500 Adj R-Sq 0.9412 Coeff Var 3.72704
Parameter Estimates
Parameter Standard Variable Label DF Estimate Error t Value Pr > |t|
Intercept Intercept 1 0.37500 4.74045 0.08 0.9400 x1 Crew size 1 5.37500 0.66380 8.10 0.0005 x2 Bonus Pay 1 9.25000 1.32759 6.97 0.0009
The REG Procedure Model: MODEL2 Dependent Variable: y Crew productivity
Analysis of Variance
Sum of Mean Source DF Squares Square F Value Pr > F
Model 1 231.12500 231.12500 7.35 0.0351 Error 6 188.75000 31.45833 Corrected Total 7 419.87500
Root MSE 5.60877 R-Square 0.5505 Dependent Mean 50.37500 Adj R-Sq 0.4755 Coeff Var 11.13404
Parameter Estimates
Parameter Standard Variable Label DF Estimate Error t Value Pr > |t|
Intercept Intercept 1 23.50000 10.11136 2.32 0.0591 x1 Crew size 1 5.37500 1.98300 2.71 0.0351
The REG Procedure Model: MODEL3 Dependent Variable: y Crew productivity
Analysis of Variance
Sum of Mean Source DF Squares Square F Value Pr > F
Model 1 171.12500 171.12500 4.13 0.0885 Error 6 248.75000 41.45833 Corrected Total 7 419.87500
Root MSE 6.43881 R-Square 0.4076 Dependent Mean 50.37500 Adj R-Sq 0.3088 Coeff Var 12.78177
Parameter Estimates
Parameter Standard Variable Label DF Estimate Error t Value Pr > |t|
Intercept Intercept 1 27.25000 11.60774 2.35 0.0572 x2 Bonus Pay 1 9.25000 4.55293 2.03 0.0885
Fig. 7.3, p. 290. The scatter macro can be used for making a scatterplot matrix.
%scatter(data = Ch7tab01, var = x1 x2 x3);
Showing correlations of x1 to x3.
proc corr data = ch7tab01;
  var x1-x3;
run;
The CORR Procedure3 Variables: X1 X2 X3
Simple Statistics
Variable N Mean Std Dev Sum Minimum Maximum Label
X1 20 25.30500 5.02326 506.10000 14.60000 31.40000 Triceps X2 20 51.17000 5.23461 1023 42.20000 58.60000 Thigh cir. X3 20 27.62000 3.64715 552.40000 21.30000 37.00000 Midarm cir.
Pearson Correlation Coefficients, N = 20 Prob > |r| under H0: Rho=0
X1 X2 X3
X1 1.00000 0.92384 0.45778 Triceps <.0001 0.0424
X2 0.92384 1.00000 0.08467 Thigh cir. <.0001 0.7227
X3 0.45778 0.08467 1.00000 Midarm cir. 0.0424 0.7227
Inputting data in table 7.9, p. 302.
data ch7tab09;
  input y x1 x2;
  label  y = 'cycles'
        x1 = 'Charge rate'
	x2 = 'Temperature';
cards;
  150  0.6  10
   86  1.0  10
   49  1.4  10
  288  0.6  20
  157  1.0  20
  131  1.0  20
  184  1.0  20
  109  1.4  20
  279  0.6  30
  235  1.0  30
  224  1.4  30
;
run;
* Recoding the variables. ;
proc sql;
  create table temp as
  select *, (x1-mean(x1))/.4 as lx1, (x2-mean(x2))/10 as lx2,
            ((x1-mean(x1))/.4)*((x1-mean(x1))/.4) as lx1sq,
            ((x2-mean(x2))/10)*((x2-mean(x2))/10) as lx2sq,
            ((x1-mean(x1))/.4)*((x2-mean(x2))/10) as lx1x2,
            x1*x1 as x1sq, x2*x2 as x2sq
  from ch7tab09;
quit;
Correlations at the bottom of p. 302.
proc corr data = temp;
  var x1 x1sq x2 x2sq lx1 lx1sq lx2 lx2sq;
run;
The CORR Procedure8 Variables: x1 x1sq x2 x2sq lx1 lx1sq lx2 lx2sq
Simple Statistics
Variable N Mean Std Dev Sum Minimum Maximum Label
x1 11 1.00000 0.30984 11.00000 0.60000 1.40000 Charge rate x1sq 11 1.08727 0.62529 11.96000 0.36000 1.96000 x2 11 20.00000 7.74597 220.00000 10.00000 30.00000 Temperature x2sq 11 454.54545 314.20896 5000 100.00000 900.00000 lx1 11 0 0.77460 0 -1.00000 1.00000 lx1sq 11 0.54545 0.52223 6.00000 0 1.00000 lx2 11 0 0.77460 0 -1.00000 1.00000 lx2sq 11 0.54545 0.52223 6.00000 0 1.00000
Pearson Correlation Coefficients, N = 11 Prob > |r| under H0: Rho=0
x1 x1sq x2 x2sq lx1 lx1sq lx2 lx2sq
x1 1.00000 0.99103 0.00000 0.00000 1.00000 0.00000 0.00000 0.00000 Charge rate <.0001 1.0000 1.0000 <.0001 1.0000 1.0000 1.0000
x1sq 0.99103 1.00000 0.00000 0.00592 0.99103 0.13363 0.00000 0.03563 <.0001 1.0000 0.9862 <.0001 0.6953 1.0000 0.9172
x2 0.00000 0.00000 1.00000 0.98609 0.00000 0.00000 1.00000 0.00000 Temperature 1.0000 1.0000 <.0001 1.0000 1.0000 <.0001 1.0000
x2sq 0.00000 0.00592 0.98609 1.00000 0.00000 0.04432 0.98609 0.16621 1.0000 0.9862 <.0001 1.0000 0.8970 <.0001 0.6253
lx1 1.00000 0.99103 0.00000 0.00000 1.00000 0.00000 0.00000 0.00000 <.0001 <.0001 1.0000 1.0000 1.0000 1.0000 1.0000
lx1sq 0.00000 0.13363 0.00000 0.04432 0.00000 1.00000 0.00000 0.26667 1.0000 0.6953 1.0000 0.8970 1.0000 1.0000 0.4280
lx2 0.00000 0.00000 1.00000 0.98609 0.00000 0.00000 1.00000 0.00000 1.0000 1.0000 <.0001 <.0001 1.0000 1.0000 1.0000
lx2sq 0.00000 0.03563 0.00000 0.16621 0.00000 0.26667 0.00000 1.00000 1.0000 0.9172 1.0000 0.6253 1.0000 0.4280 1.0000
Table 7.9, p. 303.
proc print data = temp;
run;
proc means data = temp mean;
  var x1 x2;
run;
Obs y x1 x2 lx1 lx2 lx1sq lx2sq lx1x2 x1sq x2sq1 150 0.6 10 -1 -1 1 1 1 0.36 100 2 86 1.0 10 0 -1 0 1 -0 1.00 100 3 49 1.4 10 1 -1 1 1 -1 1.96 100 4 288 0.6 20 -1 0 1 0 0 0.36 400 5 157 1.0 20 0 0 0 0 0 1.00 400 6 131 1.0 20 0 0 0 0 0 1.00 400 7 184 1.0 20 0 0 0 0 0 1.00 400 8 109 1.4 20 1 0 1 0 0 1.96 400 9 279 0.6 30 -1 1 1 1 -1 0.36 900 10 235 1.0 30 0 1 0 1 0 1.00 900 11 224 1.4 30 1 1 1 1 1 1.96 900
The MEANS Procedure
Variable Label Mean ————————————— x1 Charge rate 1.0000000 x2 Temperature 20.0000000 —————————————
Table 7.7, p. 304.
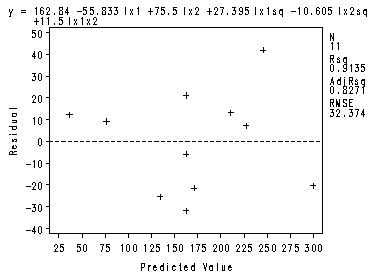
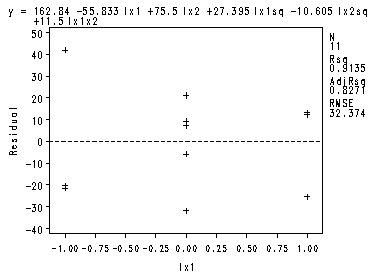
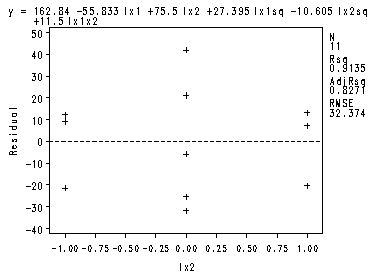
Fig. 7.8a-7.8c, p. 304.
Test1 is the Partial F-test on p. 306.
proc reg data = temp;
  model y = lx1 lx2 lx1sq lx2sq lx1x2/ss1;
  plot r.*p. r.*lx1 r.*lx2;
  output out=tempout p=fitted r=residual;
  test lx1sq=lx2sq=lx1x2=0;
run;
quit;
The REG Procedure Model: MODEL1 Dependent Variable: y cyclesAnalysis of Variance
Sum of Mean Source DF Squares Square F Value Pr > F
Model 5 55366 11073 10.57 0.0109 Error 5 5240.43860 1048.08772 Corrected Total 10 60606
Root MSE 32.37418 R-Square 0.9135 Dependent Mean 172.00000 Adj R-Sq 0.8271 Coeff Var 18.82220
Parameter Estimates
Parameter Standard Variable Label DF Estimate Error t Value Pr > |t| Type I SS
Intercept Intercept 1 162.84211 16.60761 9.81 0.0002 325424 lx1 1 -55.83333 13.21670 -4.22 0.0083 18704 lx2 1 75.50000 13.21670 5.71 0.0023 34202 lx1sq 1 27.39474 20.34008 1.35 0.2359 1645.96667 lx2sq 1 -10.60526 20.34008 -0.52 0.6244 284.92807 lx1x2 1 11.50000 16.18709 0.71 0.5092 529.00000
The REG Procedure
Test 1 Results for Dependent Variable y
Mean Source DF Square F Value Pr > F
Numerator 3 819.96491 0.78 0.5527 Denominator 5 1048.08772
Fig. 7.8a, p. 304.
Fig. 7.8b, p. 304.
Fig. 7.8c, p. 304.
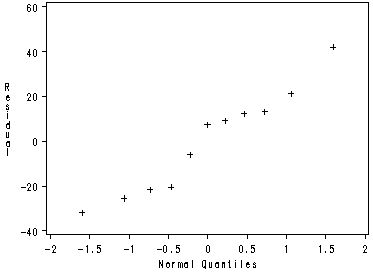
Fig. 7.8d, p. 304.
proc univariate data = tempout noprint;
  qqplot residual/ normal;
run;
First Order Models using transformed and not transformed variables, p. 306. The CLB option provides the confidence limits for the parameters on p. 307.
proc reg data = temp;
  model y = lx1 lx2;
  model y = x1 x2/ clb;
  output out=tempout p=fitted;
run;
quit;
The REG Procedure Model: MODEL1 Dependent Variable: y cyclesAnalysis of Variance
Sum of Mean Source DF Squares Square F Value Pr > F
Model 2 52906 26453 27.48 0.0003 Error 8 7700.33333 962.54167 Corrected Total 10 60606
Root MSE 31.02486 R-Square 0.8729 Dependent Mean 172.00000 Adj R-Sq 0.8412 Coeff Var 18.03771
Parameter Estimates
Parameter Standard Variable Label DF Estimate Error t Value Pr > |t|
Intercept Intercept 1 172.00000 9.35435 18.39 <.0001 lx1 1 -55.83333 12.66584 -4.41 0.0023 lx2 1 75.50000 12.66584 5.96 0.0003
The REG Procedure Model: MODEL2 Dependent Variable: y cycles
Analysis of Variance
Sum of Mean Source DF Squares Square F Value Pr > F
Model 2 52906 26453 27.48 0.0003 Error 8 7700.33333 962.54167 Corrected Total 10 60606
Root MSE 31.02486 R-Square 0.8729 Dependent Mean 172.00000 Adj R-Sq 0.8412 Coeff Var 18.03771
Parameter Estimates
Parameter Standard Variable Label DF Estimate Error t Value Pr > |t|
Intercept Intercept 1 160.58333 41.61545 3.86 0.0048 x1 Charge rate 1 -139.58333 31.66461 -4.41 0.0023 x2 Temperature 1 7.55000 1.26658 5.96 0.0003
Parameter Estimates
Variable Label DF 95% Confidence Limits
Intercept Intercept 1 64.61793 256.54874 x1 Charge rate 1 -212.60206 -66.56461 x2 Temperature 1 4.62925 10.47075
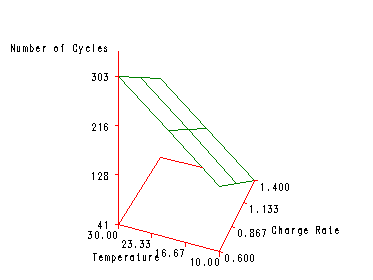
Fig. 7.9, p. 307.
We are using the fitted values from the last model in the previous proc reg.
proc g3d data = tempout;
  plot  x2*x1 =  fitted  ;
  label fitted = 'Number of Cycles'
            x1 = 'Charge Rate'
            x2 = 'Temperature';
run;
We cannot find the data files for section 7.8, pages 308-313. The 3d graphs can be made using 3D Graphs using SAS and SAS Teaching Tools- Graphs for Visualizing Interactions of Continuous Variables in Multiple Regression.
Creating centered variables for the Body Fat dataset from table 7.1, p. 261.
proc sql;
  create table temp as
  select *,  y - mean(y) as cy, x1 - mean(x1) as cx1,
			 x2 - mean(x2) as cx2,  x3 - mean(x3) as cx3
  from ch7tab01;
quit;
data temp;
  set temp;
  cx1x2 = cx1*cx2;
  cx1x3 = cx1*cx3;
  cx2x3 = cx2*cx3;
run;
Fitting the Regression model (7.93), p. 315. The SS1 option lets you obtain the extra sums of squares. Test1 is the test of the interaction terms.
proc reg data = temp;
  model y = cx1 cx2 cx3 cx1x2 cx1x3 cx2x3/ss1;
  test1: test cx1x2 = cx1x3 = cx2x3 = 0;
run;
quit;
The REG Procedure Model: MODEL1 Dependent Variable: Y body fatAnalysis of Variance
Sum of Mean Source DF Squares Square F Value Pr > F
Model 6 407.69950 67.94992 10.07 0.0003 Error 13 87.69000 6.74538 Corrected Total 19 495.38950
Root MSE 2.59719 R-Square 0.8230 Dependent Mean 20.19500 Adj R-Sq 0.7413 Coeff Var 12.86055
Parameter Estimates
Parameter Standard Variable Label DF Estimate Error t Value Pr > |t| Type I SS
Intercept Intercept 1 20.52689 1.07363 19.12 <.0001 8156.76050 cx1 1 3.43781 3.57867 0.96 0.3543 352.26980 cx2 1 -2.09472 3.03677 -0.69 0.5025 33.16891 cx3 1 -1.61634 1.90721 -0.85 0.4121 11.54590 cx1x2 1 0.00888 0.03085 0.29 0.7781 1.49572 cx1x3 1 -0.08479 0.07342 -1.15 0.2689 2.70433 cx2x3 1 0.09042 0.09200 0.98 0.3437 6.51484
The REG Procedure Model: MODEL1
Test test1 Results for Dependent Variable Y
Mean Source DF Square F Value Pr > F
Numerator 3 3.57163 0.53 0.6699 Denominator 13 6.74538

