Inputting Surgical Unit data Table 8.1, p. 335.
data ch8tab01;
  input x1 x2 x3 x4 y;
  label x1 = 'blood-clotting'
        x2 = 'prognostic'
		x3 = 'enzyme'
		x4 = 'liver function'
		 y = 'survival';
cards;
   6.7  62   81  2.59  200  2.3010
   5.1  59   66  1.70  101  2.0043
   7.4  57   83  2.16  204  2.3096
   6.5  73   41  2.01  101  2.0043
   7.8  65  115  4.30  509  2.7067
   5.8  38   72  1.42   80  1.9031
   5.7  46   63  1.91   80  1.9031
   3.7  68   81  2.57  127  2.1038
   6.0  67   93  2.50  202  2.3054
   3.7  76   94  2.40  203  2.3075
   6.3  84   83  4.13  329  2.5172
   6.7  51   43  1.86   65  1.8129
   5.8  96  114  3.95  830  2.9191
   5.8  83   88  3.95  330  2.5185
   7.7  62   67  3.40  168  2.2253
   7.4  74   68  2.40  217  2.3365
   6.0  85   28  2.98   87  1.9395
   3.7  51   41  1.55   34  1.5315
   7.3  68   74  3.56  215  2.3324
   5.6  57   87  3.02  172  2.2355
   5.2  52   76  2.85  109  2.0374
   3.4  83   53  1.12  136  2.1335
   6.7  26   68  2.10   70  1.8451
   5.8  67   86  3.40  220  2.3424
   6.3  59  100  2.95  276  2.4409
   5.8  61   73  3.50  144  2.1584
   5.2  52   86  2.45  181  2.2577
  11.2  76   90  5.59  574  2.7589
   5.2  54   56  2.71   72  1.8573
   5.8  76   59  2.58  178  2.2504
   3.2  64   65  0.74   71  1.8513
   8.7  45   23  2.52   58  1.7634
   5.0  59   73  3.50  116  2.0645
   5.8  72   93  3.30  295  2.4698
   5.4  58   70  2.64  115  2.0607
   5.3  51   99  2.60  184  2.2648
   2.6  74   86  2.05  118  2.0719
   4.3   8  119  2.85  120  2.0792
   4.8  61   76  2.45  151  2.1790
   5.4  52   88  1.81  148  2.1703
   5.2  49   72  1.84   95  1.9777
   3.6  28   99  1.30   75  1.8751
   8.8  86   88  6.40  483  2.6840
   6.5  56   77  2.85  153  2.1847
   3.4  77   93  1.48  191  2.2810
   6.5  40   84  3.00  123  2.0899
   4.5  73  106  3.05  311  2.4928
   4.8  86  101  4.10  398  2.5999
   5.1  67   77  2.86  158  2.1987
   3.9  82  103  4.55  310  2.4914
   6.6  77   46  1.95  124  2.0934
   6.4  85   40  1.21  125  2.0969
   6.4  59   85  2.33  198  2.2967
   8.8  78   72  3.20  313  2.4955
;
run;
Creating the log transformed response variable and the interaction of x2 and x3.
data ch8tab01;
  set ch8tab01;
  logy = log10(y);
  x2x3 = x2*x3;
run;
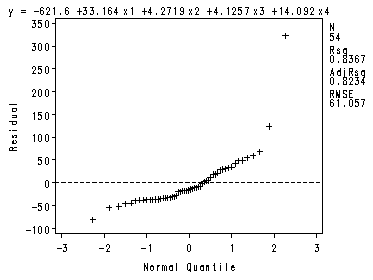
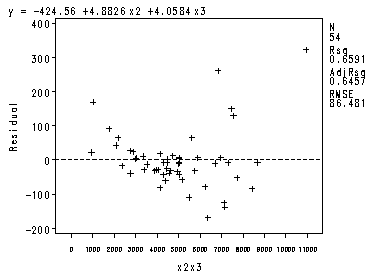
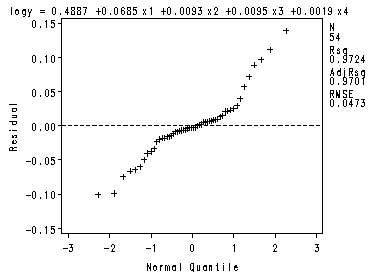
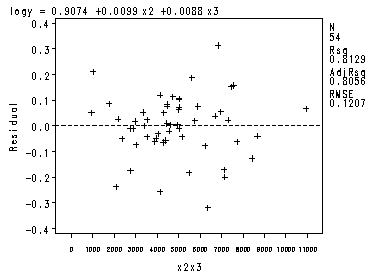
The four preliminary residual plots, p. 336.
Fig. 8.2a-8.2b.
Note: The labels on the X-axis are not the same as in the book.
proc reg data = ch8tab01 noprint;
  var x2x3;
  model y = x1 -x4 ;
  plot r.*nqq.;
  model y = x2 x3;
  plot r.*x2x3;
run;quit;
Fig. 8.2c-8.2d.
proc reg data = ch8tab01 noprint;
  var x2x3;
  model logy = x1 -x4;
  plot r.*nqq.;
  model logy = x2 x3;
  plot r.*x2x3;
run;
quit;
Fig. 8.3a, p. 337. Scatterplot matrix.
Note: Invoking a macro for the scatter matrix.
* %scatter(data = ch8tab01, var = logy x1 x2 x3 x4) ;
Fig. 8.3b, p. 337. Correlation matrix.
proc corr data = ch8tab01;
  var logy x1 x2 x3 x4;
run;
The CORR Procedure5 Variables: logy x1 x2 x3 x4
Simple Statistics
Variable N Mean Std Dev Sum Minimum Maximum Label
logy 54 2.20614 0.27378 119.13174 1.53148 2.91908 x1 54 5.78333 1.60303 312.30000 2.60000 11.20000 blood-clotting x2 54 63.24074 16.90253 3415 8.00000 96.00000 prognostic x3 54 77.11111 21.25378 4164 23.00000 119.00000 enzyme x4 54 2.74426 1.07036 148.19000 0.74000 6.40000 liver function
Pearson Correlation Coefficients, N = 54 Prob > |r| under H0: Rho=0
logy x1 x2 x3 x4
logy 1.00000 0.34643 0.59290 0.66509 0.72620 0.0103 <.0001 <.0001 <.0001
x1 0.34643 1.00000 0.09012 -0.14963 0.50242 blood-clotting 0.0103 0.5169 0.2802 0.0001
x2 0.59290 0.09012 1.00000 -0.02361 0.36903 prognostic <.0001 0.5169 0.8655 0.0060
x3 0.66509 -0.14963 -0.02361 1.00000 0.41642 enzyme <.0001 0.2802 0.8655 0.0017
x4 0.72620 0.50242 0.36903 0.41642 1.00000 liver function <.0001 0.0001 0.0060 0.0017
Table 8.2, p. 338.
This first output is missing df and PRESS but it is easier to read and it looks nice!
proc reg data=ch8tab01 ;
  model logy = x1-x4/selection=rsquare adjrsq cp press mse sse;
run;
quit;
The REG Procedure Model: MODEL1 Dependent Variable: logyR-Square Selection Method
Number in Adjusted Model R-Square R-Square C(p) MSE SSE Variables in Model
1 0.5274 0.5183 787.9471 0.03611 1.87765 x4 1 0.4424 0.4316 938.6707 0.04260 2.21539 x3 1 0.3515 0.3391 1099.691 0.04954 2.57620 x2 1 0.1200 0.1031 1510.148 0.06723 3.49594 x1 ——————————————————————————————- 2 0.8129 0.8056 283.6276 0.01457 0.74310 x2 x3 2 0.6865 0.6742 507.8069 0.02442 1.24544 x3 x4 2 0.6496 0.6358 573.2766 0.02730 1.39214 x2 x4 2 0.6458 0.6319 580.0075 0.02759 1.40722 x1 x3 2 0.5278 0.5093 789.1422 0.03678 1.87585 x1 x4 2 0.4381 0.4160 948.2417 0.04377 2.23235 x1 x2 ——————————————————————————————- 3 0.9723 0.9707 3.0390 0.00220 0.10989 x1 x2 x3 3 0.8829 0.8758 161.6520 0.00931 0.46530 x2 x3 x4 3 0.7192 0.7023 451.8957 0.02231 1.11567 x1 x3 x4 3 0.6500 0.6290 574.5468 0.02781 1.39051 x1 x2 x4 ——————————————————————————————- 4 0.9724 0.9701 5.0000 0.00224 0.10980 x1 x2 x3 x4
This second output requires a lot more work but it includes the Press statistics.
ods listing close;
proc reg data=ch8tab01 ;
  model logy = x1-x4/selection=rsquare adjrsq cp press mse sse;
  ods output SubsetSelSummary=temp100;
run; quit;
ods listing;
proc reg data = ch8tab01 outest = tp1 covout noprint;
  model logy = x1/rsquare adjrsq cp press mse sse;
  model logy = x2/rsquare adjrsq cp press mse sse;
  model logy = x3/rsquare adjrsq cp press mse sse;
  model logy = x4/rsquare adjrsq cp press mse sse;
  model logy = x1 x2/rsquare adjrsq cp press mse sse;
  model logy = x1 x3/rsquare adjrsq cp press mse sse;
  model logy = x1 x4/rsquare adjrsq cp press mse sse;
  model logy = x2 x3/rsquare adjrsq cp press mse sse;
  model logy = x2 x4/rsquare adjrsq cp press mse sse;
  model logy = x3 x4/rsquare adjrsq cp press mse sse;
  model logy = x1 x2 x3/rsquare adjrsq cp press mse sse;
  model logy = x1 x2 x4/rsquare adjrsq cp press mse sse;
  model logy = x1 x3 x4/rsquare adjrsq cp press mse sse;
  model logy = x2 x3 x4/rsquare adjrsq cp press mse sse;
  model logy = x1 x2 x3 x4/rsquare adjrsq cp press mse sse;
run;quit;
data temp100;
  set temp100;
  mse1=input(mse, 6.);
run;
data temp120;
  set tp1;
  if _type_ = 'PARMS';
  mse1=input(_mse_, 6.);
run;
proc sql;
  create table temp300
  as select *
  from temp120 , temp100
  where temp120.MSE1 = temp100.mse1;
  quit;
run;
proc print data=temp300 (rename=(_p_=p _edf_=df _press_=Press));
 var varsinmodel p  df sse rsquare mse cp Press;
run;
Obs VarsInModel p df SSE RSquare MSE Cp Press1 x1 2 52 3.49594 0.1200 0.06723 1510.148 3.80826 2 x2 2 52 2.57620 0.3515 0.04954 1099.691 2.86259 3 x3 2 52 2.21539 0.4424 0.04260 938.6707 2.42697 4 x4 2 52 1.87765 0.5274 0.03611 787.9471 2.02923 5 x1 x2 3 51 2.23235 0.4381 0.04377 948.2417 2.63864 6 x1 x3 3 51 1.40722 0.6458 0.02759 580.0075 1.60958 7 x1 x4 3 51 1.87585 0.5278 0.03678 789.1422 2.12033 8 x2 x3 3 51 0.74310 0.8129 0.01457 283.6276 0.83526 9 x2 x4 3 51 1.39214 0.6496 0.02730 573.2766 1.58332 10 x3 x4 3 51 1.24544 0.6865 0.02442 507.8069 1.42879 11 x1 x2 x3 4 50 0.10989 0.9723 0.00220 3.0390 0.14049 12 x1 x2 x4 4 50 1.39051 0.6500 0.02781 574.5468 1.65132 13 x1 x3 x4 4 50 1.11567 0.7192 0.02231 451.8957 1.32872 14 x2 x3 x4 4 50 0.46530 0.8829 0.00931 161.6520 0.54878 15 x1 x2 x3 x4 5 49 0.10980 0.9724 0.00224 5.0000 0.14561
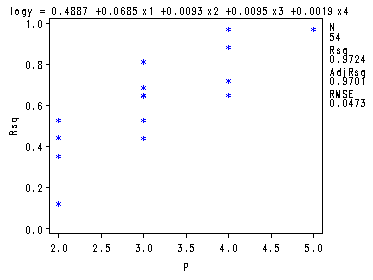
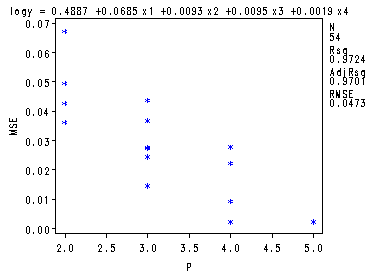
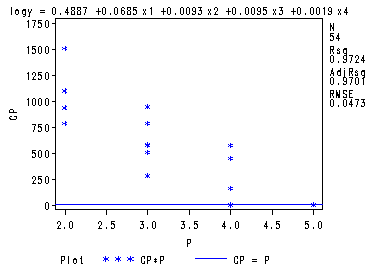
Fig. 8.4-8.6, p. 340-344. There is a quick and dirty way of getting these graphs straight from the proc reg by just adding a few plot statements.
goptions reset=all;
symbol1 v=star c=blue h = .8;
proc reg data = ch8tab01  outest = temp covout;
  model logy = x1-x4/ selection= rsquare adjrsq cp mse noprint;
  plot cp.*np. / cmallows = blue;
  plot mse.*np.;
  plot rsq.*np.;
run;
quit;
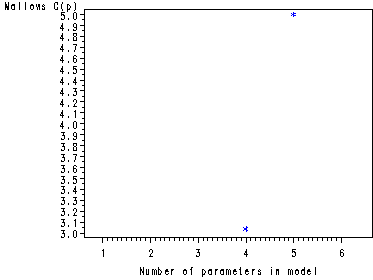
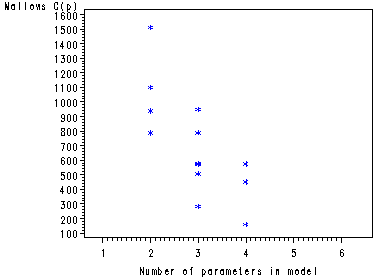
The preceding graphs are very nice but the plot of Mallow’s Cp has values that are too spread out to be useful in one plot. As in this example, it is often beneficial to create two separate plots for Mallow’s Cp: one plot where the values are close to P (number of parameters in the model) and a plot where the values are not close to P. This is illustrated in the following two plots.
symbol1 v=star c=blue h = .8;
proc reg data = ch8tab01  outest = temp covout;
  model logy = x1-x4/ selection= rsquare adjrsq cp mse noprint;
run;quit;

data templess (keep = _P_ _CP_ );
  set temp;
  if _CP_ < _P_ + 2;
run;

axis1 order=(1 to 6 by 1) offset=(3, 5);
symbol1 v=star c=blue h = .8;
proc gplot data = templess;
  plot _CP_*_P_ / haxis = axis1;
run;
quit;

data tempmore (keep = _P_ _CP_ );
  set temp;
  if _CP_ >= _P_ + 2;
run;

axis1 order=(1 to 6 by 1) offset=(3, 5);
symbol1 v=star c=blue h = .8;
proc gplot data = tempmore;
  plot _CP_*_P_ / haxis = axis1 ;
run;
quit;
It is possible to create annotated plots like those in the book. For an example of an annotated Cp plot please see https://stats.idre.ucla.edu/stat/sas/examples/ara/arasas13.htm.
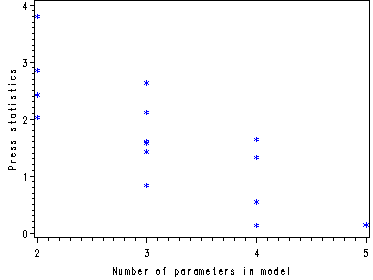
Fig. 8.7, p. 346. To get this graph it is necessary to use the temp300 dataset used to make the Table 8.2 which includes the PRESS statistics for all the models.
symbol1 v=star c=blue h = .8;
axis1 label = (angle=90 h=1 color=black );
proc gplot data = temp300;
  plot _press_*_p_ / vaxis = axis1;
run;
quit;
Fig. 8.9, p. 350. SAS does not provide as much detail at each step as BMDP does.
proc reg data = ch8tab01;
  model logy = x1-x4/ selection = stepwise slentry= .01 slstay= .05;
run;
quit;
The REG Procedure Model: MODEL1 Dependent Variable: logyStepwise Selection: Step 1
Variable x4 Entered: R-Square = 0.5274 and C(p) = 787.9471
Analysis of Variance
Sum of Mean Source DF Squares Square F Value Pr > F
Model 1 2.09508 2.09508 58.02 <.0001 Error 52 1.87765 0.03611 Corrected Total 53 3.97273
Parameter Standard Variable Estimate Error Type II SS F Value Pr > F
Intercept 1.69639 0.07174 20.18819 559.10 <.0001 x4 0.18575 0.02439 2.09508 58.02 <.0001
Bounds on condition number: 1, 1 ————————————————————————————————
Stepwise Selection: Step 2
Variable x3 Entered: R-Square = 0.6865 and C(p) = 507.8069
Analysis of Variance
Sum of Mean Source DF Squares Square F Value Pr > F
Model 2 2.72729 1.36364 55.84 <.0001 Error 51 1.24544 0.02442 Corrected Total 53 3.97273
Parameter Standard Variable Estimate Error Type II SS F Value Pr > F
Intercept 1.38881 0.08447 6.60107 270.31 <.0001 x3 0.00565 0.00111 0.63221 25.89 <.0001 x4 0.13902 0.02206 0.96995 39.72 <.0001
The REG Procedure Model: MODEL1 Dependent Variable: logy
Stepwise Selection: Step 2
Bounds on condition number: 1.2098, 4.8392 ————————————————————————————————
Stepwise Selection: Step 3
Variable x2 Entered: R-Square = 0.8829 and C(p) = 161.6520
Analysis of Variance
Sum of Mean Source DF Squares Square F Value Pr > F
Model 3 3.50743 1.16914 125.63 <.0001 Error 50 0.46530 0.00931 Corrected Total 53 3.97273
Parameter Standard Variable Estimate Error Type II SS F Value Pr > F
Intercept 0.94229 0.07140 1.62097 174.18 <.0001 x2 0.00790 0.00086269 0.78014 83.83 <.0001 x3 0.00700 0.00070135 0.92684 99.60 <.0001 x4 0.08185 0.01498 0.27780 29.85 <.0001
Bounds on condition number: 1.4642, 11.822 ————————————————————————————————
Stepwise Selection: Step 4
Variable x1 Entered: R-Square = 0.9724 and C(p) = 5.0000
Analysis of Variance
Sum of Mean Source DF Squares Square F Value Pr > F
Model 4 3.86293 0.96573 430.98 <.0001 Error 49 0.10980 0.00224 Corrected Total 53 3.97273
The REG Procedure Model: MODEL1 Dependent Variable: logy
Stepwise Selection: Step 4
Parameter Standard Variable Estimate Error Type II SS F Value Pr > F
Intercept 0.48874 0.05024 0.21206 94.64 <.0001 x1 0.06853 0.00544 0.35550 158.65 <.0001 x2 0.00925 0.00043679 1.00587 448.90 <.0001 x3 0.00947 0.00039630 1.28071 571.55 <.0001 x4 0.00192 0.00971 0.00008741 0.04 0.8442
Bounds on condition number: 2.5553, 29.286 ————————————————————————————————
Stepwise Selection: Step 5
Variable x4 Removed: R-Square = 0.9723 and C(p) = 3.0390
Analysis of Variance
Sum of Mean Source DF Squares Square F Value Pr > F
Model 3 3.86284 1.28761 585.89 <.0001 Error 50 0.10989 0.00220 Corrected Total 53 3.97273
Parameter Standard Variable Estimate Error Type II SS F Value Pr > F
Intercept 0.48362 0.04263 0.28280 128.68 <.0001 x1 0.06923 0.00408 0.63322 288.13 <.0001 x2 0.00929 0.00038255 1.29734 590.31 <.0001 x3 0.00952 0.00030644 2.12247 965.76 <.0001
Bounds on condition number: 1.0308, 9.1864 ————————————————————————————————
All variables left in the model are significant at the 0.0500 level.
No other variable met the 0.0100 significance level for entry into the model.
The REG Procedure Model: MODEL1 Dependent Variable: logy
Summary of Stepwise Selection
Variable Variable Number Partial Model Step Entered Removed Label Vars In R-Square R-Square C(p) F Value Pr > F
1 x4 liver function 1 0.5274 0.5274 787.947 58.02 <.0001 2 x3 enzyme 2 0.1591 0.6865 507.807 25.89 <.0001 3 x2 prognostic 3 0.1964 0.8829 161.652 83.83 <.0001 4 x1 blood-clotting 4 0.0895 0.9724 5.0000 158.65 <.0001 5 x4 liver function 3 0.0000 0.9723 3.0390 0.04 0.8442

