Inputting the Life Insurance data, Table 9.1, p. 364.
data ch9tab01;
  input x1 x2 y;
  label x1 = 'Income'
        x2 = 'Risk Aversion'
	 y = 'Insurance';
cards;
45.010   6   91
57.204   4  162
26.852   5   11
66.290   7  240
40.964   5   73
72.996  10  311
79.380   1  316
52.766   8  154
55.916   6  164
38.122   4   54
35.840   6   53
75.796   9  326
37.408   5   55
54.376   2  130
46.186   7  112
46.130   4   91
30.366   3   14
39.060   5   63
;;;
run;
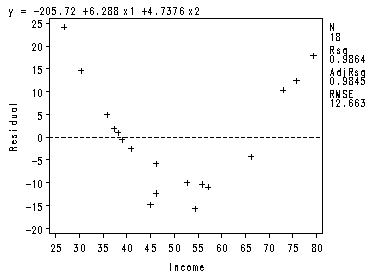
The equation 9.3, p. 364 and the plots in Fig. 9.3, p. 365.
proc reg data = ch9tab01 ;
  model y = x1 x2 / partial ;
  plot r.*x1;
run;
quit;
The REG Procedure Model: MODEL1 Dependent Variable: y InsuranceAnalysis of Variance
Sum of Mean Source DF Squares Square F Value Pr > F
Model 2 173919 86960 542.33 <.0001 Error 15 2405.14763 160.34318 Corrected Total 17 176324
Root MSE 12.66267 R-Square 0.9864 Dependent Mean 134.44444 Adj R-Sq 0.9845 Coeff Var 9.41851
Parameter Estimates
Parameter Standard Variable Label DF Estimate Error t Value Pr > |t|
Intercept Intercept 1 -205.71866 11.39268 -18.06 <.0001 x1 Income 1 6.28803 0.20415 30.80 <.0001 x2 Risk Aversion 1 4.73760 1.37808 3.44 0.0037
The REG Procedure Model: MODEL1 Partial Regression Residual Plot
———+——+——+——+——+——+——+——+——+——+——+——— y | | | | | | 125 + + | | | | | 11 | 100 + + | | | | | | 75 + + | | | | | | 50 + + | 1 | I | 1 | n | | s 25 + + u | | r | 1 | a | | n 0 + 1 + c | | e | 1 | | 1 | -25 + + | | | 1 | | 11 | -50 + 1 1 1 + | 1 1 | | 1 | | | -75 + 1 + | | | | | | -100 + + | | | | | | ———+——+——+——+——+——+——+——+——+——+——+——— -0.5 -0.4 -0.3 -0.2 -0.1 0.0 0.1 0.2 0.3 0.4 0.5
Intercept The REG Procedure Model: MODEL1 Partial Regression Residual Plot
—–+—–+—–+—–+—–+—–+—–+—–+—–+—–+—–+—–+—–+—–+—– y | | 250 + 1 + | | | | | | | | 200 + + | | | | | | | | 150 + + | 1 | | | | | | | 100 + 1 + I | | n | 1 | s | | u | | r 50 + 11 + a | | n | | c | 1 | e | | 0 + + | | | 2 | | | | | -50 + 11 + | 11 | | 1 1 | | 1 | | 1 | -100 + + | | | 1 | | | | | -150 + + | | —–+—–+—–+—–+—–+—–+—–+—–+—–+—–+—–+—–+—–+—–+—– -25 -20 -15 -10 -5 0 5 10 15 20 25 30 35 40
Income x1 The REG Procedure Model: MODEL1 Partial Regression Residual Plot
———+——+——+——+——+——+——+——+——+——+——+———- 30 + + | 1 | | 1 | | 1 | | | | | 20 + + | | | | | | | | | | 10 + 1 + | | | 1 | y | | | | I | 1 1 1 | n 0 + 1 1 + s | | u | 1 1 | r | | a | | n | 1 1 | c -10 + + e | 1 | | | | | | | | 1 1 | -20 + + | | | | | | | | | | -30 + + | | | 1 | | | | | | | -40 + + ———+——+——+——+——+——+——+——+——+——+——+———- -6 -5 -4 -3 -2 -1 0 1 2 3 4
Risk Aversion x2
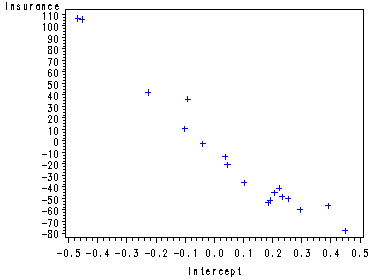
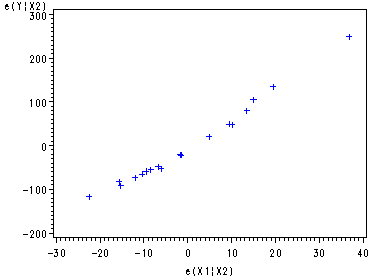
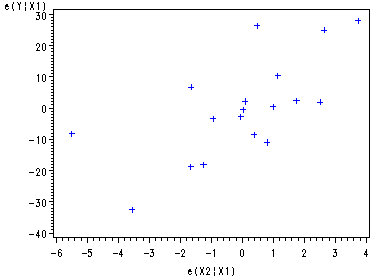
If the size of the partial plots are a problem here is another way of creating the plots one by one starting with the intercept, then x1 (Fig. 9.3b, p. 365) and finally x2.
Partial Regression plot for the intercept.
data ch9tab01; set ch9tab01; Int=1; run; proc reg data=ch9tab01 noprint; model y Int = x1 x2 / noint; output out=tempint r=ry rx; run; symbol1 c=blue; proc gplot data=tempint; plot ry*rx; label ry='Insurance' rx='Intercept'; run; quit;
Partial Regression plot against e(X1|X2), Fig. 9.3b, p. 365.
proc reg data=ch9tab01 noprint; model y x1 = x2 ; output out=tempx1 r=ry rx; run; symbol1 c=blue; proc gplot data=tempx1; plot ry*rx; label ry='e(Y|X2)' rx='e(X1|X2)'; run; quit;
Partial Regression plot against e(X2|X1).
proc reg data=ch9tab01 noprint; model y x2 = x1 ; output out=tempx2 r=ry rx; run; symbol1 c=blue; proc gplot data=tempx2; plot ry*rx; label ry='e(Y|X1)' rx='e(X2|X1)'; run; quit;
Inputting Body Fat data set from ch. 7, table 1, p. 261.
data ch7tab01; input X1 X2 X3 Y; label x1 = 'Triceps' x2 = 'Thigh cir.' x3 = 'Midarm cir.' y = 'body fat'; cards; 19.5 43.1 29.1 11.9 24.7 49.8 28.2 22.8 30.7 51.9 37.0 18.7 29.8 54.3 31.1 20.1 19.1 42.2 30.9 12.9 25.6 53.9 23.7 21.7 31.4 58.5 27.6 27.1 27.9 52.1 30.6 25.4 22.1 49.9 23.2 21.3 25.5 53.5 24.8 19.3 31.1 56.6 30.0 25.4 30.4 56.7 28.3 27.2 18.7 46.5 23.0 11.7 19.7 44.2 28.6 17.8 14.6 42.7 21.3 12.8 29.5 54.4 30.1 23.9 27.7 55.3 25.7 22.6 30.2 58.6 24.6 25.4 22.7 48.2 27.1 14.8 25.2 51.0 27.5 21.1 ; run;Fig. 9.4a-9.4d, p. 366.
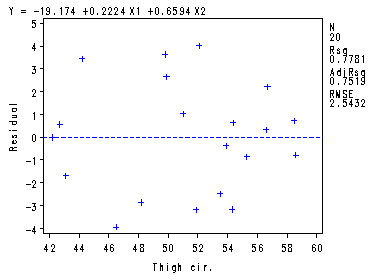
proc reg data = ch7tab01; model y = x1 x2/partial; plot r.*x1 r.*x2; run;quit;
The REG Procedure Model: MODEL1 Dependent Variable: Y body fatAnalysis of Variance
Sum of Mean Source DF Squares Square F Value Pr > F
Model 2 385.43871 192.71935 29.80 <.0001 Error 17 109.95079 6.46769 Corrected Total 19 495.38950
Root MSE 2.54317 R-Square 0.7781 Dependent Mean 20.19500 Adj R-Sq 0.7519 Coeff Var 12.59305
Parameter Estimates
Parameter Standard Variable Label DF Estimate Error t Value Pr > |t|
Intercept Intercept 1 -19.17425 8.36064 -2.29 0.0348 X1 Triceps 1 0.22235 0.30344 0.73 0.4737 X2 Thigh cir. 1 0.65942 0.29119 2.26 0.0369
The REG Procedure Model: MODEL1 Partial Regression Residual Plot
——+—–+—–+—–+—–+—–+—–+—–+—–+—–+—–+—–+—–+—–+—— Y | | | | | | | | 4 + + | | | 1 | | 1 1 1 | | | | | | | 2 + 1 + | 1 | | | | 1 1 | | 1 | | 1 1 1 | b | 1 | o 0 + + d | | y | | | | f | 1 | a | | t | | -2 + + | | | 1 | | | | | | 1 | | 1 1 | -4 + 1 + | | | | | | | | | 1 | | | -6 + + | | | | | | ——+—–+—–+—–+—–+—–+—–+—–+—–+—–+—–+—–+—–+—–+—— -0.12 -0.10 -0.08 -0.06 -0.04 -0.02 0.00 0.02 0.04 0.06 0.08 0.10 0.12 0.14
Intercept The REG Procedure Model: MODEL1 Partial Regression Residual Plot
–+—-+—-+—-+—-+—-+—-+—-+—-+—-+—-+—-+—-+—-+—-+—-+—-+—-+— 6 + + | | | | | | | | | | | 1 | 4 + + | 2 | | | | | | | | | | 1 1 | 2 + + | | | | b Y | 1 | o | 1 | d | 1 1 | y | 1 | 0 + 1 + f | | a | | t | 1 | | 1 1 | | 1 | | | -2 + 1 + | | | | | 1 1 1 | | | | | | | -4 + + | | | 1 | | | | | | | | | -6 + + –+—-+—-+—-+—-+—-+—-+—-+—-+—-+—-+—-+—-+—-+—-+—-+—-+—-+— -3.5 -3.0 -2.5 -2.0 -1.5 -1.0 -0.5 0.0 0.5 1.0 1.5 2.0 2.5 3.0 3.5 4.0 4.5 5.0
Triceps X1 The REG Procedure Model: MODEL1 Partial Regression Residual Plot
——-+—-+—-+—-+—-+—-+—-+—-+—-+—-+—-+—-+—-+—-+—-+—-+——– 4 + + | 1 | | | | 1 | | 1 | | 1 | | 1 | 2 + + | 1 1 | | | | 1 1 | | 1 | | | | 1 1 | 0 + 1 + | | | | b Y | | o | 1 | d | | y | | -2 + 1 + f | | a | | t | 1 | | 1 | | 1 | | | -4 + 1 + | | | | | | | | | | | | -6 + 1 + | | | | | | | | | | | | -8 + + ——-+—-+—-+—-+—-+—-+—-+—-+—-+—-+—-+—-+—-+—-+—-+—-+——– -4.5 -4.0 -3.5 -3.0 -2.5 -2.0 -1.5 -1.0 -0.5 0.0 0.5 1.0 1.5 2.0 2.5 3.0
Thigh cir. X2
Table 9.3, p. 375.
proc reg data = ch7tab01 noprint ; model y = x1 x2 ; output out=temp r=residual h=hat rstudent=rstudent; run; proc print data = temp; var residual hat rstudent; run;Obs residual hat rstudent1 -1.68271 0.20101 -0.72999 2 3.64293 0.05889 1.53425 3 -3.17597 0.37193 -1.65433 4 -3.15847 0.11094 -1.34848 5 -0.00029 0.24801 -0.00013 6 -0.36082 0.12862 -0.14755 7 0.71620 0.15552 0.29813 8 4.01473 0.09629 1.76009 9 2.65511 0.11464 1.11765 10 -2.47481 0.11024 -1.03373 11 0.33581 0.12034 0.13666 12 2.22551 0.10927 0.92318 13 -3.94686 0.17838 -1.82590 14 3.44746 0.14801 1.52476 15 0.57059 0.33321 0.26715 16 0.64230 0.09528 0.25813 17 -0.85095 0.10559 -0.34451 18 -0.78292 0.19679 -0.33441 19 -2.85729 0.06695 -1.17617 20 1.04045 0.05009 0.40936
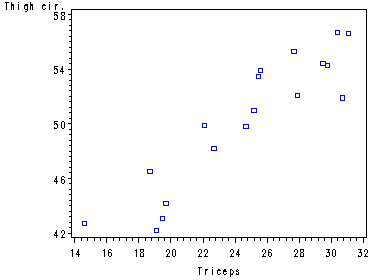
Fig. 9.7, p. 378.
symbol1 v=square c=blue h = .8; axis1 order=(42 to 60 by 4); axis2 order=(14 to 32 by 2); proc gplot data = ch7tab01; plot x2*x1/ vaxis=axis1 haxis= axis2; run; quit;
Table 9.4, p. 380.
ods listing close; proc reg data = ch7tab01; model y = x1 x2/influence ; ods output OutputStatistics=temp; output out=temp1 cookd = cooksd; run; quit; ods listing; data temp2; set temp; keep observation dffits dfb_intercept dfb_x1 dfb_x2 ; run; data temp1; set temp1; observation = _n_; keep observation cooksd; run; data combined ; merge temp1 temp2; by observation; run; proc print data = combined; var dffits cooksd dfb_intercept dfb_x1 dfb_x2; run;DFB_ Obs DFFITS cooksd Intercept DFB_X1 DFB_X21 -0.3661 0.04595 -0.3052 -0.1315 0.2320 2 0.3838 0.04548 0.1726 0.1150 -0.1426 3 -1.2731 0.49016 -0.8471 -1.1825 1.0669 4 -0.4763 0.07216 -0.1016 -0.2935 0.1961 5 -0.0001 0.00000 -0.0001 -0.0000 0.0001 6 -0.0567 0.00114 0.0397 0.0401 -0.0443 7 0.1279 0.00576 -0.0775 -0.0156 0.0543 8 0.5745 0.09794 0.2614 0.3911 -0.3325 9 0.4022 0.05313 -0.1514 -0.2947 0.2469 10 -0.3639 0.04396 0.2377 0.2446 -0.2688 11 0.0505 0.00090 -0.0090 0.0171 -0.0025 12 0.3233 0.03515 -0.1305 0.0225 0.0700 13 -0.8508 0.21215 0.1194 0.5924 -0.3895 14 0.6355 0.12489 0.4517 0.1132 -0.2977 15 0.1889 0.01258 -0.0030 -0.1248 0.0688 16 0.0838 0.00247 0.0093 0.0431 -0.0251 17 -0.1184 0.00493 0.0795 0.0550 -0.0761 18 -0.1655 0.00964 0.1321 0.0753 -0.1161 19 -0.3151 0.03236 -0.1296 -0.0041 0.0644 20 0.0940 0.00310 0.0102 0.0023 -0.0033
SAS actually has an influence option in the model statement that will display most of the diagnostic statistics. It contains everything in Table 9.3 and Table 9.4 except Cook’s D. So, unless it is absolutely critical to have Cook’s D with the Dfbetas, Dffits and the various residuals then this might be a nice simple alternative.
proc reg data = ch7tab01; model y = x1 x2/ influence; run;quit;The REG Procedure Model: MODEL1 Dependent Variable: Y body fatAnalysis of Variance
Sum of Mean Source DF Squares Square F Value Pr > F
Model 2 385.43871 192.71935 29.80 <.0001 Error 17 109.95079 6.46769 Corrected Total 19 495.38950
Root MSE 2.54317 R-Square 0.7781 Dependent Mean 20.19500 Adj R-Sq 0.7519 Coeff Var 12.59305
Parameter Estimates
Parameter Standard Variable Label DF Estimate Error t Value Pr > |t|
Intercept Intercept 1 -19.17425 8.36064 -2.29 0.0348 X1 Triceps 1 0.22235 0.30344 0.73 0.4737 X2 Thigh cir. 1 0.65942 0.29119 2.26 0.0369
The REG Procedure Model: MODEL1 Dependent Variable: Y body fat
Output Statistics
Hat Diag Cov ———–DFBETAS———– Obs Residual RStudent H Ratio DFFITS Intercept X1 X2
1 -1.6827 -0.7300 0.2010 1.3607 -0.3661 -0.3052 -0.1315 0.2320 2 3.6429 1.5343 0.0589 0.8443 0.3838 0.1726 0.1150 -0.1426 3 -3.1760 -1.6543 0.3719 1.1892 -1.2731 -0.8471 -1.1825 1.0669 4 -3.1585 -1.3485 0.1109 0.9768 -0.4763 -0.1016 -0.2935 0.1961 5 -0.000289 -0.000127 0.2480 1.5951 -0.0001 -0.0001 -0.0000 0.0001 6 -0.3608 -0.1475 0.1286 1.3709 -0.0567 0.0397 0.0401 -0.0443 7 0.7162 0.2981 0.1555 1.3969 0.1279 -0.0775 -0.0156 0.0543 8 4.0147 1.7601 0.0963 0.7805 0.5745 0.2614 0.3911 -0.3325 9 2.6551 1.1176 0.1146 1.0812 0.4022 -0.1514 -0.2947 0.2469 10 -2.4748 -1.0337 0.1102 1.1104 -0.3639 0.2377 0.2446 -0.2688 11 0.3358 0.1367 0.1203 1.3588 0.0505 -0.0090 0.0171 -0.0025 12 2.2255 0.9232 0.1093 1.1525 0.3233 -0.1305 0.0225 0.0700 13 -3.9469 -1.8259 0.1784 0.8274 -0.8508 0.1194 0.5924 -0.3895 14 3.4475 1.5248 0.1480 0.9371 0.6355 0.4517 0.1132 -0.2977 15 0.5706 0.2672 0.3332 1.7750 0.1889 -0.0030 -0.1248 0.0688 16 0.6423 0.2581 0.0953 1.3094 0.0838 0.0093 0.0431 -0.0251 17 -0.8509 -0.3445 0.1056 1.3117 -0.1184 0.0795 0.0550 -0.0761 18 -0.7829 -0.3344 0.1968 1.4625 -0.1655 0.1321 0.0753 -0.1161 19 -2.8573 -1.1762 0.0670 1.0024 -0.3151 -0.1296 -0.0041 0.0644 20 1.0404 0.4094 0.0501 1.2238 0.0940 0.0102 0.0023 -0.0033
Sum of Residuals 0 Sum of Squared Residuals 109.95079 Predicted Residual SS (PRESS) 154.47356
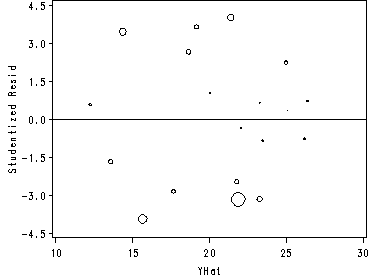
Fig. 9.8a, p. 382. With an added bonus: a line through zero. To get rid of the line just delete the vref=0 option in the model statement.
proc reg data=ch7tab01 noprint; model y=x1 x2; output out=tempout cookd=ckd p=yhat r=resid; run; quit; axis1 order=(10 to 30 by 5); axis2 order=(-4.5 to 4.5 by 1.5) label = (angle=90 h=1 color=black 'Studentized Resid' ); proc gplot data=tempout; bubble resid*yhat=ckd /haxis=axis1 vaxis=axis2 bsize=10 hminor=0 vminor=0 vref=0 bsize=4; label resid='Studentized Residuals'; label yhat='YHat'; run; quit;
To see another example of a Proportional Influence plot using studentized residuals versus leverage where the size is also controlled by the Cook’s D please see: https://stats.idre.ucla.edu/stat/sas/examples/ara/arasas11.htm.
Fig. 9.8b, p. 382. The first data step is just to create the index to be used in the plot. The extra option line after the quit statement is to make sure that future plots do not have observations joined by a line.
data tempout; set tempout; id = _n_; run; symbol1 v=square i=join h = .8; axis1 label = (angle=90 h=1 color=black 'Cooks D' ) order=(0 to 0.5 by 0.1); axis2 order=(0 to 25 by 5); proc gplot data=tempout; plot ckd*id / vaxis=axis1 haxis=axis2; run; quit; symbol1 v=square i=none h=.8;
Table 9.5, p. 388.
proc reg data = ch7tab01; model y = x1 x2 x3/ vif tol stb; run; quit;The REG Procedure Model: MODEL1 Dependent Variable: Y body fatAnalysis of Variance
Sum of Mean Source DF Squares Square F Value Pr > F
Model 3 396.98461 132.32820 21.52 <.0001 Error 16 98.40489 6.15031 Corrected Total 19 495.38950
Root MSE 2.47998 R-Square 0.8014 Dependent Mean 20.19500 Adj R-Sq 0.7641 Coeff Var 12.28017
Parameter Estimates
Parameter Standard Standardized Variable Label DF Estimate Error t Value Pr > |t| Estimate
Intercept Intercept 1 117.08469 99.78240 1.17 0.2578 0 X1 Triceps 1 4.33409 3.01551 1.44 0.1699 4.26370 X2 Thigh cir. 1 -2.85685 2.58202 -1.11 0.2849 -2.92870 X3 Midarm cir. 1 -2.18606 1.59550 -1.37 0.1896 -1.56142
Parameter Estimates
Variance Variable Label DF Tolerance Inflation
Intercept Intercept 1 . 0 X1 Triceps 1 0.00141 708.84291 X2 Thigh cir. 1 0.00177 564.34339 X3 Midarm cir. 1 0.00956 104.60601
Surgical Unit example–continued, p. 388-392. Creating the logy variable.
data ch8tab01; input x1 x2 x3 x4 y logy; label x1 = 'blood-clotting' x2 = 'prognostic' x3 = 'enzyme' x4 = 'liver function' y = 'survival' logy = 'logSurvival'; cards; 6.7 62 81 2.59 200 2.3010 5.1 59 66 1.70 101 2.0043 7.4 57 83 2.16 204 2.3096 6.5 73 41 2.01 101 2.0043 7.8 65 115 4.30 509 2.7067 5.8 38 72 1.42 80 1.9031 5.7 46 63 1.91 80 1.9031 3.7 68 81 2.57 127 2.1038 6.0 67 93 2.50 202 2.3054 3.7 76 94 2.40 203 2.3075 6.3 84 83 4.13 329 2.5172 6.7 51 43 1.86 65 1.8129 5.8 96 114 3.95 830 2.9191 5.8 83 88 3.95 330 2.5185 7.7 62 67 3.40 168 2.2253 7.4 74 68 2.40 217 2.3365 6.0 85 28 2.98 87 1.9395 3.7 51 41 1.55 34 1.5315 7.3 68 74 3.56 215 2.3324 5.6 57 87 3.02 172 2.2355 5.2 52 76 2.85 109 2.0374 3.4 83 53 1.12 136 2.1335 6.7 26 68 2.10 70 1.8451 5.8 67 86 3.40 220 2.3424 6.3 59 100 2.95 276 2.4409 5.8 61 73 3.50 144 2.1584 5.2 52 86 2.45 181 2.2577 11.2 76 90 5.59 574 2.7589 5.2 54 56 2.71 72 1.8573 5.8 76 59 2.58 178 2.2504 3.2 64 65 0.74 71 1.8513 8.7 45 23 2.52 58 1.7634 5.0 59 73 3.50 116 2.0645 5.8 72 93 3.30 295 2.4698 5.4 58 70 2.64 115 2.0607 5.3 51 99 2.60 184 2.2648 2.6 74 86 2.05 118 2.0719 4.3 8 119 2.85 120 2.0792 4.8 61 76 2.45 151 2.1790 5.4 52 88 1.81 148 2.1703 5.2 49 72 1.84 95 1.9777 3.6 28 99 1.30 75 1.8751 8.8 86 88 6.40 483 2.6840 6.5 56 77 2.85 153 2.1847 3.4 77 93 1.48 191 2.2810 6.5 40 84 3.00 123 2.0899 4.5 73 106 3.05 311 2.4928 4.8 86 101 4.10 398 2.5999 5.1 67 77 2.86 158 2.1987 3.9 82 103 4.55 310 2.4914 6.6 77 46 1.95 124 2.0934 6.4 85 40 1.21 125 2.0969 6.4 59 85 2.33 198 2.2967 8.8 78 72 3.20 313 2.4955 ; run;The VIF at the bottom of p. 389.
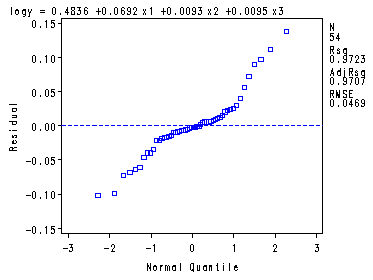
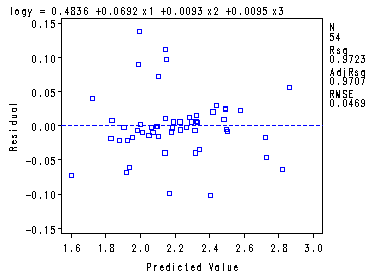
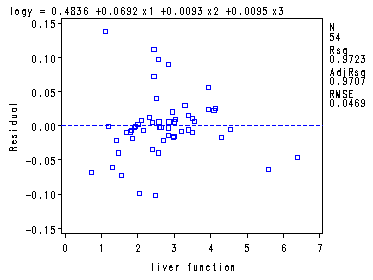
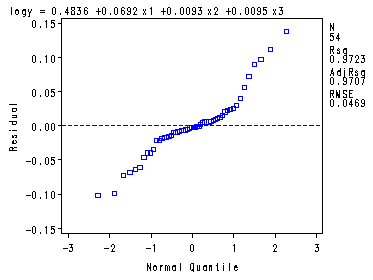
Fig. 9.9a, 9.9b and 9.9d, p. 390.proc reg data = ch8tab01; var x4; model logy = x1-x3/ vif tol; plot r.*p. r.*x4 r.*nqq.; run; quit;The REG Procedure Model: MODEL1 Dependent Variable: logy logSurvivalAnalysis of Variance
Sum of Mean Source DF Squares Square F Value Pr > F
Model 3 3.86291 1.28764 586.04 <.0001 Error 50 0.10986 0.00220 Corrected Total 53 3.97277
Root MSE 0.04687 R-Square 0.9723 Dependent Mean 2.20614 Adj R-Sq 0.9707 Coeff Var 2.12470
Parameter Estimates
Parameter Standard Variable Label DF Estimate Error t Value Pr > |t| Tolerance
Intercept Intercept 1 0.48362 0.04263 11.34 <.0001 . x1 blood-clotting 1 0.06923 0.00408 16.98 <.0001 0.97011 x2 prognostic 1 0.00929 0.00038250 24.30 <.0001 0.99177 x3 enzyme 1 0.00952 0.00030641 31.08 <.0001 0.97751
Parameter Estimates
Variance Variable Label DF Inflation
Intercept Intercept 1 0 x1 blood-clotting 1 1.03081 x2 prognostic 1 1.00829 x3 enzyme 1 1.02301
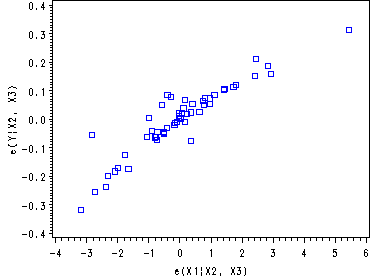
Fig. 9.9c, p. 390.
proc reg data=ch8tab01 noprint; model logy x1 = x2 x3; output out=tempx1 r=ry rx; run; symbol1 v=square c=blue i=none; axis1 label = (angle=90 h=1 color=black 'e(Y|X2, X3)' ); proc gplot data=tempx1; plot ry*rx / vaxis = axis1; label rx='e(X1|X2, X3)'; run; quit;
Table 9.6, p. 391
In order to get only a few of the variables and observations from the influence option it is necessary to use an ods output. But influence does not give us Cook’s D so we have to that from a regular output statement. The result is that there are two datasets: an ods dataset containing residual, hatdiagonal,rstudent, dffits and another data set containing Cook’s D, these two datasets are then merged and we can pick out the interesting observations.ods listing close; proc reg data = ch8tab01; model logy = x1-x3/influence ; ods output OutputStatistics=temp; output out=temp1 cookd = cooksd; run; quit; ods listing; data temp2; set temp; keep observation residual hatdiagonal rstudent dffits; run; data temp1; set temp1; observation = _n_; keep observation cooksd; run; data combined ; merge temp1 temp2; by observation; run; proc print data = combined; where observation=13 or observation=17 or observation=22 or observation=27 or observation=28 or observation=32 or observation=38; var residual hatdiagonal rstudent dffits cooksd; run;Hat Obs Residual Diagonal RStudent DFFITS cooksd13 0.0560 0.1495 1.3046 0.5469 0.07375 17 -0.0162 0.1499 -0.3709 -0.1557 0.00617 22 0.1383 0.1274 3.4952 1.3353 0.36409 27 0.1118 0.0311 2.5523 0.4572 0.04706 28 -0.0636 0.2619 -1.6027 -0.9546 0.22090 32 0.0402 0.2113 0.9656 0.4998 0.06252 38 0.0902 0.2902 2.3903 1.5282 0.53356

