Section 11.1
Regression analysis in the middle of page 269 using the davis data file. First create a dataset with a dummy variable called female and an interaction regressor measwt as the product of measured weight and female. Run regression on them.
data davisIn; /*A dataset with the interaction variable and a subject variable*/
  set davis;
  measwt_f = measwt * (1-male);
  female=1-male;
  drop male;
run;
proc reg data=davisIn;
  model reptwt=measwt female measwt_f;
run;
quit;

The REG Procedure
Model: MODEL1
Dependent Variable: reptwt

                             Analysis of Variance

                                    Sum of           Mean
Source                   DF        Squares         Square    F Value    Pr > F

Model                     3          30655          10218     470.41    <.0001
Error                   179     3888.25423       21.72209
Corrected Total         182          34543


Root MSE              4.66070    R-Square     0.8874
Dependent Mean       65.62295    Adj R-Sq     0.8856
Coeff Var             7.10224

                        Parameter Estimates

                     Parameter       Standard
Variable     DF       Estimate          Error    t Value    Pr > |t|

Intercept     1        1.35864        3.27719       0.41      0.6789
measwt        1        0.98982        0.04260      23.24      <.0001
female        1       39.96412        3.92932      10.17      <.0001
measwt_f      1       -0.72536        0.05598     -12.96      <.0001
Now we fix the error in case 12 of the dataset. We keep the dataset with the error as davisIn and call our new fixed dataset as davis_co.
data davis_co;
  set davisIn;
  if _n_=12 then do
  temp=measht;
  measht=measwt;
  measwt=temp;
  measwt_f=temp;
  end;
  drop temp;
run;
proc reg data=davis_co ;
  model reptwt=measwt female measwt_f;
run;
quit;

The REG Procedure
Model: MODEL1
Dependent Variable: reptwt

                             Analysis of Variance

                                    Sum of           Mean
Source                   DF        Squares         Square    F Value    Pr > F

Model                     3          33642          11214    2228.78    <.0001
Error                   179      900.63897        5.03150
Corrected Total         182          34543


Root MSE              2.24310    R-Square     0.9739
Dependent Mean       65.62295    Adj R-Sq     0.9735
Coeff Var             3.41817

                        Parameter Estimates

                     Parameter       Standard
Variable     DF       Estimate          Error    t Value    Pr > |t|

Intercept     1        1.35864        1.57725       0.86      0.3902
measwt        1        0.98982        0.02050      48.28      <.0001
female        1        1.98252        2.45028       0.81      0.4195
measwt_f      1       -0.05668        0.03845      -1.47      0.1422
To get the formula on page 270, we need to create a dataset containing the dummy variable of female and a new interaction regressor reptwt_f. Then we run regression of reported weight on measured weight. We run them on both corrected and uncorrected dataset.
Corrected dataset
data davis_co1;
  set davis;
  reptwt_f=reptwt*(1-male);
  female=1-male;
  if subject=12 then do
  temp=measwt;
  measwt=measht;
  measht=temp;
  end;
  drop male temp;
run;
proc reg data=davis_co1;
  model measwt=reptwt female reptwt_f;
run;
quit;

The REG Procedure
Model: MODEL1
Dependent Variable: measwt

                             Analysis of Variance

                                    Sum of           Mean
Source                   DF        Squares         Square    F Value    Pr > F

Model                     3          31722          10574    2082.30    <.0001
Error                   179      908.96214        5.07800
Corrected Total         182          32631

Root MSE              2.25344    R-Square     0.9721
Dependent Mean       65.62842    Adj R-Sq     0.9717
Coeff Var             3.43364

                        Parameter Estimates

                     Parameter       Standard
Variable     DF       Estimate          Error    t Value    Pr > |t|

Intercept     1        1.79428        1.57989       1.14      0.2576
reptwt        1        0.96892        0.02038      47.55      <.0001
female        1       -0.01678        2.47955      -0.01      0.9946
reptwt_f      1        0.00831        0.03917       0.21      0.8323
Now on uncorrected dataset.
data davisIn1;
  set davis;
  reptwt_f=reptwt*(1-male);
  female=1-male;
  drop male;
run;
proc reg data=davisIn1;
  model measwt=reptwt female reptwt_f;
run;
quit;

The REG Procedure
Model: MODEL1
Dependent Variable: measwt

                             Analysis of Variance

                                    Sum of           Mean
Source                   DF        Squares         Square    F Value    Pr > F

Model                     3          29786     9928.79278     139.07    <.0001
Error                   179          12779       71.39350
Corrected Total         182          42566


Root MSE              8.44947    R-Square     0.6998
Dependent Mean       66.22404    Adj R-Sq     0.6947
Coeff Var            12.75891

                        Parameter Estimates

                     Parameter       Standard
Variable     DF       Estimate          Error    t Value    Pr > |t|

Intercept     1        1.79428        5.92394       0.30      0.7623
reptwt        1        0.96892        0.07641      12.68      <.0001
female        1        2.07421        9.29727       0.22      0.8237
reptwt_f      1       -0.00953        0.14685      -0.06      0.9484
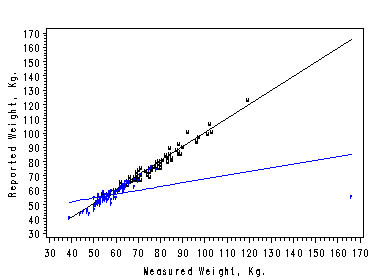
To produce Figure 11.2. on page 270, we first create a dataset that contains two new variables freptwt and mreptwt for reported weight on female and male respectively. Then we run proc glm on the dataset and output the predicted values for both female an male group. Then we use SAS proc gplot to render the plot
data davisPr;
  set davis;
  if male=1 then
  mreptwt=reptwt;
  if male=0 then
  freptwt=reptwt;
  output;
run; /*dataset created*/
proc glm data=davisPr;
  model mreptwt freptwt =measwt;
  output out=dvsOut p=pm pf;
run;
quit;
symbol1 c=black i=none v='M' height=0.5;
symbol2 c=black i=join v=none height=1.5;
symbol3 c=blue  i=none v='F' height=0.5;
symbol4 c=blue  i=join v=none height=1.5;
axis1  label=(r=0 a=90);
filename outfiles 'https://stats.idre.ucla.edu/wp-content/uploads/2016/02/chp11Fig1.gif';
goptions gsfname=outfiles dev=gif373;
proc sort data=dvsOut;
by measwt;
run;
proc gplot data=dvsOut;
  plot mreptwt*measwt=1 pm*measwt=2 freptwt*measwt=3 pf*measwt=4
  /overlay vaxis=axis1;
  label measwt='Measured Weight, Kg.';
  label mreptwt='Reported Weight, Kg.';
run;
quit;
Section 11.2
Page 271, make hat diagonal (leverage) and show largest values.
proc reg data=davisIn ;
  model reptwt=measwt female measwt_f;
  output out=dvsLev p=pr h=lev;/* p for predicted h for leverage*/;
run;
quit;
proc univariate data=dvsLev;
  var lev;
run;
proc print data=dvsLev;
  where lev ge 0.7;
run;

The REG Procedure
Model: MODEL1
Dependent Variable: reptwt

                             Analysis of Variance

                                    Sum of           Mean
Source                   DF        Squares         Square  F Value  Pr > F

Model                     3          30655          10218   470.41  <.0001
Error                   179     3888.25423       21.72209
Corrected Total         182          34543


Root MSE              4.66070    R-Square     0.8874
Dependent Mean       65.62295    Adj R-Sq     0.8856
Coeff Var             7.10224

                        Parameter Estimates

                     Parameter       Standard
Variable     DF       Estimate          Error    t Value    Pr > |t|

Intercept     1        1.35864        3.27719       0.41      0.6789
measwt        1        0.98982        0.04260      23.24      <.0001
female        1       39.96412        3.92932      10.17      <.0001
measwt_f      1       -0.72536        0.05598     -12.96      <.0001

The UNIVARIATE Procedure
Variable:  lev  (Leverage)

                            Moments

N                         200    Sum Weights                200
Mean                0.0212232    Sum Observations     4.2446399
Std Deviation       0.0514178    Variance            0.00264379
Skewness           12.5535875    Kurtosis             168.15714
Uncorrected SS     0.61619913    Corrected SS        0.52611429
Coeff Variation    242.271682    Std Error Mean      0.00363579

              Basic Statistical Measures

    Location                    Variability

Mean     0.021223     Std Deviation            0.05142
Median   0.013143     Variance                 0.00264
Mode     0.010224     Range                    0.70428
                      Interquartile Range      0.00754

NOTE: The mode displayed is the smallest of 3 modes with a count of 8.

           Tests for Location: Mu0=0

Test           -Statistic-    -----p Value------

Student's t    t  5.837304    Pr > |t|    <.0001
Sign           M       100    Pr >= |M|   <.0001
Signed Rank    S     10050    Pr >= |S|   <.0001

Quantiles (Definition 5)

Quantile         Estimate

100% Max       0.71418565
99%            0.12002413
95%            0.04561218
90%            0.02856951
75% Q3         0.01856466
50% Median     0.01314321
25% Q1         0.01102743
10%            0.01014961
5%             0.00993016
1%             0.00990671
0% Min         0.00990671


The UNIVARIATE Procedure
Variable:  lev  (Leverage)

              Extreme Observations

-------Lowest-------        ------Highest------

      Value      Obs             Value      Obs

 0.00990671      188         0.0645111       30
 0.00990671      159         0.0687759       54
 0.00990671       28         0.0732077       97
 0.00990671        2         0.1668405       21
 0.00993016      193         0.7141856       12
Obs  subject sex measwt measht reptwt reptht measwt_f female    pr     lev
 12    12    F    166    57     56     163     166      1   85.2230 0.71419
With the error corrected:
proc reg data=davis_co;
  model measwt=reptwt female measwt_f;
  output out=dvs_coH p=pm h=lev;
run;
quit;
proc univariate data=dvs_coH;
  var lev;
run;

The REG Procedure
Model: MODEL1
Dependent Variable: measwt

                             Analysis of Variance

                                    Sum of           Mean
Source                   DF        Squares         Square    F Value    Pr > F

Model                     3          31777          10592    2220.97    <.0001
Error                   179      853.69481        4.76924
Corrected Total         182          32631


Root MSE              2.18386    R-Square     0.9738
Dependent Mean       65.62842    Adj R-Sq     0.9734
Coeff Var             3.32761

                        Parameter Estimates

                     Parameter       Standard
Variable     DF       Estimate          Error    t Value    Pr > |t|

Intercept     1        4.14385        1.50728       2.75      0.0066
reptwt        1        0.93823        0.01943      48.28      <.0001
female        1       -7.27862        2.32718      -3.13      0.0021
measwt_f      1        0.12450        0.03650       3.41      0.0008

The UNIVARIATE Procedure
Variable:  lev  (Leverage)

                            Moments

N                         183    Sum Weights                183
Mean               0.02185792    Sum Observations             4
Std Deviation       0.0193944    Variance            0.00037614
Skewness           4.83073039    Kurtosis            33.3623499
Uncorrected SS     0.15588965    Corrected SS        0.06845796
Coeff Variation     88.729365    Std Error Mean      0.00143368

              Basic Statistical Measures

    Location                    Variability

Mean     0.021858     Std Deviation            0.01939
Median   0.015604     Variance               0.0003761
Mode     0.015604     Range                    0.18047
                      Interquartile Range      0.00864

           Tests for Location: Mu0=0

Test           -Statistic-    -----p Value------

Student's t    t  15.24608    Pr > |t|    <.0001
Sign           M      91.5    Pr >= |M|   <.0001
Signed Rank    S      8418    Pr >= |S|   <.0001

Quantiles (Definition 5)

Quantile         Estimate

100% Max       0.19040469
99%            0.10076897
95%            0.04995763
90%            0.03947617
75% Q3         0.02102730
50% Median     0.01560388
25% Q1         0.01238808
10%            0.01075212
5%             0.01037395
1%             0.00993415
0% Min         0.00993415

The UNIVARIATE Procedure
Variable:  lev  (Leverage)

              Extreme Observations

-------Lowest-------        ------Highest------

      Value      Obs             Value      Obs

 0.00993415      160         0.0799200       29
 0.00993415       90         0.0846260      115
 0.00993415       12         0.0855655       54
 0.01008300      151         0.1007690       64
 0.01009729      108         0.1904047       21

               Missing Values

                       -----Percent Of-----
Missing                             Missing
  Value       Count     All Obs         Obs

      .          17        8.50      100.00
Section 11.3
Page 274, middle of page. Make studentized residual and show largest value.
proc reg data=davisIn;
  model reptwt = measwt female measwt_f;
  output out=dvsRs rstudent=rs; /*studentized residuals*/
run;
quit;
proc univariate data=dvsRs;
  var rs;
run;
proc print data=dvsRs;
  where  rs < -24.3 AND rs ne .;
run;

The REG Procedure
Model: MODEL1
Dependent Variable: reptwt

                             Analysis of Variance

                                 Sum of           Mean
Source                DF        Squares         Square    F Value    Pr > F

Model                  3          30655          10218     470.41    <.0001
Error                179     3888.25423       21.72209
Corrected Total      182          34543

Root MSE              4.66070    R-Square     0.8874
Dependent Mean       65.62295    Adj R-Sq     0.8856
Coeff Var             7.10224

                        Parameter Estimates

                     Parameter       Standard
Variable     DF       Estimate          Error    t Value    Pr > |t|

Intercept     1        1.35864        3.27719       0.41      0.6789
measwt        1        0.98982        0.04260      23.24      <.0001
female        1       39.96412        3.92932      10.17      <.0001
measwt_f      1       -0.72536        0.05598     -12.96      <.0001

The UNIVARIATE Procedure
Variable:  rs  (Studentized Residual without Current Obs)

                            Moments

N                         183    Sum Weights                183
Mean               -0.0961781    Sum Observations     -17.60059
Std Deviation      2.00831794    Variance            4.03334093
Skewness            -9.637042    Kurtosis            117.053571
Uncorrected SS      735.76084    Corrected SS        734.068049
Coeff Variation    -2088.1242    Std Error Mean      0.14845913

              Basic Statistical Measures

    Location                    Variability

Mean     -0.09618     Std Deviation            2.00832
Median   -0.02849     Variance                 4.03334
Mode     -0.18673     Range                   27.80109
                      Interquartile Range      0.95002

           Tests for Location: Mu0=0

Test           -Statistic-    -----p Value------

Student's t    t  -0.64784    Pr > |t|    0.5179
Sign           M      -2.5    Pr >= |M|   0.7676
Signed Rank    S      -188    Pr >= |S|   0.7941

Quantiles (Definition 5)

Quantile         Estimate

100% Max        3.4966276
99%             3.0813780
95%             1.5666415
90%             1.0406940
75% Q3          0.4462518
50% Median     -0.0284926
25% Q1         -0.5037653
10%            -0.9816218
5%             -1.4664439
1%             -2.3493765
0% Min        -24.3044630

The UNIVARIATE Procedure
Variable:  rs  (Studentized Residual without Current Obs)

            Extreme Observations

------Lowest------        -----Highest-----

    Value      Obs           Value      Obs

-24.30446       12         1.89365      129
 -2.34938       29         2.39320       31
 -2.18985      155         2.90657       64
 -1.95943      130         3.08138       50
 -1.90865      153         3.49663      115

               Missing Values

                       -----Percent Of-----
Missing                             Missing
  Value       Count     All Obs         Obs

      .          17        8.50      100.00
Obs subject  sex  measwt  measht  reptwt  reptht  measwt_f  female   rs

 12    12     F     166     57      56      163      166       1   -24.3045
Section 11.4
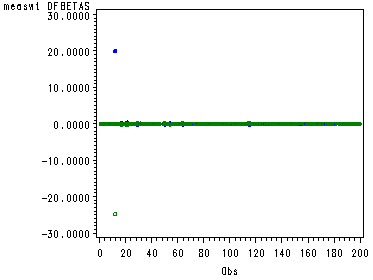
Middle of page 276, computing DFBETA for measwt, female and measwt_f. In our regression procedure, we use the option influence and use the ODS facilities to output a dataset that contains all the DFBETAS. The index plot shows an observation influencing female and influencing female*measwt.
proc reg data=davisIn;
  model reptwt=measwt female measwt_f/influence ;
  ods output OutputStatistics=dvsOut;
run;
quit;
filename outfiles 'https://stats.idre.ucla.edu/wp-content/uploads/2016/02/chp11dfbeta.gif';
goptions gsfname=outfiles dev=gif373;
symbol1 c=black i=none v=star h=0.5;
symbol2 c=blue  i=none v=dot h=0.5;
symbol3 c=green i=none v=circle h=0.5;
proc gplot data=dvsOut;
  plot (DFB_measwt)*observation=1
  (DFB_female)*observation=2
  (DFB_measwt_f)*observation=3/overlay;
run;
quit;

The REG Procedure
Model: MODEL1
Dependent Variable: reptwt

                             Analysis of Variance

                                    Sum of           Mean
Source                   DF        Squares         Square    F Value    Pr > F

Model                     3          30655          10218     470.41    <.0001
Error                   179     3888.25423       21.72209
Corrected Total         182          34543


Root MSE              4.66070    R-Square     0.8874
Dependent Mean       65.62295    Adj R-Sq     0.8856
Coeff Var             7.10224

                        Parameter Estimates

                     Parameter       Standard
Variable     DF       Estimate          Error    t Value    Pr > |t|

Intercept     1        1.35864        3.27719       0.41      0.6789
measwt        1        0.98982        0.04260      23.24      <.0001
female        1       39.96412        3.92932      10.17      <.0001
measwt_f      1       -0.72536        0.05598     -12.96      <.0001

The REG Procedure
Model: MODEL1
Dependent Variable: reptwt

                                    Output Statistics
                         Hat Diag      Cov          ---------------DFBETAS--------------
 Obs  Residual  RStudent        H    Ratio   DFFITS Intercept   measwt   female measwt_f
   1   -0.5749   -0.1238   0.0123   1.0350  -0.0138   -0.0010  -0.0012   0.0008   0.0009
   2   -5.6614   -1.2225   0.0099   0.9989  -0.1223   -0.0000   0.0000  -0.0160   0.0019
   3   -1.3391   -0.2883   0.0116   1.0327  -0.0312   -0.0000   0.0000  -0.0099   0.0078
  :	:	:	  :	   :	    :	      :        :        :        :
 196   -3.6055   -0.7776   0.0125   1.0217  -0.0876   -0.0275   0.0141   0.0230  -0.0108
 197   -3.5139   -0.7593   0.0163   1.0263  -0.0978    0.0353  -0.0492  -0.0294   0.0374
 198         .         .   0.0143    .        .         .        .        .        .
 199    0.5574    0.1210   0.0286   1.0525   0.0208   -0.0134   0.0157   0.0112  -0.0120
 200    1.4454    0.3114   0.0130   1.0338   0.0357   -0.0031   0.0087   0.0026  -0.0066


Sum of Residuals                           0
Sum of Squared Residuals          3888.25423
Predicted Residual SS (PRESS)          13623
The following segment illustrates the facility of SAS INSIGHT for scatterplot matrix from the command line. To some people it may be easier to do it from the SAS pulldown menus (e.g., click on Solutions then Analysis then Interactive Data Analysis).
proc insight data=dvsOut;
  scatter DFB_measwt DFB_female DFB_measwt_f observation*
          DFB_measwt DFB_female DFB_measwt_f observation;
run;
quit;
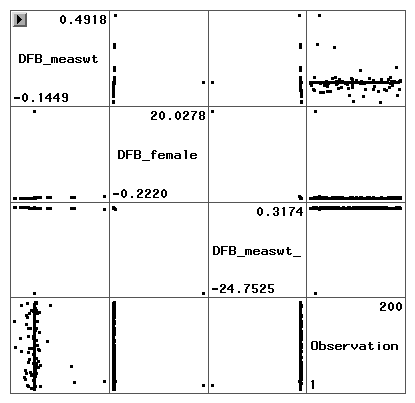
Bottom part of page 277, computing and showing Cook's D, DFFITS, DFBETAS.
Compute Cook's D and FFITS:
proc reg data=davisIn;
  model reptwt=measwt female measwt_f;
  output out=dvsSum cookd=ck;
run;
quit;
proc univariate data=dvsSum;
  var ck;
run;
proc univariate data=dvsOut;
  var  dffits DFB_measwt DFB_female DFB_measwt_f;
run;
proc print data=dvsSum;
where subject=12;
var ck;
run;
proc print data=dvsOut;
  where observation=12;
  var dffits DFB_measwt DFB_female DFB_measwt_f;
quit;

The REG Procedure
Model: MODEL1
Dependent Variable: reptwt

                             Analysis of Variance

                                    Sum of           Mean
Source                   DF        Squares         Square    F Value    Pr > F

Model                     3          30655          10218     470.41    <.0001
Error                   179     3888.25423       21.72209
Corrected Total         182          34543


Root MSE              4.66070    R-Square     0.8874
Dependent Mean       65.62295    Adj R-Sq     0.8856
Coeff Var             7.10224

                        Parameter Estimates

                     Parameter       Standard
Variable     DF       Estimate          Error    t Value    Pr > |t|

Intercept     1        1.35864        3.27719       0.41      0.6789
measwt        1        0.98982        0.04260      23.24      <.0001
female        1       39.96412        3.92932      10.17      <.0001
measwt_f      1       -0.72536        0.05598     -12.96      <.0001

The UNIVARIATE Procedure
Variable:  ck  (Cook's D Influence Statistic)

                            Moments

N                         183    Sum Weights                183
Mean               0.47387729    Sum Observations    86.7195445
Std Deviation      6.35162098    Variance             40.343089
Skewness           13.5276811    Kurtosis            182.998763
Uncorrected SS     7383.53663    Corrected SS        7342.44221
Coeff Variation    1340.35141    Std Error Mean      0.46952533

              Basic Statistical Measures

    Location                    Variability

Mean     0.473877     Std Deviation            6.35162
Median   0.000796     Variance                40.34309
Mode     0.000094     Range                   85.92734
                      Interquartile Range      0.00309

           Tests for Location: Mu0=0

Test           -Statistic-    -----p Value------

Student's t    t  1.009269    Pr > |t|    0.3142
Sign           M      91.5    Pr >= |M|   <.0001
Signed Rank    S      8418    Pr >= |S|   <.0001

Quantiles (Definition 5)

Quantile          Estimate

100% Max       8.59273E+01
99%            8.56294E-02
95%            1.99879E-02
90%            9.60576E-03
75% Q3         3.21741E-03
50% Median     7.96056E-04
25% Q1         1.24424E-04
10%            2.60263E-05
5%             2.28352E-05
1%             2.10827E-06
0% Min         2.10827E-06

The UNIVARIATE Procedure
Variable:  ck  (Cook's D Influence Statistic)

               Extreme Observations

--------Lowest-------        -------Highest------

       Value      Obs              Value      Obs

 2.10827E-06      186          0.0624604       50
 2.10827E-06       92          0.0651360       21
 2.10827E-06       85          0.0701759       64
 1.57302E-05      143          0.0856294      115
 1.85113E-05      160         85.9273459       12

               Missing Values

                       -----Percent Of-----
Missing                             Missing
  Value       Count     All Obs         Obs

      .          17        8.50      100.00

The UNIVARIATE Procedure
Variable:  DFFITS

                            Moments

N                         183    Sum Weights                183
Mean               -0.2012365    Sum Observations    -36.826272
Std Deviation      2.84379473    Variance            8.08716846
Skewness           -13.482793    Kurtosis            182.187495
Uncorrected SS     1479.27545    Corrected SS        1471.86466
Coeff Variation    -1413.1608    Std Error Mean      0.21021936

              Basic Statistical Measures

    Location                    Variability

Mean     -0.20124     Std Deviation            2.84379
Median   -0.00290     Variance                 8.08717
Mode     -0.01930     Range                   39.02263
                      Interquartile Range      0.11521

           Tests for Location: Mu0=0

Test           -Statistic-    -----p Value------

Student's t    t  -0.95727    Pr > |t|    0.3397
Sign           M      -2.5    Pr >= |M|   0.7676
Signed Rank    S      -149    Pr >= |S|   0.8362

Quantiles (Definition 5)

Quantile          Estimate

100% Max        0.60332360
99%             0.54072498
95%             0.21210692
90%             0.13627407
75% Q3          0.05600517
50% Median     -0.00289586
25% Q1         -0.05920213
10%            -0.11742211
5%             -0.19584990
1%             -0.43084786
0% Min        -38.41931120

UNIVARIATE Procedure
Variable:  DFFITS

             Extreme Observations

-------Lowest------        ------Highest-----

     Value      Obs            Value      Obs

-38.419311       12         0.351835       17
 -0.430848       29         0.510867       21
 -0.296132      130         0.511565       50
 -0.282346      155         0.540725       64
 -0.260521      128         0.603324      115

               Missing Values

                       -----Percent Of-----
Missing                             Missing
  Value       Count     All Obs         Obs

      .          17        8.50      100.00

The UNIVARIATE Procedure
Variable:  DFB_measwt  (measwt DFBETAS)

                            Moments

N                         183    Sum Weights                183
Mean               0.00039965    Sum Observations    0.07313633
Std Deviation      0.05401908    Variance            0.00291806
Skewness           5.26547487    Kurtosis            43.7449484
Uncorrected SS     0.53111634    Corrected SS        0.53108711
Coeff Variation    13516.5265    Std Error Mean      0.00399321

              Basic Statistical Measures

    Location                    Variability

Mean     0.000400     Std Deviation            0.05402
Median   0.000000     Variance                 0.00292
Mode     0.000000     Range                    0.63678
                      Interquartile Range    0.0000766

           Tests for Location: Mu0=0

Test           -Statistic-    -----p Value------

Student's t    t  0.100083    Pr > |t|    0.9204
Sign           M      19.5    Pr >= |M|   0.0048
Signed Rank    S       715    Pr >= |S|   0.3204

Quantiles (Definition 5)

Quantile          Estimate

100% Max       4.91842E-01
99%            2.80931E-01
95%            3.14289E-02
90%            1.41305E-02
75% Q3         6.86667E-16
50% Median     3.14532E-17
25% Q1        -7.65658E-05
10%           -4.27876E-02
5%            -5.94060E-02
1%            -1.31842E-01
0% Min        -1.44941E-01

The UNIVARIATE Procedure
Variable:  DFB_measwt  (measwt DFBETAS)

             Extreme Observations

-------Lowest------        ------Highest------

     Value      Obs             Value      Obs

-0.1449406      156         0.0881442      111
-0.1318417       97         0.1096412      191
-0.0978029      118         0.2565254       54
-0.0921938       87         0.2809306       17
-0.0904702      192         0.4918421       21

               Missing Values

                       -----Percent Of-----
Missing                             Missing
  Value       Count     All Obs         Obs

      .          17        8.50      100.00

The UNIVARIATE Procedure
Variable:  DFB_female  (female DFBETAS)

                            Moments

N                         183    Sum Weights                183
Mean               0.09419919    Sum Observations    17.2384525
Std Deviation      1.48275408    Variance            2.19855965
Skewness           13.4966624    Kurtosis            182.435032
Uncorrected SS     401.761705    Corrected SS        400.137857
Coeff Variation    1574.06238    Std Error Mean      0.10960834

              Basic Statistical Measures

    Location                    Variability

Mean      0.09420     Std Deviation            1.48275
Median   -0.00501     Variance                 2.19856
Mode     -0.00481     Range                   20.24974
                      Interquartile Range      0.03337

           Tests for Location: Mu0=0

Test           -Statistic-    -----p Value------

Student's t    t  0.859416    Pr > |t|    0.3912
Sign           M     -32.5    Pr >= |M|   <.0001
Signed Rank    S     -3776    Pr >= |S|   <.0001

Quantiles (Definition 5)

Quantile          Estimate

100% Max       20.02775272
99%             0.38703149
95%             0.03421111
90%             0.01663061
75% Q3          0.00396153
50% Median     -0.00500628
25% Q1         -0.02941105
10%            -0.06352601
5%             -0.11406227
1%             -0.22172649
0% Min         -0.22199219

The UNIVARIATE Procedure
Variable:  DFB_female  (female DFBETAS)

             Extreme Observations

------Lowest------        -------Highest------

    Value      Obs              Value      Obs

-0.221992      115          0.0758795      191
-0.221726       29          0.1956965       54
-0.209797       64          0.2036534       17
-0.182301       50          0.3870315       21
-0.142343      130         20.0277527       12

               Missing Values

                       -----Percent Of-----
Missing                             Missing
  Value       Count     All Obs         Obs

      .          17        8.50      100.00

The UNIVARIATE Procedure
Variable:  DFB_measwt_f  (measwt_f DFBETAS)

                            Moments

N                         183    Sum Weights                183
Mean               -0.1163372    Sum Observations     -21.28971
Std Deviation      1.83226898    Variance            3.35720963
Skewness           -13.503022    Kurtosis            182.551683
Uncorrected SS     613.488939    Corrected SS        611.012153
Coeff Variation    -1574.9638    Std Error Mean      0.13544522

              Basic Statistical Measures

    Location                    Variability

Mean     -0.11634     Std Deviation            1.83227
Median    0.00546     Variance                 3.35721
Mode      0.00314     Range                   25.06990
                      Interquartile Range      0.03505

           Tests for Location: Mu0=0

Test           -Statistic-    -----p Value------

Student's t    t  -0.85892    Pr > |t|    0.3915
Sign           M      40.5    Pr >= |M|   <.0001
Signed Rank    S      4418    Pr >= |S|   <.0001

Quantiles (Definition 5)

Quantile          Estimate

100% Max        0.31740249
99%             0.29435380
95%             0.11029567
90%             0.07015686
75% Q3          0.03286291
50% Median      0.00546108
25% Q1         -0.00218745
10%            -0.01330578
5%             -0.02563021
1%             -0.37427787
0% Min        -24.75250165

The UNIVARIATE Procedure
Variable:  DFB_measwt_f  (measwt_f DFBETAS)

             Extreme Observations

-------Lowest-------        ------Highest-----

      Value      Obs            Value      Obs

-24.7525017       12         0.155113       31
 -0.3742779       21         0.233150       29
 -0.2137802       17         0.263616       50
 -0.1952085       54         0.294354       64
 -0.0834338      191         0.317402      115

               Missing Values

                       -----Percent Of-----
Missing                             Missing
  Value       Count     All Obs         Obs

      .          17        8.50      100.00
Obs       ck(Cook's D)

 12       85.9273
                       DFB_        DFB_      DFB_
Obs      DFFITS      measwt      female    measwt_f

 12    -38.4193     -0.0000     20.0278    -24.7525
Top of page 279, computing COVRATIO. Dataset dvsOut already contains it. We summarize it with proc univariate.
proc univariate data=dvsOut;
  var covratio;
run;
proc print data=dvsOut;
  where covratio<0.02 and covratio ge 0;
run;
quit;

The UNIVARIATE Procedure
Variable:  CovRatio  (Cov Ratio)

                            Moments

N                         183    Sum Weights                183
Mean               1.01845274    Sum Observations    186.376851
Std Deviation      0.08330185    Variance             0.0069392
Skewness           -9.9649448    Kurtosis            119.302488
Uncorrected SS     191.078948    Corrected SS        1.26293396
Coeff Variation    8.17925499    Std Error Mean      0.00615785

              Basic Statistical Measures

    Location                    Variability

Mean     1.018453     Std Deviation            0.08330
Median   1.030849     Variance                 0.00694
Mode     1.032772     Range                    1.18186
                      Interquartile Range      0.01719

           Tests for Location: Mu0=0

Test           -Statistic-    -----p Value------

Student's t    t   165.391    Pr > |t|    <.0001
Sign           M      91.5    Pr >= |M|   <.0001
Signed Rank    S      8418    Pr >= |S|   <.0001

Quantiles (Definition 5)

Quantile        Estimate

100% Max       1.1921500
99%            1.0969195
95%            1.0674884
90%            1.0458427
75% Q3         1.0370553
50% Median     1.0308486
25% Q1         1.0198622
10%            0.9867116
5%             0.9600152
1%             0.8073648
0% Min         0.0102869

The UNIVARIATE Procedure
Variable:  CovRatio  (Cov Ratio)

            Extreme Observations

-------Lowest------        -----Highest-----

     Value      Obs           Value      Obs

 0.0102869       12         1.07503       65
 0.8073648      115         1.07525       82
 0.8536158       50         1.09106       30
 0.8789338       64         1.09692       97
 0.9190747       31         1.19215       21

               Missing Values

                       -----Percent Of-----
Missing                             Missing
  Value       Count     All Obs         Obs

      .          17        8.50      100.00
                                      Hat
Obs       Residual     RStudent    Diagonal
 12       -29.2230     -24.3045      0.7142

Obs    CovRatio      DFFITS
 12      0.0103    -38.4193
Section 11.6
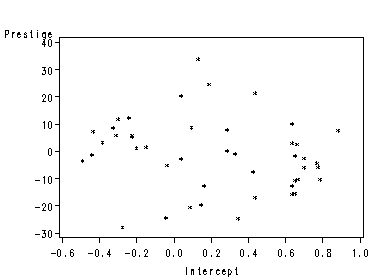
Page 283 bottom, and figure 11.5 page 284, partial regression plots using data file duncan. We construct a partial regression plot for intercept based on the second footnote on page 283.
data duncan1; /* to create a constant regressor */
  set duncan;
  Int=1;
proc reg data=duncan1 noprint;
  model prestige Int= income educ / noint; /* the option of no intercept*/
  output out=temp r=ry rx;
run;
filename outfiles 'https://stats.idre.ucla.edu/wp-content/uploads/2016/02/chp11pInt.gif';
goptions gsfname=outfiles dev=gif373;
proc gplot data=temp;
  plot ry*rx /hminor=0 vminor=0;
  label ry='Prestige'
  rx='Intercept';
run;
Following program produces Figure 11.5.on page 284.
filename outfiles 'https://stats.idre.ucla.edu/wp-content/uploads/2016/02/chp11pInc.gif';
goptions gsfname=outfiles dev=gif373;
proc reg data=duncan;
  model prestige income=educ;
  output out=dnEd  r=prst inc;
run;
proc reg data=dnEd;
  model prst=inc;
  plot prst*inc /haxis=(-50 to 75 by 25) vaxis=(-50 to 100 by 50) nomodel nostat;
  label prst='Prestige';
  label inc='Income';
run;
quit;
filename outfiles 'https://stats.idre.ucla.edu/wp-content/uploads/2016/02/chp11ped.gif';
goptions gsfname=outfiles dev=gif373;
proc reg data=duncan;
  model prestige educ=income;
  output out=dcInc r=prst ed;
run;
proc reg data=dcInc;
  model prst=ed;
  plot prst*ed / haxis=(-75 to 50 by 25) vaxis=(-50 to 100 by 50) nomodel nostat;
  label prst='Prestige';
  label ed='Education';
run;
quit;
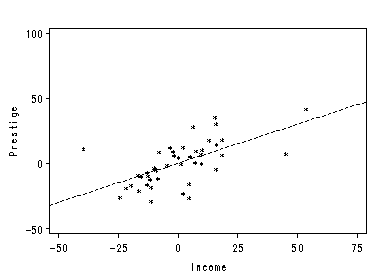
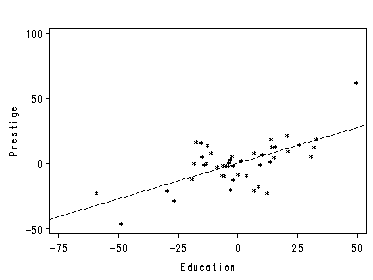
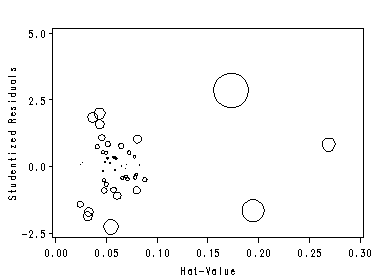
Figure 11.6. Bubble plot.
filename outfiles 'https://stats.idre.ucla.edu/wp-content/uploads/2016/02/chp11bbl.gif';
goptions gsfname=outfiles dev=gif373;
proc reg data=duncan;
  model prestige=income educ;
  output out=dncnOut cookd=ck h=lev student=rs;
run;
quit;
axis1 order=(0 to 0.3 by 0.05);
axis2 order=(-2.5 to 5 by 2.5) label=(r=0 a=90);
proc gplot data=dncnOut;
  bubble rs*lev=ck /haxis=axis1 vaxis=axis2  bsize=10 hminor=0 vminor=0;
  label rs='Studentized Residuals';
  label lev='Hat-Value';
run;
quit;

