Section 12.1 Nonnormally Distributed Errors
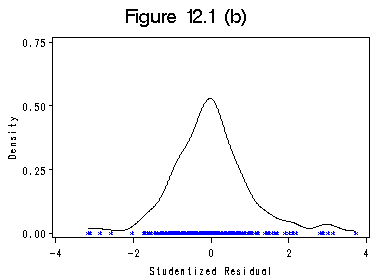
Figure 12.1 (a) and (b) on page 297 and using data file ornstein.
data ornstein_co; /*Dummy coding: baseline is 'CAN' for nation and 'MAN' for sector*/ set ornstein; asset1 = sqrt(assets); inlcks = sqrt(intrlcks+1); Array n(3); do i =1 to 3; n(i)=0; end; Array sec(9); do i = 1 to 9; sec(i)=0; end; drop i; if (nation='OTH') then n1=1; if (nation='UK') then n2=1; if (nation='US') then n3=1; if (sector='BNK') then sec1=1; if (sector='CON') then sec2=1; if (sector='FIN') then sec3=1; if (sector='HLD') then sec4=1; if (sector='AGR') then sec5=1; if (sector='MER') then sec6=1; if (sector='MIN') then sec7=1; if (sector='TRN') then sec8=1; if (sector='WOD') then sec9=1; run; proc reg data=ornstein_co;/*model for the first graph*/ model intrlcks = asset1 sec1-sec9 n1-n3; output out=rstq1 rstudent=rstd p=prd; run; quit; symbol1 c=black v=star h=0.5; title 'Figure 12.1 (a)'; proc univariate data=rstq1;/*Figure 12.1*/ var rstd; qqplot /normal (mu=est sigma=est color=blue w=1.5 ); label rstd='Studentized Residual'; run;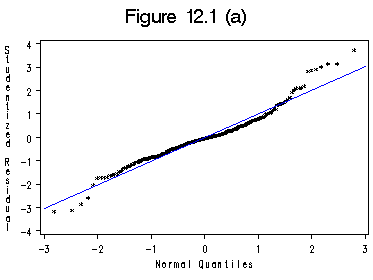
proc kde data=rstq1 out=kdeorn; /*create density distribution*/ var rstd; run; data kdeorn1; set kdeorn; if count ne 0 then mycount=0.00001;/*dummy for one-way plot*/ output; run; proc sort data=kdeorn1; by rstd; run; title 'Figure 12.1 (b)'; symbol1 c=black i=join v=none h=0.8; symbol2 c= blue i =none v=star h=0.5; axis1 order= (-4 to 4 by 2); axis2 order =(0 to 0.75 by 0.25) label=(r=0 a=90); proc gplot data=kdeorn1 ; plot density*rstd=1 mycount*rstd=2/overlay haxis=axis1 vaxis=axis2 hminor=0 vminor=0; label density='Density'; label rstd='Studentized Residual'; run; quit;
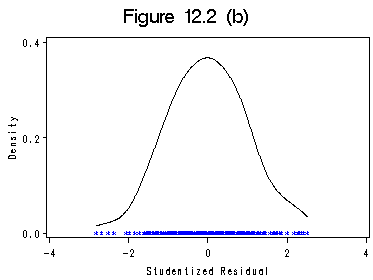
proc reg data=ornstein_co;/*second model*/ model inlcks= asset1 sec1-sec9 n1-n3; output out=rstq2 rstudent=rstd p=prd; run; quit; symbol1 c=black v=star h=0.5; title 'Figure 12.2 (a)'; proc univariate data=rstq2;/*Figure 12.1 (a)*/ var rstd; qqplot /normal (mu=est sigma=est color=blue w=1.5 ); label rstd='Studentized Residual'; run;proc kde data=rstq2 out=kdeorn2; /*create density distribution*/ var rstd; run; quit; data kdeorn3; set kdeorn2; if count ne 0 then mycount=0.00001; output; run; proc sort data=kdeorn3; by rstd; run; title 'Figure 12.2 (b)'; symbol1 c=black i=join v=none l=0.2; symbol2 c= blue i =none h=0.5;; axis1 order= (-4 to 4 by 2); axis2 order =(0 to 0.4 by 0.2) label=(r=0 a=90); proc gplot data=kdeorn3; plot density*rstd=1 mycount*rstd=2/overlay haxis=axis1 vaxis=axis2 hminor=0 vminor=0; label density='Density'; label rstd='Studentized Residual'; run; quit;
Table 12.1 can be obtained from the regression run above.
The REG Procedure
Model: MODEL1
Dependent Variable: intrlcks
(Omit Analysis of Variance)
                        Parameter Estimates

                     Parameter       Standard
Variable     DF       Estimate          Error    t Value    Pr > |t|
Intercept     1        4.19045        1.84604       2.27      0.0241
asset1        1        0.25179        0.01852      13.59      <.0001
sec1          1      -14.37594        5.57699      -2.58      0.0106
sec2          1       -5.12563        4.69878      -1.09      0.2765
sec3          1       -5.69851        2.92571      -1.95      0.0526
sec4          1       -2.43024        4.01411      -0.61      0.5455
sec5          1       -1.19954        2.04038      -0.59      0.5572
sec6          1       -0.86685        2.63433      -0.33      0.7424
sec7          1        0.34228        2.01210       0.17      0.8651
sec8          1       -0.38104        2.81974      -0.14      0.8926
sec9          1        5.15130        2.68208       1.92      0.0560
n1            1       -1.15891        2.66400      -0.44      0.6639
n2            1       -4.44401        2.64928      -1.68      0.0948
n3            1       -8.08905        1.48100      -5.46      <.0001

The REG Procedure
Model: MODEL1
Dependent Variable: inlcks

(Omit Analysis of Variance)

                        Parameter Estimates

                     Parameter       Standard
Variable     DF       Estimate          Error    t Value    Pr > |t|
Intercept     1        2.32931        0.23087      10.09      <.0001
asset1        1        0.02601        0.00232      11.23      <.0001
sec1          1       -2.25076        0.69749      -3.23      0.0014
sec2          1       -0.73997        0.58765      -1.26      0.2092
sec3          1       -0.08804        0.36590      -0.24      0.8101
sec4          1       -0.24532        0.50202      -0.49      0.6255
sec5          1       -0.05672        0.25518      -0.22      0.8243
sec6          1        0.14791        0.32946       0.45      0.6539
sec7          1        0.35620        0.25164       1.42      0.1582
sec8          1        0.35401        0.35265       1.00      0.3165
sec9          1        0.78604        0.33543       2.34      0.0200
n1            1       -0.11396        0.33317      -0.34      0.7326
n2            1       -0.52660        0.33133      -1.59      0.1133
n3            1       -1.10511        0.18522      -5.97      <.0001
Section 12.2 Nonconstant Error Variance
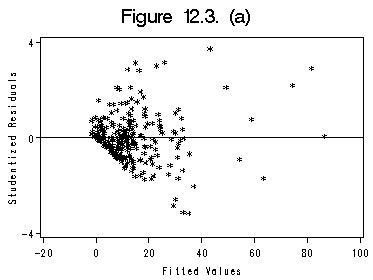
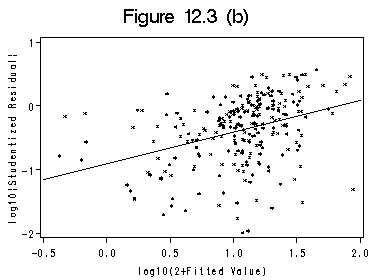
Continuation on data file ornstein from previous section. Figure 12.3 (a) and (b) on page 303.
data fitted;
  set rstq1;
  newfit= log10(2+prd);
  rstlog=log10(abs(rstd));
  run;
symbol c=black i=none v=star h=0.8;
axis1 order=(-20 to 100 by 20);
axis2 order=(-4 to 4 by 4)label=(r=0 a=90);
title 'Figure 12.3. (a)';
proc gplot data=rstq1;
  plot rstd*prd /haxis=axis1 vaxis=axis2 vminor=0 hminor=0 vref=0 ;
  label prd='Fitted Values';
  label rstd='Studentized Residuals';
run;
quit;
title 'Figure 12.3 (b)';
symbol interpol=r value = star h=0.4 cv=black width=1;
axis1 order =(-0.5 to 2 by .5);
axis2 order =(-2 to 1 by 1) label=(r=0 a=90);
proc gplot data=fitted;
  plot rstlog*newfit /haxis=axis1 vaxis=axis2 hminor=0 vminor=0;
  label newfit='log10(2+Fitted Value)';
  label rstlog='log10|Studentized Residual|';
  run;
quit;
data fitted1;
  set rstq2;
  logfit=log10(prd);
  logr=log10(abs(rstd));
  run;
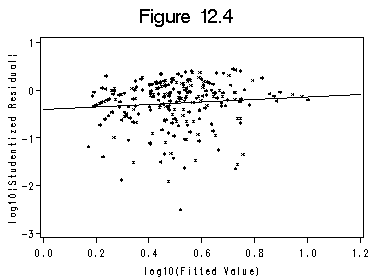
title 'Figure 12.4';
symbol interpol=r value = star h=0.4 cv=black width=1;
axis1 order =(0 to 1.2 by .2);
axis2 order =(-3 to 1 by 1) label=(r=0 a=90);
proc gplot data=fitted1;
  plot logr*logfit /vminor=0 hminor=0 haxis=axis1 vaxis=axis2;
  label logfit='log10(Fitted Value)';
  label logr='log10|Studentized Residual|';
  run;
quit;
Section 12.3 Nonlinearity
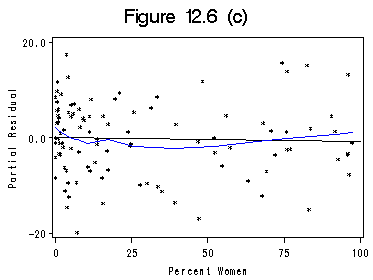
Figure 12.6 using data file prestige. Option partial in proc reg produces the partial residual plots in line-printer format. Here we show the steps to produce high-resolution partial residual plots.
proc reg data=prestige; model prestige=educat income percwomn; output out=partial r=r; run; quit; data mypar; set partial; redu = r+4.18664*educat; /*coefficient from previous procedure*/ rinc = r+0.00131*income; /*coefficient from previous procedure*/ rper = r-0.00891*percwomn; /*coefficient from previous procedure*/ Obs=_n_; run; proc loess data=mypar;/*get the smoothing curve*/ model redu=educat/smooth=0.5; ods output OutputStatistics=stat1; run; quit; data comedu; merge stat1 mypar ; by Obs; run; proc sort data=comedu; by educat; run; title 'Figure 12.6 (a)'; axis1 order =(5 to 17.5 by 2.5); axis2 order =(0 to 100 by 25) label=(r=0 a=90); symbol1 color=black i=r v=star h=0.5; symbol2 color=blue i=join v=none; proc gplot data=comedu; format educat 4.1; plot redu*educat=1 Pred*educat=2/ haxis=axis1 vaxis=axis2 vminor=0 hminor=0 overlay; label educat='Eucation'; label redu='Partial Residual'; run; quit;proc loess data=mypar; model rinc = income /smooth=0.5; ods output OutputStatistics=stat2; run; quit; data cominc; merge stat2 mypar ; by Obs; run; proc sort data=cominc; by income; run; title 'Figure 12.6 (b)'; axis1 order=(0 to 30000 by 10000); axis2 order=(-25 to 50 by 25) label=(r=0 a=90); proc gplot data=cominc; format rinc 4.1; format Pred 4.1; plot rinc*income =1 Pred*income=2 / overlay haxis=axis1 vaxis=axis2 vminor=0 hminor=0; label income='Income'; label rinc='Partial Residual'; run; quit;
proc loess data=mypar; model rper = percwomn /smooth=0.5; ods output OutputStatistics=stat3; run; quit; data comper; merge stat3 mypar ; by Obs; run; proc sort data=comper; by percwomn; run; title 'Figure 12.6 (c)'; axis1 order =(0 to 100 by 25); axis2 order =(-20 to 20 by 20) label=(r=0 a=90); proc gplot data=comper; format rper 4.1 Pred 4.1 percwomn 4.0; plot rper*percwomn=1 Pred*percwomn=2/ overlay haxis=axis1 vaxis=axis2 vminor=0 hminor=0; label percwomn='Percent Women'; label rper='Partial Residual'; run; quit;
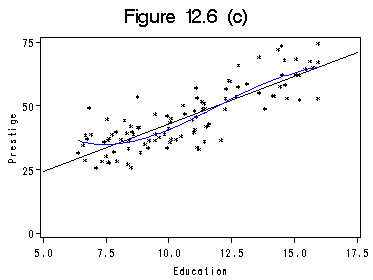
Calculation on page 303 and Figure 12.7 on page 304.
data prestige1;
  set prestige;
  inc2 = log2(income);
  edu2 = educat*educat;
  edu3 = edu2*educat;
  percwomn2=percwomn*percwomn;
  run;
proc reg data=prestige1;/*Formula in the middle of page 313.*/
  model prestige = inc2 educat edu2 edu3 percwomn percwomn2;
  output out=prst_par r=r;
  run;
quit;
data manually;
  set prst_par;
  prd=20.8 + 8.78*log2(6798)-0.179*29+0.0025*29*29-29.9*educat+2.91*edu2-0.0808*edu3;
  par = r+prd;
  run;
proc sort data=manually;
  by educat;
run;
axis1 order=(5 to 17.5 by 2.5);
axis2 order =(0 to 75 by 25)label =(r=0 a=90);
proc gplot data=manually;
  plot par*educat=1 prd*educat=2/overlay haxis=axis1 vaxis=axis2 vminor=0 hminor=0;
  label educat='Education';
  label par='Prestige';
  run;
quit;

The REG Procedure
Model: MODEL1
Dependent Variable: prestige

                             Analysis of Variance

                                    Sum of           Mean
Source                   DF        Squares         Square    F Value    Pr > F
Model                     6          25604     4267.27481      94.46    <.0001
Error                    95     4291.77780       45.17661
Corrected Total         101          29895

Root MSE              6.72135    R-Square     0.8564
Dependent Mean       46.83333    Adj R-Sq     0.8474
Coeff Var            14.35165
                        Parameter Estimates

                     Parameter       Standard
Variable     DF       Estimate          Error    t Value    Pr > |t|
Intercept     1       20.83821       56.89953       0.37      0.7150
inc2          1        8.78333        1.27275       6.90      <.0001
educat        1      -29.91994       15.25151      -1.96      0.0527
edu2          1        2.91593        1.41441       2.06      0.0420
edu3          1       -0.08068        0.04221      -1.91      0.0590
percwomn      1       -0.17932        0.08509      -2.11      0.0377
percwomn2     1        0.00250     0.00092446       2.70      0.0081
Section 12.4 Discrete Data
Table 12.2 on page 319 using data file vocab.
proc reg data=vocab;/*linear effect*/
  model vocab = educ;
  run;
quit;
data vocadm;/*create dummy variables*/
  set vocab;
  Array d(19);
  do i = 1 to 19;
  d(i)=0;
  end;
  drop i;
  if educ=1 then d1=1;
  else if educ ge 3 then d(educ-1)= 1;
run;
proc reg data=vocadm;/*test on nonlinear effect*/
  model vocab = d1-d18 educ;
  test d1, d2, d3, d4, d5, d6, d7, d8, d9, d10, d11, d12, d13, d14, d15, d16, d17, d18;
  run;
quit;

The REG Procedure
Model: MODEL1
Dependent Variable: vocab

                             Analysis of Variance

                                    Sum of           Mean
Source                   DF        Squares         Square    F Value    Pr > F
Model                     1     1175.11129     1175.11129     318.92    <.0001
Error                   966     3559.41351        3.68469
Corrected Total         967     4734.52479

Root MSE              1.91956    R-Square     0.2482
Dependent Mean        5.94008    Adj R-Sq     0.2474
Coeff Var            32.31530

(rest of the output omitted.)

The REG Procedure
Model: MODEL1
Dependent Variable: vocab

                             Analysis of Variance

                                    Sum of           Mean
Source                   DF        Squares         Square    F Value    Pr > F
Model                    19     1261.69388       66.40494      18.13    <.0001
Error                   948     3472.83091        3.66332
Corrected Total         967     4734.52479

Root MSE              1.91398    R-Square     0.2665
Dependent Mean        5.94008    Adj R-Sq     0.2518
Coeff Var            32.22146

(rest of the output omitted.)

The REG Procedure
Model: MODEL1

       Test 1 Results for Dependent Variable vocab

                                Mean
Source             DF         Square    F Value    Pr > F

Numerator          18        4.81014       1.31    0.1706
Denominator       948        3.66332
Section 12. 5 Maximum-Likelihood Methods
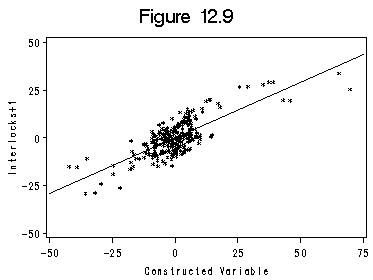
Box-Cox and Box-Tidwell transformation. Calculation on page 323 and Figure 12.9 on data file ornstein.
data ornstein1;/*coding dummy variables*/
  set ornstein;
  	Array sec(9);
  do i = 1 to 9;
    sec(i)=0;
  end;
    Array nat(3);
  do i =1 to 3;
    nat(i)=0;
  end;
  drop i;
  if nation = 'OTH' then nat(1)=1;/*baseline: Canada*/
  if nation = 'UK' then nat(2)=1;
  if nation = 'US' then nat(3)=1;

  if sector = 'AGR' then sec1=1;/*baseline: Heavy manufacturing*/
  if sector = 'BNK' then sec2=1;
  if sector = 'CON' then sec3=1;
  if sector = 'FIN' then sec4=1;
  if sector = 'HLD' then sec5=1;
  if sector = 'MER' then sec6=1;
  if sector = 'MIN' then sec7=1;
  if sector = 'TRN' then sec8=1;
  if sector = 'WOD' then sec9=1;
  output;
run;
data orn1;/*geometric mean*/
  set ornstein1 ;
   retain yg 0;
   yg = yg + log(intrlcks+1);
   size = _n_;
   ygeo=exp(yg/size);
   keep ygeo;
    if _n_ = 248 then output;/*original dataset has 248 observations*/
run;
data orn2;
  set ornstein1;
  y1=intrlcks+1;
  asset1=sqrt(assets);
  g=y1*(log(y1/8.25013)-1);
run;
proc reg data=orn2;
  model y1=sec1-sec9 nat1-nat3 asset1 g;
  output out = orn2reg r=r;
  run;
  test g=0;
quit;

The REG Procedure
Model: MODEL1
Dependent Variable: y1

(omitted most of the output here.)

                        Parameter Estimates

                     Parameter       Standard
Variable     DF       Estimate          Error    t Value    Pr > |t|
Intercept     1       11.41614        1.21721       9.38      <.0001
(more variables in between)
g             1        0.58504        0.03132      18.68      <.0001
Remark: 1-g gives the estimated transformation. The t-test below assesses the
need for a transformation.
        Test 1 Results for Dependent Variable y1

                                Mean
Source             DF         Square    F Value    Pr > F
Numerator           1          13232     348.86    <.0001
Denominator       233       37.92986
proc reg data=orn2reg noprint;/*partial regression*/
  model y1=sec1-sec9 nat1-nat3 asset1;
  output out=orn3reg r=rg;
  run;
quit;
proc reg data=orn3reg noprint;
  model g=sec1-sec9 nat1-nat3 asset1;
  output out=orn4reg r=rg1;
  run;
quit;
axis1 order=(-50 to 75 by 25);
axis2 order=(-50 to 50 by 25) label=(r=0 a=90);
title 'Figure 12.9';
proc gplot data=orn4reg;/* Figure 12.9 */
  plot rg*rg1 /haxis=axis1 vaxis=axis2 hminor=0 vminor=0;
  label rg1='Constructed Variable';
  label rg='Interlocks+1';
  run;
quit;
The adxtrans and adxgen are SAS macro that produces MLE's of the dependent variable. The two '*' shown in the output in column adxconf says that the parameter should be between 0.2 and 0.4.
%adxgen
  %adxtrans(orn2, ornout, y1, assets sec1 sec2 sec3 sec4 sec5 sec6 sec7 sec8 sec9 nat1 nat2 nat3);
Obs    adxlam     _RMSE_    adxconf
  1     -2.0     82.5764
  2     -1.8     59.7584
  3     -1.6     43.6997
  4     -1.4     32.3614
  5     -1.2     24.3342
  6     -1.0     18.6427
  7     -0.8     14.6118
  8     -0.6     11.7750
  9     -0.4      9.8116
 10     -0.2      8.5037
 11      0.0      7.7072
 12      0.2      7.3333       *
 13      0.4      7.3375       *
 14      0.6      7.7164
 15      0.8      8.5123
 16      1.0      9.8265
 17      1.2     11.8452
 18      1.4     14.8828
 19      1.6     19.4519
 20      1.8     26.3746
 21      2.0     36.9602
Likelihood for Power
Plot of _RMSE_*adxlam. Symbol used is 'L'.| | 100 + R | o | o | t | L 80 + m | e | a | n | 60 + L s | q | u | a | L r 40 + e | L d | L | L e | L r 20 + L L r | L L o | L L r | L L L L L L L L | 0 + | ---+-------+-------+-------+-------+-------+-------+-------+-------+-------+-------+-- -2.0 -1.6 -1.2 -0.8 -0.4 0.0 0.4 0.8 1.2 1.6 2.0
adxlam
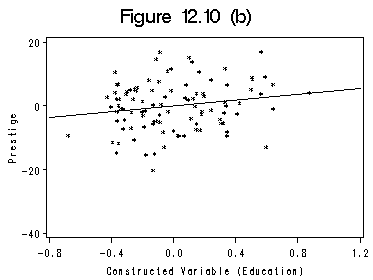
Section 12.5.2 on Box-Tidwell Transformation using data file prestige. SAS8 does not have a procedure that does the transformation yet. Michael Friendly in York University has written a macro boxtid that does it. Interested readers should consult his webpage for more details on this macro and its usage. We will only cover the constructed variable plots.
data prst1; set prestige; w2=percwomn**2; linc=income*log(income); ledu=educat*log(educat); run; proc reg data=prst1; model prestige=percwomn w2 educat income; output out=cvp r=res; run; quit; proc reg data=cvp noprint; model linc=percwomn w2 educat income; output out=cvp1 r=res1; run; quit; title 'Figure 12.10 (a)'; axis1 order=(-4000 to 8000 by 4000); axis2 order =(-40 to 20 by 20) label=(r=0 a=90); symbol1 c=black i=rl v=star; proc gplot data=cvp1; plot res*res1=1/haxis=axis1 vaxis=axis2 vminor=0 hminor=0; label res1='Constructed Variable (Income)'; label res='Prestige'; run; quit;proc reg data=cvp noprint; model ledu=percwomn w2 income educat; output out=cvp2 r=res2; run; quit; title 'Figure 12.10 (b)'; axis1 order=(-0.8 to 1.2 by .4); axis2 order =(-40 to 20 by 20) label=(r=0 a=90); symbol1 c=black i=rl v=star; proc gplot data=cvp2; plot res*res2=1/haxis=axis1 vaxis=axis2 vminor=0 hminor=0; label res2='Constructed Variable (Education)'; label res='Prestige'; run; quit;
