Section 13.1 Detecting Collinearity
Table 13.1 and Table 13.2 using data file Ericksen.
proc reg data=ericksen;
  model undcount=perc_min crimrate poverty diffeng hsgrad housing city countprc ;
run;
quit;
proc corr data=ericksen;
  var perc_min crimrate poverty diffeng hsgrad housing city countprc ;
run;

The REG Procedure
Model: MODEL1
Dependent Variable: undcount

                             Analysis of Variance

                                    Sum of           Mean
Source                   DF        Squares         Square    F Value    Pr > F

Model                     8      280.79543       35.09943      17.25    <.0001
Error                    57      115.98480        2.03482
Corrected Total          65      396.78023


Root MSE              1.42647    R-Square     0.7077
Dependent Mean        1.92106    Adj R-Sq     0.6667
Coeff Var            74.25437

                        Parameter Estimates

                     Parameter       Standard
Variable     DF       Estimate          Error    t Value    Pr > |t|

Intercept     1       -1.77139        1.38218      -1.28      0.2052
perc_min      1        0.07983        0.02261       3.53      0.0008
crimrate      1        0.03012        0.01300       2.32      0.0241
poverty       1       -0.17837        0.08492      -2.10      0.0401
diffeng       1        0.21512        0.09221       2.33      0.0232
hsgrad        1        0.06129        0.04477       1.37      0.1764
housing       1       -0.03496        0.02463      -1.42      0.1613
city          1        1.15998        0.77064       1.51      0.1378
countprc      1        0.03699        0.00925       4.00      0.0002

The CORR Procedure

   8  Variables:    perc_min crimrate poverty  diffeng  hsgrad   housing  city     countprc

                                    Simple Statistics

Variable           N          Mean       Std Dev           Sum       Minimum       Maximum

perc_min          66      19.43636      17.51441          1283       0.70000      72.60000
crimrate          66      63.06061      24.89107          4162      25.00000     143.00000
poverty           66      13.46818       4.48108     888.90000       6.80000      23.90000
diffeng           66       1.92576       2.45396     127.10000       0.20000      12.70000
hsgrad            66      33.64697       8.49286          2221      17.50000      51.80000
housing           66      15.66515       9.82810          1034       7.00000      52.10000
city              66       0.24242       0.43183      16.00000             0       1.00000
countprc          66      11.72727      24.86737     774.00000             0     100.00000

                           Pearson Correlation Coefficients, N = 66
                                   Prob > |r| under H0: Rho=0

           perc_min   crimrate    poverty    diffeng     hsgrad    housing       city   countprc

perc_min    1.00000    0.65490    0.73842    0.39545    0.53516    0.35679    0.75774   -0.33444
                        <.0001     <.0001     0.0010     <.0001     0.0033     <.0001     0.0061

crimrate    0.65490    1.00000    0.36911    0.51165    0.06656    0.53172    0.72857   -0.23309
             <.0001                0.0023     <.0001     0.5954     <.0001     <.0001     0.0596

poverty     0.73842    0.36911    1.00000    0.15157    0.75064    0.33522    0.53752   -0.15704
             <.0001     0.0023                0.2244     <.0001     0.0059     <.0001     0.2079

diffeng     0.39545    0.51165    0.15157    1.00000   -0.11640    0.34021    0.48036   -0.10819
             0.0010     <.0001     0.2244                0.3520     0.0052     <.0001     0.3872

hsgrad      0.53516    0.06656    0.75064   -0.11640    1.00000    0.23485    0.31482   -0.41422
             <.0001     0.5954     <.0001     0.3520                0.0577     0.0100     0.0005

housing     0.35679    0.53172    0.33522    0.34021    0.23485    1.00000    0.56570   -0.08629
             0.0033     <.0001     0.0059     0.0052     0.0577                <.0001     0.4909

city        0.75774    0.72857    0.53752    0.48036    0.31482    0.56570    1.00000   -0.26882
             <.0001     <.0001     <.0001     <.0001     0.0100     <.0001                0.0291

countprc   -0.33444   -0.23309   -0.15704   -0.10819   -0.41422   -0.08629   -0.26882    1.00000
             0.0061     0.0596     0.2079     0.3872     0.0005     0.4909     0.0291
Section 13.2 Coping With Collinearity: No Quick Fix
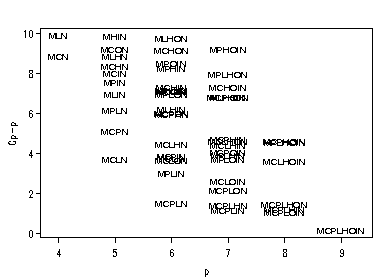
Figure 13.6 on page 358 using dataset ericksen. In this example it is also shown how to create an annotate set and how to use the function compress to compress a string variable.
data temp;
  set ericksen;
  M=perc_min;
  C=crimrate;
  P=poverty;
  L=diffeng;
  H=hsgrad;
  O=housing;
  I=city;
  N=countprc;
run;
proc reg data=temp;
   model undcount= M C P L H O I N / selection=cp ;
   ods output  SubsetSelSummary=cperick;
run;
quit;
data subcperick;
  set cperick;
  np=NumInModel+1;
  diff=cp-np;
  if diff <= 10;
  var=compress(VarsInModel);/*to take away the spaces*/
  output;
  drop Model Dependent Control RSquare;
run;
data labels; /*Annotate set created for labeling*/
  length function style text $ 8;
  retain function 'label' xsys ysys '2' style 'swiss'
         size 1 when 'a' color 'black';
  set subcperick end=lastob;
                            /* determine the values of the */
  x=np; y=diff;     /* of the x and y variables.*/
  text=left(put(var, $8.));
  position='B';
run;
axis1 order=(4 to 9 by 1) offset=(3, 5);
axis2 order=(0 to 10 by 2) label=(r=0 a=90);
symbol c=black i=none v=none;
proc gplot data=subcperick;
  plot diff*np=1 / annotate=labels vminor=0 hminor=0 haxis=axis1 vaxis=axis2  ;
  label np='p';
  label diff='Cp-p';
run;
quit;

In order to create Table 13.4 on page 359 using data file Ericksen, we create a table that contains the number of variables and their names in the model and the corresponding R-squares for the "Best" models. Table 13.4 can then be created based on this information by doing regression one model at a time.
proc reg data=ericksen;
   model undcount= perc_min crimrate poverty diffeng hsgrad housing city countprc
          / selection=cp ;
   ods output  SubsetSelSummary=cperick;
   run;
quit;
proc sort data=cperick;
  by NumInModel RSquare;
run;
data short;
  set cperick;
  by NumInModel;
  if last.NumInModel then output;
  drop Model Dependent Control;
  run;
proc print data=short;
run;

The REG Procedure
Model: MODEL1
Dependent Variable: undcount

C(p) Selection Method

Number in
  Model        C(p)  R-Square  Variables in Model

       5     7.3196    0.6855  perc_min crimrate poverty diffeng countprc
       6     7.9829    0.6924  perc_min crimrate poverty diffeng city countprc
       .....
       6     8.2075    0.6912  perc_min crimrate poverty diffeng hsgrad countprc
       4     8.5149    0.6691  perc_min crimrate diffeng countprc
       5     8.8253    0.6778  perc_min poverty diffeng city countprc
Model        Cp  RSquare  VarsInModel

 1          1   36.7625  0.4935   perc_min
 2          2   23.9334  0.5696   perc_min hsgrad
 3          3   12.6764  0.6375   perc_min crimrate countprc
 4          4    8.5149  0.6691   perc_min crimrate diffeng countprc
 5          5    7.3196  0.6855   perc_min crimrate poverty diffeng countprc
 6          6    7.9829  0.6924   perc_min crimrate poverty diffeng city countprc
 7          7    8.8738  0.6981   perc_min crimrate poverty diffeng housing city countprc
 8          8    9.0000  0.7077   perc_min crimrate poverty diffeng hsgrad housing city countprc
