This page shows how to obtain the results of Fox’s Chapter 2 using SAS.
Section 2.2
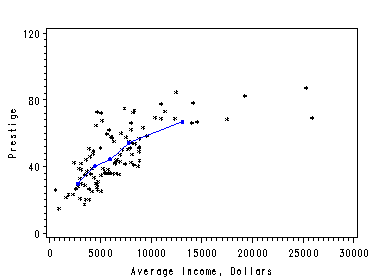
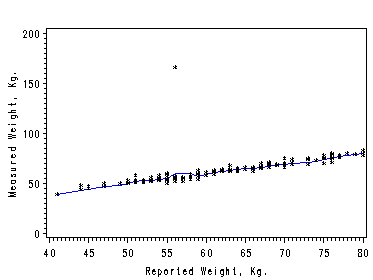
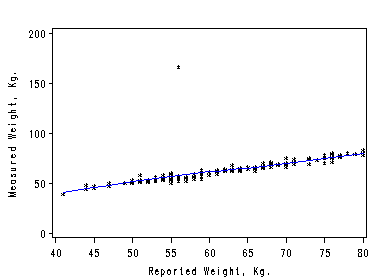
Page 20, figure 2.3. Dissecting the X’s into a large number of narrow intervals and using the average in each interval as the approximation. The nonparametric regression is obtained by connecting the average points of Y’s and X’s. We create a macro function to split the dataset into a number of cells and output a dataset with average points in each interval.
Figure 2.3. using data file Davis.
%macro trans(inset, num, x, y, outset);
proc sort data=&inset out=tempset;
  by &x;
run;
data newset;
  set  tempset nobs=total;
  a = int((_n_-1)/(total/&num))+1; /*do the splitting here.*/
  if &x='.' then delete;
run;
proc means data=newset nway; /*find the average for x and y.*/
  class a;
  var &x &y;
  output out=means mean=xme yme;
run;
data &outset;  /*merge it back to the original dataset. */
  merge newset means;
  by a;
run;
%mend;
%trans(davis, 10, reptwt, measwt, davisout); /*calling the macro to create a new dataset */
symbol1 color=black i=none v=star height=0.5;
symbol2 color=blue i=join v=none height=1;
symbol3 color=black i=join v=none height=1;
axis1 order=(40 to 80 by 5);
axis2 order=(0 to 200 by 50) label=(r=0 a=90);
filename outfiles 'https://stats.idre.ucla.edu/wp-content/uploads/2016/02/chap2ex1.gif';
goptions gsfname=outfiles dev=gif373;proc gplot data=davisout;
    plot measwt*reptwt=1 yme*xme=2 reptwt*reptwt=3/overlay haxis=axis1 vaxis=axis2;
    label reptwt='Reported Weight, Kg.';
    label measwt='Measureed Weight, Kg.';
run;
quit;
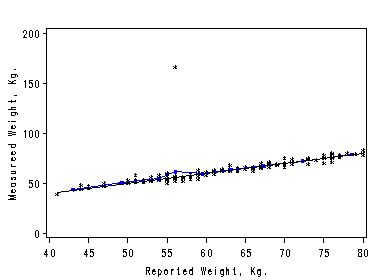
Figure 2.4. using data file prestige.
%trans(prestige, 5, income, prestige, prestigeout);
symbol1 color=black i=none v=star height=0.5;
symbol2 color=blue i=join v=none height=1;
axis1 order=(0 to 30000 by 5000);
axis2 order=(0 to 120 by 40) label=(r=0 a=90);
filename outfiles 'https://stats.idre.ucla.edu/wp-content/uploads/2016/02/chap2ex2.gif';
goptions gsfname=outfiles dev=gif373;
proc gplot data=prestigeout;
  plot prestige*income=1 yme*xme=2/overlay haxis=axis1 vaxis=axis2;
  label income='Average Income, Dollars';
  label prestige='Prestige';
run;
quit;
Section 2.3
The first two examples show how to obtain local average by using proc macontrol and machart. The last two examples show how to use proc loess.
Figure 2.6. using data file Davis. First we create a dataset that only contains observations with the reported weigh less than or equal to 80 Kg for our graph will only capture this part of dataset.
data davisShort;
  set davisout;
  if reptwt le 81 then output;
run;
proc macontrol data=davisShort;/*use machart to create the moving average*/
  machart measwt*reptwt / span=3 /*specify the length of span*/
  outhistory=davishistory
  nochart;
run;
data davisma;
  merge davishistory davisout ;
  by reptwt;
  keep reptwt measwt measwtA; /*merge it back*/
run;
symbol1 color=blue i=join v=none height=1;
symbol2 color=black  i=none v=star height=0.5;
axis1 order=(40 to 80 by 5);
axis2 order =(0 to 200 by 50)label=(r=0 a=90);
filename outfiles 'chap2Ex3.gif';
goptions gsfname=outfiles dev=gif373;
proc gplot data=davisma;
  plot measwtA*reptwt=1  measwt*reptwt=2 /overlay haxis=axis1 vaxis=axis2;
  label measwtA='Measured Weight, Kg.';
run;
quit;
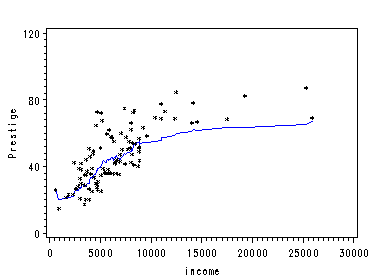
Figure 2.7. using data file prestige.
proc sort data=prestige;
  by income;
run;
proc macontrol data=prestige;
  machart prestige*income /  span=20 haxis=(0 to 30000 by 5000)
  outhistory=prestigehistory
  nochart;
run;
data prestigema;
  merge prestigehistory prestigeout;
  by income;
  keep prestigeA prestige income;
run;
filename outfiles 'https://stats.idre.ucla.edu/wp-content/uploads/2016/02/chap2ex4.gif';
goptions gsfname=outfiles dev=gif373;
symbol1 color=blue i=join v=none height=1;
symbol2 color=black i=none v=star height=0.5;
axis1 order=(0 to 30000 by 5000);
axis2 order =(0 to 120 by 40)label=(r=0 a=90);
proc gplot data=prestigema;
  plot prestigeA*income=1  prestige*income =2 /overlay haxis=axis1 vaxis=axis2;
  label prestigeA='Prestige';
run;
quit;
Figure 2.9. using data file davis.
proc loess data=davis;
  ods output OutputStatistics=davisR;
  model measwt=reptwt/ smooth=0.15;
run;
quit;
symbol1 color=black i=none v=star height=0.5;
symbol2 color=blue i=join v=none height=1;
axis1 order=(40 to 80 by 5);
axis2 order=(0 to 200 by 50) label=(r=0 a=90);
filename outfiles 'chap2Ex5.gif';
goptions gsfname=outfiles dev=gif373;
proc sort data=davisR;
  by reptwt;
run;
proc gplot data=davisR;
  format reptwt;
  format DepVar f4.0;
  format Pred f4.0;
  plot DepVar*reptwt=1 Pred*reptwt=2
  /overlay haxis=axis1 vaxis=axis2;
  label reptwt='Reported Weight, Kg.';
  label DepVar='Measured Weight, Kg.';
run;
quit;
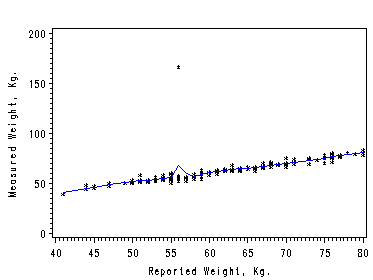
Figure 2.10. using data file davis. Robust regression down-weighting outliers using the default option of proc loess.
proc loess data=davis;
  ods output OutputStatistics=davisRob;
  model measwt=reptwt;
run;
quit;
symbol1 color=black i=none v=star height=0.5;
symbol2 color=blue i=join v=none height=1;
axis1 order=(40 to 80 by 5);
axis2 order=(0 to 200 by 50) label=(r=0 a=90);
filename outfiles 'chap2Ex6.gif';
goptions gsfname=outfiles dev=gif373;
proc sort data=davisRob;
  by reptwt;
run;
proc gplot data=davisRob;
  format reptwt;
  format DepVar f4.0;
  format Pred f4.0;
  plot DepVar*reptwt=1 Pred*reptwt=2
  /overlay haxis=axis1 vaxis=axis2 hminor=0 vminor=0;
  label reptwt='Reported Weight, Kg.';
  label DepVar='Measured Weight, Kg.';
run;
quit;

