Section 4.2 Transforming Skewness
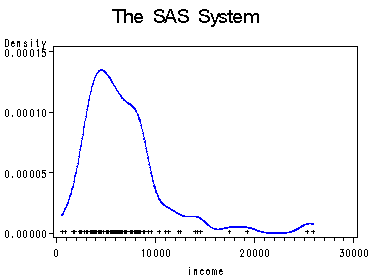
Page 65, figure 4.2 using data file prestige. This figure shows an example of a kernel density estimator (and is the same as page 41 figure 3.5), using proc kde. We use the option bwm=0.8 to specify the bandwidth multipliers for the kernel density estimate. The default for bwm is 1 which produces smoother estimate than smaller ones.
proc kde data=prestige out=pkde bwm=0.8;
  var income;
run;
data pkde1;
  set pkde;
  if count ne 0 then mycount=0.000001; /*a dummy variable for oneway
                                        scatterplot*/;
run;
proc sort data=pkde1;
  by income;
run;
axis order=(0 to 0.00015 by 0.00005);
symbol1 c=blue i=join v=circle height=0.02;
symbol2 c=black i=none v='|' height=0.5;
proc gplot data=pkde1;
  plot density*income=1 mycount*income=2  / overlay vaxis=axis;
run;
quit;
Page 66, table at top. First we create a data set with extra variables for the transformations. Then we compute q1, median, and q3 for each variable. Finally we stack them back together and compute the hinge spread.
data prstTrans;
  set prestige;
  sqincome=sqrt(income);
  logincome=log10(income);
  invincome=-1/sqrt(income);
run;
proc means data=prstTrans q1 q3 median maxdec=4;
  var income;
  output out=mean1 q1=q1  q3=q3 median=med;
run;
proc means data=prstTrans q1 q3 median maxdec=4;
  var sqincome;
  output out=mean2 q1=q1 q3=q3 median=med;
run;
proc means data=prstTrans q1 q3 median maxdec=4;
  var logincome;
  output out=mean3 q1=q1 q3=q3 median=med;
run;
proc means data=prstTrans q1 q3 median maxdec=4;
  var invincome;
  output out=mean4 q1=q1 q3=q3 median=med;
run;
proc format;
  value var 1='X'
            2='sqrt of X'
            3='log of X'
            4='-1/sqrt(X)';
data finalmean;
  format q1 q3 med f8.5;
  set mean1 mean2 mean3 mean4;
  hinge=(q3-med)/(med-q1);
  y=_n_;
  drop _TYPE_ _FREQ_;
run;
proc print data=finalmean L;
  format y var. ;
  var y q1 med q3 hinge;
  label y='Transformation';
  label med='Median';
  label hinge='Ratio';
run;

The MEANS Procedure
...Omitted.

Obs    Transformation          q1      Median          q3     Ratio

 1       X               4075.000    5930.500    8206.000    1.22635
 2       sqrt of X       63.83573    77.00952    90.58697    1.03064
 3       log of X         3.61013     3.77309     3.91413    0.86553
 4       -1/sqrt(X)      -0.01567    -0.01299    -0.01104    0.72633
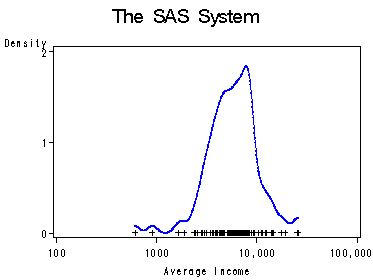
Page 66, figure 4.3.
proc kde data=prstTrans out=out bwm=0.5;
  var logincome;
run;
data kdeout;
  set out;
  if count ne 0 then mycount=0.00001; /*a dummy variable for oneway
                                        scatterplot*/;
run;
proc sort data=kdeout;
  by logincome;
run;
axis1 order=(0 to 2 by 1);
axis2 order =(2 to 5 by 1)
      value=(tick=1 '100' tick=2 '1000' tick=3 '10,000' tick=4 '100,000');
symbol1 c=blue i=join v=circle height=0.05;
symbol2 c=black i=none v='|'height=1;
proc gplot data=kdeout;
  plot density*(logincome)=1 mycount*logincome=2
  /overlay haxis = axis2 hminor=0 vminor=0 vaxis=axis1 ;
  label logincome='Average Income';
  label density='Density';
run;
quit;
Section 4.3 Transforming Nonlinearity
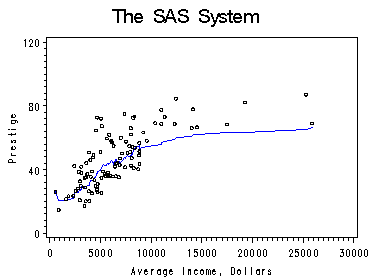
On page 72, figure 4.7 repeats figure 2.7 from chapter 2. This uses proc macontrol to obtain moving average for nonparametric regression.
proc sort data=prestige out=psorted;
  by income;
run;
proc macontrol data=psorted;
  machart prestige*income /  span=20 haxis=(0 to 30000 by 5000)
  outhistory=phis
  nochart;
run;
data pma;
  merge phis psorted;
  by income;
  keep prestigeA prestige income;
run;
symbol1 color=blue i=join v=none height=1;
symbol2 color=black i=none v=circle height=0.5;
axis1 order=(0 to 30000 by 5000) ;
axis2 order =(0 to 120 by 40)label=(r=0 a=90) ;
proc gplot data=pma;
  plot prestigeA*income=1  prestige*income =2 /overlay haxis=axis1 vaxis=axis2;
  label prestigeA='Prestige';
  label income='Average Income, Dollars';
run;
quit;
Page 72, figure 4.8 This figure shows performing a cube root transformation on income, and then fitting the data using local regression (proc loess in SAS) and using least-squares regression (proc reg in SAS). We use ODS to output our desired dataset. One remark on using ODS. We can use ods trace on to see (from the log file) possible output datasets that a procedure offers. In our case, there are possibly five different datasets for different purposes.
data prstCubic; /*a new dataset with the cubic root of income*/
  set prestige;
  c=income**(1/3);
run;
proc sort data=prstCubic;
  by c;
run;
ods trace on; /*turn ods trace on */
proc loess data=prstCubic;
  model prestige=c /smooth=0.5;
  ods output PredAtVertices=pred;
run;
ods trace off;
proc reg data=prstCubic;
  model prestige=c;
  output out=prstreg p=p;
run;
quit;
proc sort data=pred;
  by c;
run;
data prstcom;
  merge pred prstreg;
  by c;
run;

symbol1 c=black i=join v=none h=1;
symbol2 c=blue i=join v=none h=1;
symbol3 c=black i=none v=star h=0.2;
axis2 order =(0 to 120 by 40) label=(r=0 a=90);
axis1 order =(5 to 30 by 5);
proc gplot data=prstcom;
  format c Pred f4.0;
  plot Pred*c=2 p*c=1 prestige*c=3
    /overlay haxis=axis1 vaxis=axis2 hminor=0 vminor=0;
  label Pred='Prestige';
  label c='Cube-Root Average Income';
run;
quit;
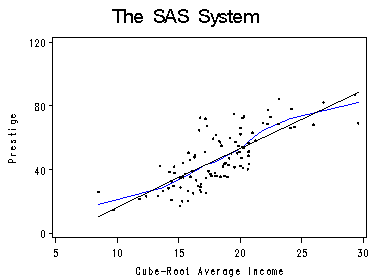
Figure 4.9. using data leinhard.
 proc loess data=leinhard;
  model mortrate=inc /smooth=0.65;
  ods output OutputStatistics=leinPred;
run;
quit;
proc sort data=leinPred;
  by inc;
run;
proc sort data=leinhard;
  by inc;
run;
data leinSct;
  merge leinhard leinPred;
  by inc;
run;
symbol1 c=black i=none v=circle h=0.5;
symbol2 c=blue i=join v=none h=1;
axis2 order =(0 to 750 by 250) label=(r=0 a=90);
axis1 order =(0 to 6000 by 1000);
proc gplot data=leinSct;
  format Pred;
  format inc;
  plot Pred*inc=2 DepVar*inc=1
  /overlay haxis=axis1 vaxis=axis2  hminor=0 vminor=0;
  label inc='Per-Capita Income, U.S. Dollars';
  label Pred='Infant Mortality Rate per 1,000';
run;
quit;
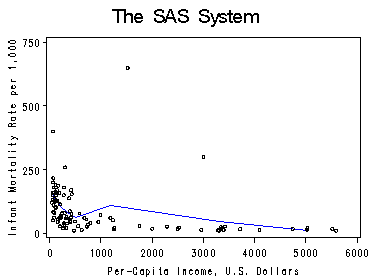
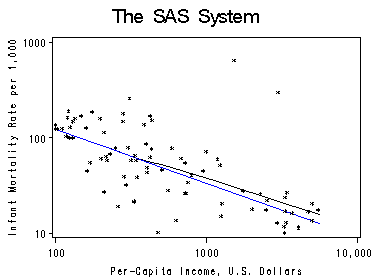
Figure 4.10. on top of page 74. The regression in done without Saudi Arabia and Libya.
data loglein;
  set leinhard;
  logm=log10(mortrate);
  loginc=log10(inc);
run;
proc reg data=loglein ;
  where nation ne 'Libya' & nation ne 'Saudi_Arabia';
  model logm=loginc;
  output out=logreg p=p;
run;
quit;
proc loess data=loglein;
  model logm=loginc /smooth=0.8;
  ods output OutputStatistics=logregL;
run;

proc sort data=logreg;
  by loginc;
run;
data logmerge;
  merge logreg logregL;
  by loginc;
run;
symbol1 c=black i=join v=none h=1;
symbol2 c=blue i=join v=none h=1;
symbol3 c=black i =none v=star h=0.5;
axis2 order =(1 to 3 by 1) label=(r=0 a=90)
value=(tick=1 '10' tick=2 '100' tick=3 '1000') ;
axis1 order =(2 to 4 by 1) value=(tick=1 '100' tick=2 '1000' tick=3 '10,000');
proc gplot data=logmerge;
  format Pred;
  format loginc;
  plot Pred*loginc=1 p*loginc=2 DepVar*loginc=3
    /overlay haxis=axis1 hminor=0 vminor=0 vaxis=axis2;
  label loginc='Per-Capita Income, U.S. Dollars';
  label Pred='Infant Mortality Rate per 1,000';
run;
quit;
Section 4.4 Transforming Nonconstant Spread
Figure 4.11. using data file ornstein.
proc sort data=ornstein;
  by nation;
run;
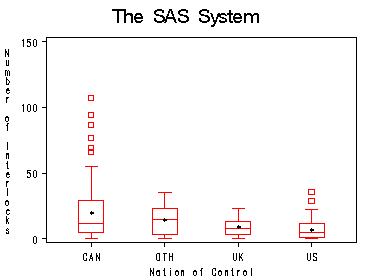
proc boxplot data=ornstein;
  plot intrlcks*nation ='*' /boxstyle=schematic vaxis=(0 to 150 by 50);
  label nation='Nation of Control';
  label intrlcks='Number of Interlocks';
run;
quit;
Table in the middle of page 75.
proc means data=ornstein q1 q3 median qrange;
  class nation;
  var intrlcks;
  output out=spread q1=q1 q3=q3 median=median qrange=qr;
run;

The MEANS Procedure

                        Analysis Variable : intrlcks

            N         Lower         Upper                   Quartile
nation    Obs      Quartile      Quartile       Median      Range
-----------------------------------------------------------------------------
CAN       117         5.0           29.0         12.0        24.0

OTH        18         3.0           23.0         14.5        20.0

UK         17         3.0           13.0          8.0        10.0

US         96         1.0           12.0          5.0        11.0
-----------------------------------------------------------------------------
Figure 4.12. at top of page 76. The labels are produced using an annotate set based on the example on labeling from SAS: (http://support.sas.com/kb/24/920.html).
data spreadlog;
  set spread;
  logmed=log10(median+1);
  logqr=log10(qr);
  drop _type_ _freq_;
  if _n_ ne 1;
  run;
  proc reg data=spreadlog;
  model logqr=logmed;
  output out=lgreg p=p;
quit;
data labels;
  length function style text $ 8;
  retain function 'label' xsys ysys '2' style 'centxi'
         size 3 when 'a' color 'black';
  drop logmed logqr;
  set spreadlog end=lastob; /* The logmed and logqr variables from logspread */
                            /* determine the values of the */
  x=logmed; y=logqr;     /* of the x and y variables.*/
  text=left(put(nation, $20.));
  if _n_=1 then position='E';   /* E for centered */
  else if lastob then position='D'; /*D for right aligned */
  else position='F'; output;  /* F for left aligned */
run;
symbol1 color=black i=none value=circle h=0.5;
symbol2 color=blue i=join value=none;
axis1 order =(0.6 to 1.2 by .2) offset=(2, 5);
axis2 order=(0.9 to 1.5 by 0.2) label=(r=0 a=90);
proc gplot data=lgreg;
  plot logqr*logmed=1 p*logmed=2
  /overlay annotate=labels haxis=axis1 vaxis=axis2 hminor=0 vminor=0;
  label logmed='log10 Median(Interlocks+1)';
  label logqr='log10 Hinge-Spread';
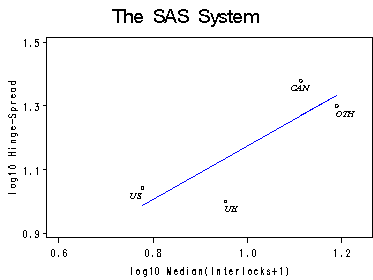
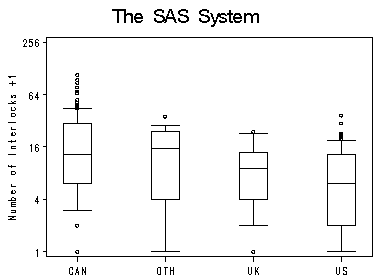
Figure 4.13. The boxplot is done using proc gplot with the high and low bounds at 90 and 10 percentile.
data ornlog;
  set ornstein;
  intrlog = log2(intrlcks+1);
run;
symbol interpol=boxt10 bwidth=10 value=circle h=0.5;
axis1 label=none offset=(5,5);
axis2 order=(0 to 8 by 2) label=(r=0 a=90)
	 value=(t=1 '1' t=2 '4' t=3 '16' t=4 '64' t=5 '256');
proc gplot data=ornlog ;
  plot intrlog*nation=1 /haxis=axis1 vaxis=axis2 vminor=0;
  label intrlog='Number of Interlocks +1';
run;
quit;
Section 4.5 Transforming Proportions
Figure 4.14. Stem-leaf plot using proc univariate.
data prstwomen; set prestige; prstwm=percwomn/100; run; proc univariate data=prstwomen plots plotsize=30; var prstwm; run;The UNIVARIATE Procedure Variable: prstwm We ommit most of the output here.
Stem Leaf # Boxplot 9 66678 5 | 9 123 3 | 8 | 8 334 3 | 7 56667 5 | 7 12 2 | 6 889 3 | 6 3 1 | 5 567 3 | 5 22 2 +-----+ 4 778 3 | | 4 | | 3 599 3 | | 3 0134 4 | | 2 568 3 | + | 2 0144 4 | | 1 566777 6 | | 1 11112344 8 *-----* 0 555667788899 12 | | 0 00000111111111111222223334444444 32 +-----+ ----+----+----+----+----+----+-- Multiply Stem.Leaf by 10**-1
Figure 4.16. on page 80.
data prstlogit; set prestige; pprime=.005 + .99*percwomn/100; lgtperc = log(pprime / (1-pprime)); run; proc univariate data=prstlogit plots plotsize=30; var lgtperc; run;The UNIVARIATE Procedure Variable: lgtperc
We ommit most of the output here.
Stem Leaf # Boxplot 3 5 1 | 3 1112 4 | 2 5 1 | 2 24 2 | 1 566 3 | 1 11112 5 | 0 578899 6 | 0 11223 5 +-----+ -0 44111 5 | | -0 988776 6 | | -1 431111 6 | | -1 988777655 9 *--+--* -2 4443210000 10 | | -2 8887755 7 | | -3 4332211000 10 +-----+ -3 98765 5 | -4 4322210 7 | -4 65555 5 | -5 33333 5 | ----+----+----+----+

