Section 8.1 One Way Analysis of Variance
Table in the middle of page 160 using data file duncan.
title 'Table on page 160';
proc means data=duncan;
  var prestige;
  class occtype;
run;

The MEANS Procedure

                           Analysis Variable : prestige

             N
occtype    Obs     N            Mean         Std Dev         Minimum         Maximum
------------------------------------------------------------------------------------
bc          21    21      22.7619048      18.0552063       3.0000000      67.0000000

prof        18    18      80.4444444      14.1055776      45.0000000      97.0000000

wc           6     6      36.6666667      11.7926531      16.0000000      52.0000000
------------------------------------------------------------------------------------
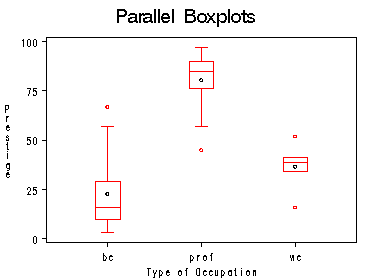
Figure 8.1 on page 161 using data file duncan.
proc sort data=duncan;
  by occtype;
run;
title1 'Parallel Boxplots';
proc boxplot data=duncan;
  plot prestige*occtype /boxstyle=schematic idsymbol=circle;
  label occtype='Type of Occupation';
  label prestige='Prestige';
run;

Table on page 161.
proc glm data=duncan;
  class occtype;
  model prestige=occtype;
run;

The GLM Procedure

      Class Level Information

Class         Levels    Values
occtype            3    bc prof wc

Number of observations    45

The GLM Procedure

Dependent Variable: prestige
                                        Sum of
Source                      DF         Squares     Mean Square    F Value    Pr > F
Model                        2     33090.05714     16545.02857      65.57    <.0001

Error                       42     10597.58730       252.32351

Corrected Total             44     43687.64444

R-Square     Coeff Var      Root MSE    prestige Mean
0.757424      33.30900      15.88469         47.68889
Section 8.2 Two-way Analysis of Variance
Table 8.2 using data file moore.
proc sort data=moore;
  by fcat;
run;
title 'Table 8.2';
proc tabulate data=moore;
  class status fcat;
  var conform;
  table status='Status of Partner'*conform=''*(mean std n),
  fcat='Authoritarianism'/row=float;
run;
quit;

---------------------------------------------------------------
|                      |           Authoritarianism           |
|                      |--------------------------------------|
|                      |    high    |    low     |   medium   |
|----------------------+------------+------------+------------|
|Status of |           |            |            |            |
|Partner   |           |            |            |            |
|----------+-----------|            |            |            |
|high      |Mean       |       11.86|       17.40|       14.27|
|          |-----------+------------+------------+------------|
|          |Std        |        3.93|        4.51|        3.95|
|          |-----------+------------+------------+------------|
|          |N          |        7.00|        5.00|       11.00|
|----------+-----------+------------+------------+------------|
|low       |Mean       |       12.63|        8.90|        7.25|
|          |-----------+------------+------------+------------|
|          |Std        |        7.35|        2.64|        3.95|
|          |-----------+------------+------------+------------|
|          |N          |        8.00|       10.00|        4.00|
---------------------------------------------------------------
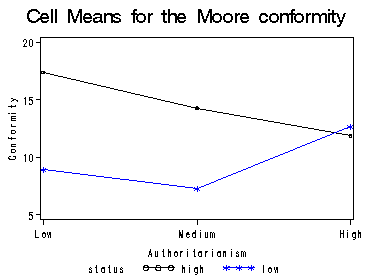
Figure 8.5 on page 169 on cell means for data file moore.
proc means data=moore noprint;
  class fcat status;
  var conform;
  output out=clmean mean=mh;
run;
data moore_cl;
  set clmean;
  if fcat='high' then fcode=2;
  if fcat='medium' then fcode=1;
  if fcat='low' then fcode=0;
  if _type_ = 3 then output;
  drop _type_ ;
run;
proc sort data=moore_cl;
  by fcode;
run;
title1 'Cell Means for the Moore conformity';
goptions gsfname=outfiles dev=gif373;
axis1 order=(0 to 2 by 1) minor=none value=(tick=1 'Low' tick=2 'Medium' tick=3 'High');
axis2 order=(5 to 20 by 5) minor=none label=(r=0 a=90);
symbol1 c=black i=join;
symbol2 c=blue i =join;
proc gplot data=moore_cl;
  plot mh*fcode=status /haxis =axis1 vaxis=axis2;
  label fcode='Authoritarianism';
  label mh='Conformity';
run;
quit;

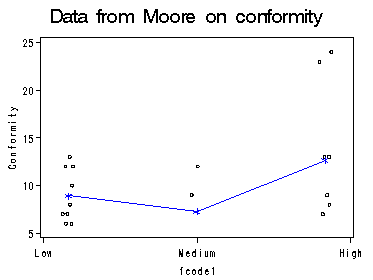
Figure 8.6 on page 170 using data file moore. We have to jitter the dataset a little bit.
data JitMoore; set moore; if fcat ='high' then fcode=2; else if fcat ='medium' then fcode =1; else if fcat='low' then fcode=0; retain seed 0; fcode1= fcode + 0.10*(ranuni(seed)-0.5); run; proc sort data=JitMoore; by fcat status; run; proc means data=moore; class fcat status; var conform; output out=clmean mean=mh; run; proc sort data=clmean; by fcat status; run; data mooreF; merge JitMoore clmean; by fcat status; run; proc sort data=mooreF; by fcode; run; title1 'Data from Moore on conformity'; goptions gsfname=outfiles dev=gif373; axis1 order=(-0.2 to 2.2 by 1.2) minor=none value=(tick=1 'Low' tick=2 'Medium' tick=3 'High'); axis2 order=(5 to 25 by 5) minor=none label=(r=0 a=90); symbol1 c=black i=none; symbol2 c=blue i =join v=star h=1.2; proc gplot data=mooreF; plot conform*fcode1=1 mh*fcode=2 /overlay haxis=axis1 vaxis=axis2; where status eq 'high'; label fcode='Authoritarianism'; label conform='Conformity'; run;proc gplot data=mooreF; plot conform*fcode1=1 mh*fcode=2 /overlay haxis=axis1 vaxis=axis2; where status eq 'low'; label fcode='Authoritarianism'; label conform='Conformity'; run; quit;

Calculation in the middle of page 177 and Table 8.6 on page 178 on data file moore. First we follow the coding scheme on page 173. Using this coding scheme, we then run a number of proc glm to produce the results. Each model gives a sum of square shown in the middle of page 177 and each test gives a row in Table 8.6. Notice the results for Table 8.6 using SAS are slightly different from the book as the degree of freedom used for calculating the F-value is different. (Compare Chapter 7 Table 7.2.)
data mdummy; set moore; if fcat='low' and status='low' then do r1=1; c1=1; c2=0; r1c1=1; r1c2=0; end; if fcat='medium' and status='low' then do r1=1; c1=0; c2=1; r1c1=0; r1c2=1; end; if fcat='high' and status='low' then do r1=1; c1=-1; c2=-1; r1c1=-1; r1c2=-1; end; if fcat='low' and status='high' then do r1=-1; c1=1; c2=0; r1c1=-1; r1c2=0; end; if fcat='medium' and status='high' then do r1=-1; c1=0; c2=1; r1c1=0; r1c2=-1; end; if fcat='high' and status='high' then do r1=-1; c1=-1; c2=-1; r1c1=1; r1c2=1; end; output; run; proc reg data=mdummy; /* ss(alpha, beta, gamma) */ model conform=r1 c1 c2 r1c1 r1c2; StFcatEffect: test r1c1, r1c2; StatusEffect: test r1; FcatEffect: test c1 , c2; run; proc reg data=mdummy; /* ss(alpha, beta) */ model conform = r1 c1 c2; StatusEffect: test r1; FcatEffect: test c1, c2; run; proc reg data=mdummy; /* ss(alpha, gamma) */ model conform = r1 r1c1 r1c2; run; proc reg data=mdummy; /* ss(beta, gamma) */ model conform = c1 c2 r1c1 r1c2; run; proc reg data=mdummy; /* ss(alpha) */ model conform =c1 c2; run; proc reg data=mdummy; /* ss(beta) */ model conform = r1; run; quit;The REG Procedure Model: MODEL1 Dependent Variable: conform
Analysis of Variance
Sum of Mean Source DF Squares Square F Value Pr > F
Model 5 391.43604 78.28721 3.73 0.0074 Error 39 817.76396 20.96831 Corrected Total 44 1209.20000
...(more results)
Test STATUSEFFECT Results for Dependent Variable conform
Mean Source DF Square F Value Pr > F Numerator 2 87.74446 4.18 0.0226 Denominator 39 20.96831
Test STATUSEFFECT Results for Dependent Variable conform
Mean Source DF Square F Value Pr > F Numerator 1 239.56237 11.42 0.0017 Denominator 39 20.96831
Test FCATEFFECT Results for Dependent Variable conform
Mean Source DF Square F Value Pr > F Numerator 2 18.00935 0.86 0.4315 Denominator 39 20.96831
The REG Procedure Model: MODEL1 Dependent Variable: conform
Analysis of Variance
Sum of Mean Source DF Squares Square F Value Pr > F Model 3 215.94711 71.98237 2.97 0.0428 Error 41 993.25289 24.22568 Corrected Total 44 1209.20000
...(more results)
Test STATUSEFFECT Results for Dependent Variable conform
Mean Source DF Square F Value Pr > F Numerator 1 212.21378 8.76 0.0051 Denominator 41 24.22568
Test FCATEFFECT Results for Dependent Variable conform
Mean Source DF Square F Value Pr > F Numerator 2 5.80735 0.24 0.7879 Denominator 41 24.22568
The REG Procedure Model: MODEL1 Dependent Variable: conform
Analysis of Variance
Sum of Mean Source DF Squares Square F Value Pr > F Model 3 355.41733 118.47244 5.69 0.0024 Error 41 853.78267 20.82397 Corrected Total 44 1209.20000 ...(more results)
The REG Procedure Model: MODEL1 Dependent Variable: conform
Analysis of Variance
Sum of Mean Source DF Squares Square F Value Pr > F Model 4 151.87367 37.96842 1.44 0.2398 Error 40 1057.32633 26.43316 Corrected Total 44 1209.20000 ...(more results)
The REG Procedure Model: MODEL1 Dependent Variable: conform
Analysis of Variance
Sum of Mean Source DF Squares Square F Value Pr > F Model 2 3.73333 1.86667 0.07 0.9371 Error 42 1205.46667 28.70159 Corrected Total 44 1209.20000 ...(more results)
The REG Procedure Model: MODEL1 Dependent Variable: conform
Analysis of Variance
Sum of Mean Source DF Squares Square F Value Pr > F Model 1 204.33241 204.33241 8.74 0.0050 Error 43 1004.86759 23.36901 Corrected Total 44 1209.20000 ...(more results)
Section 8.4. Analysis of Covariance
Formula (8.14) on page 192 on data file moore following the coding scheme in the book.
data moore_cd; set moore; if status='high' then D=0; if status='low' then D=1; dfscore=D*fscore; run;proc reg data=moore_cd; model conform =fscore D dfscore; run; quit;
Memory Experiment of Friendly and Franklin 56 The REG Procedure Model: MODEL1 Dependent Variable: conform Analysis of Variance
Sum of Mean Source DF Squares Square F Value Pr > F Model 3 355.78263 118.59421 5.70 0.0023 Error 41 853.41737 20.81506 Corrected Total 44 1209.20000
Root MSE 4.56235 R-Square 0.2942 Dependent Mean 12.13333 Adj R-Sq 0.2426 Coeff Var 37.60180
Parameter Estimates
Parameter Standard Variable DF Estimate Error t Value Pr > |t| Intercept 1 20.79348 3.26273 6.37 <.0001 fscore 1 -0.15110 0.07171 -2.11 0.0413 D 1 -15.53408 4.40045 -3.53 0.0010 dfscore 1 0.26110 0.09700 2.69 0.0102
Formula [8.16] on page 194 using data file moore and the coding scheme in the book.
data moore1; set moore; if status ='high' then S=-1; if status='low' then S=1; intf=S*fscore; run; proc reg data=moore1; model conform= S fscore intf ; run; quit;The REG Procedure Model: MODEL1 Dependent Variable: conform
Analysis of Variance
Sum of Mean Source DF Squares Square F Value Pr > F
Model 3 355.78263 118.59421 5.70 0.0023 Error 41 853.41737 20.81506 Corrected Total 44 1209.20000
Root MSE 4.56235 R-Square 0.2942 Dependent Mean 12.13333 Adj R-Sq 0.2426 Coeff Var 37.60180
Parameter Estimates
Parameter Standard Variable DF Estimate Error t Value Pr > |t|
Intercept 1 13.02644 2.20022 5.92 <.0001 S 1 -7.76704 2.20022 -3.53 0.0010 fscore 1 -0.02055 0.04850 -0.42 0.6740 intf 1 0.13055 0.04850 2.69 0.0102
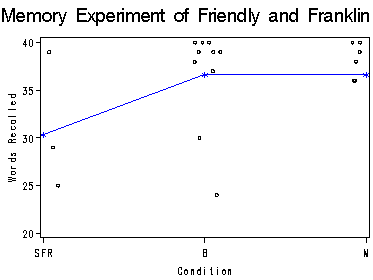
Table in the middle of page 197 and Figure 8.8 at top of page 198 using data file friendly.
proc means data=friendly; class cond; var correct; output out=out mean=m; run; data mout; set out; drop _FREQ_ _TYPE_; if _type_=1; run; data frdly; set friendly; if cond = 'SFR' then D=0; if cond = 'Before' then D=1; if cond = 'Meshed' then D=2; retain seed 0; Dc=D + 0.2*(Ranuni(seed)-0.5); drop seed; run; proc sort data=frdly; by cond; proc sort data=mout; by cond; run; data merout; merge mout frdly; by cond; run; proc sort data=merout; by D; run; title 'Memory Experiment of Friendly and Franklin'; axis1 order=(0 to 2 by 1) value=(tick=1 'SFR' tick=2 'B' tick=3 'M'); axis2 order=(20 to 40 by 5) label=(r=0 a=90); symbol1 c=black i=none v=circle h=0.5; symbol2 c=blue i=jone v=star h=1.0 ; proc gplot data=merout; plot correct*Dc=1 m*D=2 /overlay haxis=axis1 vaxis=axis2 hminor=0 vminor=0; label Dc='Condition'; label correct='Words Recalled'; run; quit;The MEANS Procedure
Analysis Variable : correct
N cond Obs N Mean Std Dev Minimum Maximum ------------------------------------------------------------------------------------- Before 10 10 36.6000000 5.3374984 24.0000000 40.0000000
Meshed 10 10 36.6000000 3.0258149 30.0000000 40.0000000
SFR 10 10 30.3000000 7.3340909 21.0000000 39.0000000 -------------------------------------------------------------------------------------

Regression and ANOVA on data file friendly on page 199.
data friendly1; set friendly; if cond='SFR' then do c1=1; c2=0; end; if cond='Before' then do c1=-0.5; c2=1; end; if cond='Meshed' then do c1=-0.5; c2=-1; end; output; run;proc glm data=friendly1; model correct=c1 c2; run; quit;
The GLM Procedure Number of observations 30 The GLM Procedure
Dependent Variable: correct
Sum of Source DF Squares Mean Square F Value Pr > F Model 2 264.600000 132.300000 4.34 0.0232
Error 27 822.900000 30.477778
Corrected Total 29 1087.500000 R-Square Coeff Var Root MSE correct Mean 0.243310 16.00194 5.520668 34.50000 Source DF Type I SS Mean Square F Value Pr > F c1 1 264.6000000 264.6000000 8.68 0.0065 c2 1 0.0000000 0.0000000 0.00 1.0000 Source DF Type III SS Mean Square F Value Pr > F c1 1 264.6000000 264.6000000 8.68 0.0065 c2 1 0.0000000 0.0000000 0.00 1.0000 Standard Parameter Estimate Error t Value Pr > |t| Intercept 34.50000000 1.00793151 34.23 <.0001 c1 -4.20000000 1.42543041 -2.95 0.0065 c2 0.00000000 1.23445895 0.00 1.0000
