In this chapter we will be using the hmohiv data set.
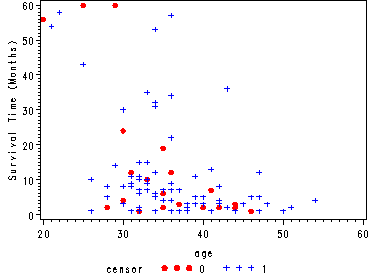
Fig. 1.1, p. 6.
Scatterplot of survival time versus age.
goptions reset=all;
symbol1 v=dot c=red h=.8;
symbol2 v=plus c=blue h=.8;
axis1 label=(a=90 'Survival Time (Months)');

proc gplot data=hmohiv;
  plot time*age=censor / vaxis=axis1;
run;
quit;
Creating the new variable agenew = 1000/age to be used in fig. 1.2, p. 7
data hmohiv;
  set hmohiv;
  agenew = 1000/age;
run;
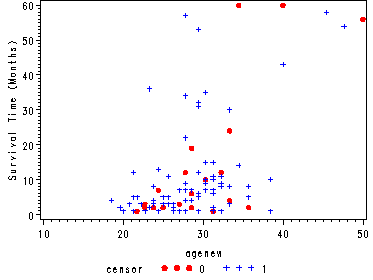
Fig. 1.2, p. 7.
Scatterplot of survival time versus 1000/age.
goptions reset=all;
symbol1 v=dot c=red h=.8;
symbol2 v=plus c=blue h=.8;
axis1 label=(a=90 'Survival Time (Months)');

proc gplot data=hmohiv;
  plot time*agenew=censor / vaxis=axis1;
run;
quit;
Table 1.2, p. 14.
The log-time exponential regression model with only age in the model.
proc lifereg data=hmohiv;
  model time*censor(0)=age / dist=exponential;
run;

       Type III Analysis of Effects

                         Wald
Effect       DF    Chi-Square    Pr > ChiSq
age           1       35.4686        <.0001


                    Analysis of Parameter Estimates

                          Standard   95% Confidence     Chi-
Parameter     DF Estimate    Error       Limits       Square Pr > ChiSq
Intercept      1   5.8590   0.5853   4.7119   7.0061  100.22     <.0001
age            1  -0.0939   0.0158  -0.1248  -0.0630   35.47     <.0001
Scale          0   1.0000   0.0000   1.0000   1.0000
Weibull Shape  0   1.0000   0.0000   1.0000   1.0000

    Lagrange Multiplier Statistics

Parameter     Chi-Square    Pr > ChiSq
Scale             0.0180        0.8932
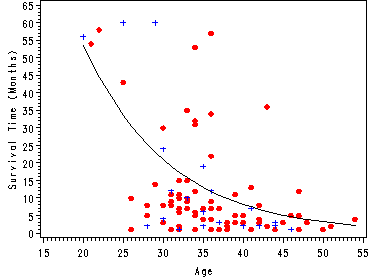
Fig. 1.3, p. 16.
Scatterplot of survival time versus age with the fitted values from the exponential regression model in table 1.2.
Note: In order to calculate the fitted values we use the equation from the middle of p. 15. Since we are going to use the overlay option in proc gplot we need to create separate variables for age, one variable for each level of censor. Then we sort on the dataset on age so that the predicted value t_hat will form one line in the graph.
data hmohiv;
  set hmohiv;
  if censor=0 then age0=age;
  if censor=1 then age1=age;
  t_hat = exp(5.859 - .094*age);
run;
proc sort data=hmohiv;
  by age;
run;

goptions reset=all;
symbol1 v=dot c=red h=.8;
symbol2 v=plus c=blue h=.8;
symbol3 i=j v=none;
axis1 label=(a=90 'Survival Time (Months)') order=(0 to 65 by 5);
axis2 order=(15 to 55 by 5) label=('Age');

proc gplot data=hmohiv;
  plot time*(age1 age0) t_hat*age/ overlay vaxis=axis1 haxis=axis2;
run;
quit;


