In this chapter we will be using the hmohiv and the uis data sets.
Creating all the dummy variables for the covariates in the UIS data.
data uis;
  set uis;
  hercoc1 = (hercoc=1);
  hercoc2 = (hercoc=2);
  hercoc3 = (hercoc=3);
  hercoc4 = (hercoc=4);
  ivhx1 = (ivhx = 1);
  ivhx2 = (ivhx = 2);
  ivhx3 = (ivhx = 3);
  agecat = 0;
  if age < 28 then agecat = 1;
  else if age < 33 then agecat = 2;
  else if age < 38 then agecat = 3;
  else agecat = 4;
  agecat1 = (age < 28);
  agecat2 = (age >= 28 & age < 33);
  agecat3 = (age >= 33 & age < 38);
  agecat4  = (age >= 38);
  beckcat = 0;
  if becktota < 10 then beckcat = 1;
  else if becktota < 15 then beckcat = 2;
  else if becktota < 25 then beckcat = 3;
  else beckcat = 4;
  beckcat1 = (becktota < 10);
  beckcat2 = (becktota >= 10 & becktota < 15);
  beckcat3 = (becktota >= 15 & becktota < 25);
  beckcat4 = (becktota >= 25);
  drugcat = 0;
  if ndrugtx < 2 then drugcat  = 1;
  else if ndrugtx < 4 then drugcat  = 2;
  else if ndrugtx < 7 then drugcat  = 3;
  else drugcat = 4;
  drugcat1 = (ndrugtx < 2);
  drugcat2 = (ndrugtx >= 2 & ndrugtx < 4);
  drugcat3 = (ndrugtx >= 4 & ndrugtx < 7);
  drugcat4 = (ndrugtx >= 7);
run;
Table 5.1, p. 166.
Estimated median time to drug use and Log Rank test for categorical covariates in the UIS data.
proc lifetest data=uis;
  time time*censor(0);
  strata hercoc;
run;

<output omitted>

       Test of Equality over Strata
                                   Pr >
Test      Chi-Square      DF    Chi-Square
Log-Rank     14.7196       2      0.0006

             Quartile Estimates

 Stratum 1: hercoc = 1

             Point     95% Confidence Interval
Percent    Estimate      [Lower      Upper)
     50      150.00      106.00      196.00

 Stratum 2: hercoc = 2

             Point     95% Confidence Interval
Percent    Estimate      [Lower      Upper)
     50      146.50      110.00      184.00

 Stratum 3: hercoc = 3

             Point     95% Confidence Interval
Percent    Estimate      [Lower      Upper)
     50      184.50      148.00      226.00

 Stratum 4: hercoc = 4

             Point     95% Confidence Interval
Percent    Estimate      [Lower      Upper)
     50      181.00      154.00      220.00

proc lifetest data=uis;
  time time*censor(0);
  strata ivhx;
run;

<output omitted>

       Test of Equality over Strata
                                   Pr >
Test      Chi-Square      DF    Chi-Square
Log-Rank     14.7196       2      0.0006

             Quartile Estimates

 Stratum 1: ivhx = 1

             Point     95% Confidence Interval
Percent    Estimate      [Lower      Upper)
     50      194.00      171.00      228.00

 Stratum 2: ivhx = 2

             Point     95% Confidence Interval
Percent    Estimate      [Lower      Upper)
     50      170.00      130.00      226.00

 Stratum 3: ivhx = 3

             Point     95% Confidence Interval
Percent    Estimate      [Lower      Upper)
     50      147.50      115.00      168.00

proc lifetest data=uis;
  time time*censor(0);
  strata race;
run;

<output omitted>

       Test of Equality over Strata
                                   Pr >
Test      Chi-Square      DF    Chi-Square
Log-Rank      7.2836       1      0.0070

             Quartile Estimates

 Stratum 1: race = 0

             Point     95% Confidence Interval
Percent    Estimate      [Lower      Upper)
     50      152.00      124.00      174.00

 Stratum 2: race = 1

             Point     95% Confidence Interval
Percent    Estimate      [Lower      Upper)
     50      193.00      164.00      232.00

proc lifetest data=uis;
  time time*censor(0);
  strata treat;
run;

<output omitted>

       Test of Equality over Strata
                                   Pr >
Test      Chi-Square      DF    Chi-Square
Log-Rank      6.7979       1      0.0091

             Quartile Estimates

 Stratum 1: treat = 0

             Point     95% Confidence Interval
Percent    Estimate      [Lower      Upper)
     50      131.50      113.00      154.00

 Stratum 2: treat = 1

             Point     95% Confidence Interval
Percent    Estimate      [Lower      Upper)
     50      192.00      175.00      226.00

proc lifetest data=uis;
  time time*censor(0);
  strata site;
run;

<output omitted>

       Test of Equality over Strata
                                   Pr >
Test      Chi-Square      DF    Chi-Square
Log-Rank      2.3658       1      0.1240

             Quartile Estimates

 Stratum 1: site = 0

             Point     95% Confidence Interval
Percent    Estimate      [Lower      Upper)
     50      156.00      131.00      174.00

 Stratum 2: site = 1

             Point     95% Confidence Interval
Percent    Estimate      [Lower      Upper)
     50      199.00      159.00      231.00

proc lifetest data=uis;
  time time*censor(0);
  strata agecat;
run;

<output omitted>

       Test of Equality over Strata
                                   Pr >
Test      Chi-Square      DF    Chi-Square
Log-Rank      3.9295       3      0.2692

             Quartile Estimates

 Stratum 1: agecat = 1

             Point     95% Confidence Interval
Percent    Estimate      [Lower      Upper)
     50      144.00      121.00      190.00

 Stratum 2: agecat = 2

             Point     95% Confidence Interval
Percent    Estimate      [Lower      Upper)
     50      148.00      123.00      180.00

 Stratum 3: agecat = 3

             Point     95% Confidence Interval
Percent    Estimate      [Lower      Upper)
     50      163.00      121.00      207.00

 Stratum 4: agecat = 4

             Point     95% Confidence Interval
Percent    Estimate      [Lower      Upper)
     50      189.00      162.00      242.00

proc lifetest data=uis;
  time time*censor(0);
  strata beckcat;
run;

<output omitted>

       Test of Equality over Strata
                                   Pr >
Test      Chi-Square      DF    Chi-Square
Log-Rank      1.6152       3      0.6559

             Quartile Estimates

 Stratum 1: beckcat = 1

             Point     95% Confidence Interval
Percent    Estimate      [Lower      Upper)
     50      170.00      129.00      211.00

 Stratum 2: beckcat = 2

             Point     95% Confidence Interval
Percent    Estimate      [Lower      Upper)
     50      169.50      130.00      220.00

 Stratum 3: beckcat = 3

             Point     95% Confidence Interval
Percent    Estimate      [Lower      Upper)
     50      168.00      137.00      199.00

 Stratum 4: beckcat = 4

             Point     95% Confidence Interval
Percent    Estimate      [Lower      Upper)
     50      145.50      110.00      190.00

proc lifetest data=uis;
  time time*censor(0);
  strata drugcat;
run;

<output omitted>

       Test of Equality over Strata
                                   Pr >
Test      Chi-Square      DF    Chi-Square
Log-Rank     15.2189       3      0.0016

             Quartile Estimates

 Stratum 1: drugcat = 1

             Point     95% Confidence Interval
Percent    Estimate      [Lower      Upper)
     50      175.00      142.00      226.00

 Stratum 2: drugcat = 2

             Point     95% Confidence Interval
Percent    Estimate      [Lower      Upper)
     50      177.00      162.00      207.00

 Stratum 3: drugcat = 3

             Point     95% Confidence Interval
Percent    Estimate      [Lower      Upper)
     50      131.50      106.00      183.00

 Stratum 4: drugcat = 4

             Point     95% Confidence Interval
Percent    Estimate      [Lower      Upper)
     50      123.00      106.00      184.00
Table 5.2, p. 167.
The estimated hazard ratio and partial likelihood ratio test for continuous covariates in the UIS data.
data uis;
  set uis;
  age5 = age/5;
  beck10 = becktota / 10;
  ndrugtx5 = ndrugtx / 5;
run;
proc phreg data=uis;
  model time*censor(0) = age5  / rl;
run;

<output omitted>

                         Analysis of Maximum Likelihood Estimates

               Parameter    Standard                            Hazard   95% Hazard Ratio
Variable  DF    Estimate       Error  Chi-Square  Pr > ChiSq     Ratio   Confidence Limits
age5       1    -0.06432     0.03594      3.2022      0.0735     0.938     0.874     1.006

proc phreg data=uis;
  model time*censor(0) = beck10 / rl;
run;

<output omitted>

                         Analysis of Maximum Likelihood Estimates

               Parameter    Standard                            Hazard   95% Hazard Ratio
Variable  DF    Estimate       Error  Chi-Square  Pr > ChiSq     Ratio   Confidence Limits
beck10     1     0.10962     0.04715      5.4045      0.0201     1.116     1.017     1.224

proc phreg data=uis;
  model time*censor(0) = ndrugtx5 / rl;
run;

<output omitted>

                         Analysis of Maximum Likelihood Estimates

               Parameter    Standard                            Hazard   95% Hazard Ratio
Variable  DF    Estimate       Error  Chi-Square  Pr > ChiSq     Ratio   Confidence Limits
ndrugtx5   1     0.14686     0.03749     15.3470      <.0001     1.158     1.076     1.247
Table 5.3, p. 168.
Proportional hazard model containing all the covariates that were significant at the 20% level in the bivariate analysis.
proc phreg data=uis;
  model time*censor(0) = age becktota ndrugtx hercoc2 hercoc3 hercoc4 ivhx2 ivhx3
                         race treat site;
run;

<output omitted>
                     Analysis of Maximum Likelihood Estimates

                   Parameter      Standard                                  Hazard
Variable    DF      Estimate         Error    Chi-Square    Pr > ChiSq       Ratio
age          1      -0.02887       0.00817       12.4833        0.0004       0.972
becktota     1       0.00834       0.00498        2.8109        0.0936       1.008
ndrugtx      1       0.02837       0.00831       11.6692        0.0006       1.029
hercoc2      1       0.06532       0.15001        0.1896        0.6633       1.067
hercoc3      1      -0.09362       0.16547        0.3201        0.5715       0.911
hercoc4      1       0.02798       0.16028        0.0305        0.8614       1.028
ivhx2        1       0.17439       0.13864        1.5822        0.2084       1.191
ivhx3        1       0.28071       0.14693        3.6501        0.0561       1.324
race         1      -0.20289       0.11669        3.0232        0.0821       0.816
treat        1      -0.23995       0.09437        6.4648        0.0110       0.787
site         1      -0.10249       0.10927        0.8798        0.3483       0.903
Table 5.4, p. 168.
Reduced proportional hazard model (eliminating hercoc1-hercoc3).
proc phreg data=uis;
  model time*censor(0) = age becktota ndrugtx ivhx2 ivhx3 race treat site;
run;

<output omitted>
                     Analysis of Maximum Likelihood Estimates

                   Parameter      Standard                                  Hazard
Variable    DF      Estimate         Error    Chi-Square    Pr > ChiSq       Ratio
age          1      -0.02822       0.00817       11.9285        0.0006       0.972
becktota     1       0.00794       0.00497        2.5541        0.1100       1.008
ndrugtx      1       0.02776       0.00829       11.2265        0.0008       1.028
ivhx2        1       0.19599       0.13721        2.0402        0.1532       1.217
ivhx3        1       0.33280       0.11991        7.7025        0.0055       1.395
race         1      -0.20925       0.11589        3.2598        0.0710       0.811
treat        1      -0.23177       0.09371        6.1169        0.0134       0.793
site         1      -0.09946       0.10854        0.8397        0.3595       0.905
Table 5.5, p. 169.
Further reduced proportional hazard model (eliminating ivhx2).
proc phreg data=uis;
  model time*censor(0) = age becktota ndrugtx ivhx3 race treat site;
run;

<output omitted>
                     Analysis of Maximum Likelihood Estimates

                   Parameter      Standard                                  Hazard
Variable    DF      Estimate         Error    Chi-Square    Pr > ChiSq       Ratio
age          1      -0.02615       0.00805       10.5563        0.0012       0.974
becktota     1       0.00840       0.00495        2.8762        0.0899       1.008
ndrugtx      1       0.02907       0.00821       12.5338        0.0004       1.030
ivhx3        1       0.25612       0.10630        5.8053        0.0160       1.292
race         1      -0.22446       0.11527        3.7922        0.0515       0.799
treat        1      -0.23243       0.09373        6.1488        0.0132       0.793
site         1      -0.08669       0.10786        0.6459        0.4216       0.917
Likelihood test comparing models in table 5.4 and 5.5, p. 169. The test statistic G = 5283.459 - 5281.456 = 2.003. There is only one more predictor in the larger model so the test statistic is compared to a chi-square distribution with one degree of freedom which results in a p-value of .157. So, the larger model is not better than the smaller model and the extra predictor does not improve the fit of the model.
Table 5.6, p. 170. Notice that the coding done in the data step to recode some variables into categorical variables does not take into the account that the variables may have missing values. To correctly use the categorical version of them, we will have to eliminate these missing observations. This is what the where statement in the following procedure for.
proc phreg data=uis;
  where age~=. and becktota~=. and ndrugtx~=. and ivhx~=.;
  model time*censor(0) = agecat2 agecat3 agecat4 beckcat2 beckcat3 beckcat4
                        drugcat2 drugcat3 drugcat4  ivhx3 race treat site;
run;
Analysis of Maximum Likelihood Estimates
                   Parameter      Standard                                  Hazard
Variable    DF      Estimate         Error    Chi-Square    Pr > ChiSq       Ratio
agecat2      1       0.03738       0.13165        0.0806        0.7764       1.038
agecat3      1      -0.24098       0.13123        3.3721        0.0663       0.786
agecat4      1      -0.40041       0.15068        7.0614        0.0079       0.670
beckcat2     1       0.04642       0.15268        0.0924        0.7611       1.048
beckcat3     1       0.10783       0.12496        0.7446        0.3882       1.114
beckcat4     1       0.20975       0.14029        2.2353        0.1349       1.233
drugcat2     1      -0.09153       0.12945        0.4999        0.4795       0.913
drugcat3     1       0.24268       0.13369        3.2953        0.0695       1.275
drugcat4     1       0.37056       0.14043        6.9634        0.0083       1.449
ivhx3        1       0.24173       0.10678        5.1248        0.0236       1.273
race         1      -0.25113       0.11637        4.6571        0.0309       0.778
treat        1      -0.21733       0.09414        5.3297        0.0210       0.805
site         1      -0.08353       0.10846        0.5932        0.4412       0.920
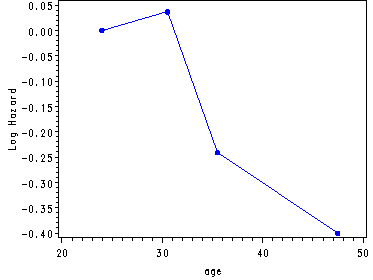
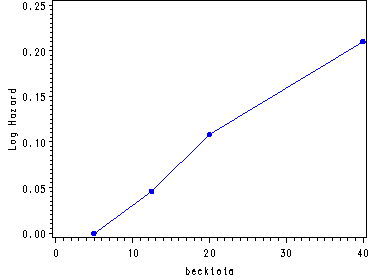
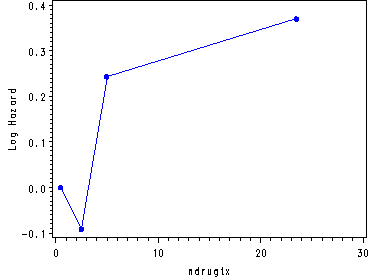
Inputting the values from table 5.6, p. 170 in order to generate fig. 5.1, p. 171.
data midpoints;
 input age c1 becktota c2 ndrugtx c3;
cards;
  24     0    5      0   .5      0
30.5  .037 12.5   .046  2.5  -.091
35.5 -.241   20   .108    5   .243
47.5 -.400   40   .210 23.5   .370
;
run;
goptions reset = all;
symbol c=blue v=dot h=.8 i=j;
axis1 order=(-.4 to .05 by .05) label=(a=90 'Log Hazard');
axis2 order=(0 to .25 by .05) label=(a=90 'Log Hazard');
axis3 order=(-.1 to .4 by .1) label=(a=90 'Log Hazard');
proc gplot data=midpoints;
  plot c1*age / vaxis=axis1;
  plot c2*becktota / vaxis=axis2;
  plot c3*ndrugtx / vaxis=axis3;
run;
quit;
Creating ndrugfp1 and ndrugfp2.
data uis;
  set uis;
  ndrugfp1 = 1/((ndrugtx+1)/10);
  ndrugfp2 = (1/((ndrugtx+1)/10))*log((ndrugtx+1)/10);
run;
Table 5.8, p. 169.
Proportional hazard model including ndrugfp1 and ndrugfp2.
proc phreg data=uis;
  model time*censor(0) = age becktota ndrugfp1 ndrugfp2 ivhx3 race treat site;
run;

<output omitted>
                     Analysis of Maximum Likelihood Estimates

                   Parameter      Standard                                  Hazard
Variable    DF      Estimate         Error    Chi-Square    Pr > ChiSq       Ratio
age          1      -0.02815       0.00813       11.9807        0.0005       0.972
becktota     1       0.00916       0.00499        3.3754        0.0662       1.009
ndrugfp1     1      -0.52284       0.12441       17.6610        <.0001       0.593
ndrugfp2     1      -0.19478       0.04825       16.2999        <.0001       0.823
ivhx3        1       0.25858       0.10802        5.7299        0.0167       1.295
race         1      -0.24220       0.11547        4.3998        0.0359       0.785
treat        1      -0.21084       0.09369        5.0644        0.0244       0.810
site         1      -0.10532       0.10915        0.9310        0.3346       0.900
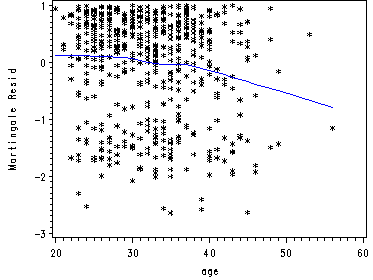
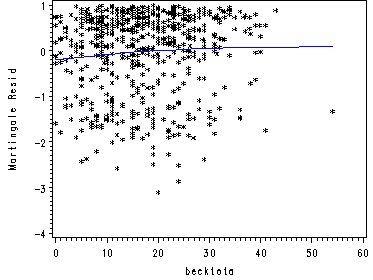
Generating the plots of the martingale residuals and the lowess smoothed residuals. First we run the model in using proc phreg without age. Then we output the martingale residuals using the output statement with a resmart option. Since this data set does not include age because age was not in the model we must merge the outputted data set with a copy of the UIS data set containing age. We choose to merge on time and therefore we sort both data sets on time and then merge them. Then we run the proc loess on the combined data set, regressing age on the martingale residuals with a smoothing factor of 0.65. Then we plot the residuals and the lowess smoothed residuals.
proc phreg data=uis noprint;
  model time*censor(0) = becktota ndrugtx ivhx3 race treat site;
  output out=residuals resmart=resmart;
run;
proc sort data=residuals;
  by time;
run;
data age;
  set uis;
  keep time age;
run;
proc sort data=age;
  by time;
run;
data residage;
  merge residuals age;
  by time;
run;
ods listing close;
proc loess data=residage;
  model resmart = age /smooth=0.65;
  ods output OutputStatistics=myout;
run;
ods listing;
quit;
proc sort data=myout;
  by age;
run;
goptions reset=all;
symbol1 c = black i=none v=star h=0.8;
symbol2 c=blue i=join v=none;
axis label=(a=90 'Martingale Resid');
proc gplot data=myout;
  format DepVar f4.0 age f4.0;
  plot DepVar*age=1 Pred*age=2 /overlay vaxis=axis1 ;
run;
quit;
Fig. 5.3a, p. 176.
Martingal residuals and lowess smoothed residuals.
proc phreg data=uis noprint;
  model time*censor(0) = age ndrugtx ivhx3 race treat site;
  output out=residuals resmart=resmart;
run;
proc sort data=residuals;
  by time;
run;
data becktota;
  set uis;
  keep time becktota;
run;
proc sort data=becktota;
  by time;
run;
data residbeck;
  merge residuals becktota;
  by time;
run;
ods listing close;
proc loess data=residbeck;
  model  resmart = becktota /smooth=0.8;
  ods output OutputStatistics=myout;
  run;
quit;
ods listing;
proc sort data=myout;
  by becktota;
run;
goptions reset=all;
symbol1 c = black i=none v=star h=0.7;
symbol2 c=blue i=join v=none;
axis label=(a=90 'Martingale Resid');
proc gplot data=myout;
  format DepVar f4.0 becktota f4.0;
  plot DepVar*becktota=1 Pred*becktota=2 /overlay vaxis=axis1 ;
run;
quit;
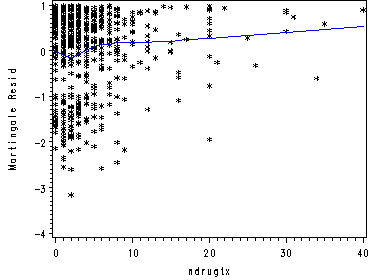
Fig. 5.4a, p. 176.
Martingal residuals and lowess smoothed residuals.
proc phreg data=uis noprint;
  model time*censor(0) = age becktota ivhx3 race treat site;
  output out=residuals resmart=resmart;
run;
proc sort data=residuals;
  by time;
run;
data ndrugtx;
  set uis;
  keep time ndrugtx;
run;
proc sort data=ndrugtx;
  by time;
run;
data residdrug;
  merge residuals ndrugtx;
  by time;
run;
ods listing close;
proc loess data=residdrug;
  model  resmart = ndrugtx /smooth=0.6;
  ods output OutputStatistics=myout;
  run;
quit;
ods listing;
proc sort data=myout;
  by ndrugtx;
run;
goptions reset=all;
symbol1 c = black i=none v=star h=0.8;
symbol2 c=blue i=join v=none;
axis label=(a=90 'Martingale Resid');
proc gplot data=myout;
  format DepVar f4.0 ndrugtx f4.0;
  plot DepVar*ndrugtx=1 Pred*ndrugtx=2 /overlay vaxis=axis1 ;
run;
quit;
Table 5.10, p. 179.
Preliminary interaction variables proportional hazards model.
data interaction;
  set uis;
  agefp1 = age*ndrugfp1  ;
  agefp2 = age*ndrugfp2 ;
  racesite = race*site  ;
  agesite = age*site;
run;
proc phreg data=interaction;
  model time*censor(0) = age becktota ndrugfp1 ndrugfp2 ivhx3 race treat site agefp1
                         agefp2 racesite agesite;
run;

<output omitted>
                     Analysis of Maximum Likelihood Estimates

                   Parameter      Standard                                  Hazard
Variable    DF      Estimate         Error    Chi-Square    Pr > ChiSq       Ratio
treat        1      -0.24205       0.09455        6.5534        0.0105       0.785
site         1      -1.11940       0.54607        4.2021        0.0404       0.326
agefp1       1       0.00163       0.01945        0.0070        0.9332       1.002
agefp2       1      -0.00198       0.00766        0.0670        0.7957       0.998
racesite     1       0.86274       0.24810       12.0919        0.0005       2.370
agesite      1       0.02644       0.01658        2.5437        0.1107       1.027
Table 5.11, p. 179.
Preliminary Final proportional hazard model for UIS data.
proc phreg data=interaction;
  model time*censor(0) = age becktota ndrugfp1 ndrugfp2 ivhx3 race treat site racesite agesite;
run;

<output omitted>
                     Analysis of Maximum Likelihood Estimates

                   Parameter      Standard                                  Hazard
Variable    DF      Estimate         Error    Chi-Square    Pr > ChiSq       Ratio
treat        1      -0.24676       0.09434        6.8416        0.0089       0.781
site         1      -1.31699       0.53144        6.1412        0.0132       0.268
racesite     1       0.85028       0.24776       11.7778        0.0006       2.340
agesite      1       0.03240       0.01608        4.0596        0.0439       1.033
Table 5.15, p. 192.
Using the best subset selection based on the score test by utilizing the option selection = score, the best option specifies that we want only the two best models from each subset, the start and stop options specify that we want to obtain models only from the subsets that contain 5 to 8 predictors.
proc phreg data=interaction;
  model time*censor(0) = age becktota ndrugtx ivhx3 race treat site ivhx2 hercoc1 hercoc2 hercoc3
                          / selection=score best=2 start=5 stop = 8;
run;

<output omitted>

The PHREG Procedure

                         Regression Models Selected by Score Criterion

Number of       Score
Variables  Chi-Square  Variables Included in Model


        5     42.8329  age ndrugtx ivhx3 race treat
        5     42.2824  age ndrugtx ivhx3 treat ivhx2


           6     45.5216  age becktota ndrugtx ivhx3 race treat


           6     44.9214  age ndrugtx ivhx3 race treat ivhx2


           7     47.3567  age becktota ndrugtx ivhx3 race treat ivhx2


           7     47.1510  age becktota ndrugtx ivhx3 race treat hercoc3

        8     48.4974  age becktota ndrugtx ivhx3 race treat ivhx2 hercoc3
        8     47.9901  age becktota ndrugtx ivhx3 race treat site ivhx2

