In this chapter we will be using the hmohiv and the uis data sets.
Fig. 2.1, p. 28.
The first five observations of the hmohiv data set.
data mini;
  set hmohiv;
  if id > 5 then delete;
run;
proc print data=mini;
 var id time censor;
run;

Obs    ID    time    censor
 1      3      8        1
 2      4      3        1
 3      2      6        0
 4      5     22        1
 5      1      5        1
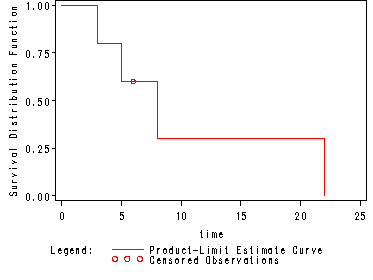
Table 2.2 and fig. 2.1, p. 32.
The estimated survivorship function computed for the mini data set in table 2.1, p. 28.
Note: The graph was generated by using the options plot=(s) where s=survival curve.
proc lifetest data=mini plots=(s);
  time time*censor(0);
run;

<output omitted>

Product-Limit Survival Estimates
                                     Survival
                                     Standard     Number      Number
    time     Survival    Failure      Error       Failed       Left
  0.0000       1.0000           0           0       0           5
  3.0000       0.8000      0.2000      0.1789       1           4
  5.0000       0.6000      0.4000      0.2191       2           3
  6.0000*           .           .           .       2           2
  8.0000       0.3000      0.7000      0.2387       3           1
 22.0000            0      1.0000           0       4           0

NOTE: The marked survival times are censored observations.
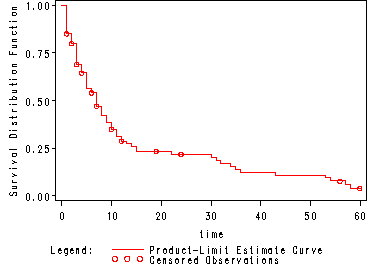
Fig. 2.2, p. 34.
The figure shows the Kaplan-Meier estimate of the survivorship function.
Note: We use the ods output system to create a data set est containing the Kaplan-Meier estimates and the components used in calculating the estimates.
ods listing close;
ods output  ProductLimitEstimates=est;
proc lifetest data=hmohiv plots=(s);
  time time*censor(0);
run;
ods listing;
Table 2.3, p. 35.
Note: The output from proc lifetest has one line of output for each subject. In other words there would be 15 lines of output before the line containing the first estimate. We eliminate this extra output by including a where statement in the proc print stipulating that we do not wish to see the output where there is no Kaplan-Meier estimate.
proc print data=est noobs;
  where survival ne . ;
  var time left failed survival;
run;

<output omitted>

   time    Left    Failed    Survival
  0.0000    100        0        1.0000
  1.0000     85       15        0.8500
  2.0000     78       20        0.7988
  3.0000     63       30        0.6894
  4.0000     57       34        0.6442
  5.0000     49       41        0.5636

 ...

 57.0000      3       79        0.0584
 58.0000      2       80        0.0389
Creating the categorical variable for time.
data hmohivcat;
  set hmohiv;
  if time < 6 then timecat = 6;
  else if time < 12 then timecat = 12;
  else if time < 18 then timecat = 18;
  else if time < 24 then timecat = 24;
  else if time < 30 then timecat = 30;
  else if time < 36 then timecat = 36;
  else if time < 42 then timecat = 42;
  else if time < 48 then timecat = 48;
  else if time < 54 then timecat = 54;
  else if time < 60 then timecat = 60;
  else  timecat = 66;
run;
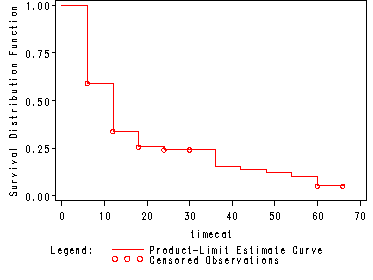
Fig. 2.3, p. 38.
Step function representation of life-table estimate of the survivorship function for the data in table 2.4.
proc lifetest data=hmohivcat plots=(s);
  time timecat*censor(0);
run;
Fig. 2.5, p. 46.
This code is modified from SAS code used in the textbook example Survival Analysis by Klein and Moschberger.
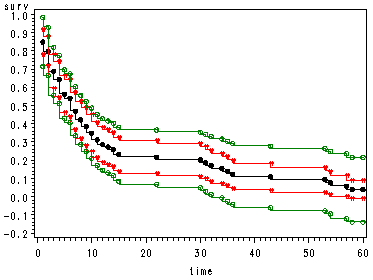
This code was based on the formulas explained in section 4.4 of chapter 4, p. 100-103, and the confidence coefficient, k(aL, aU) = k(.145 .977) = 1.3581 at alpha = .05, was obtained in table C.4 of Appendix C.
The proc means is used to obtain the total number of observations (n=100) and the range of time, time = [0, 60]. The proc lifetest is used to obtain the values of the survival function estimate and the standard error of the survival function estimate at time=1 and time=60 which will be used to calculate sigma^2(1) and sigma^2(60) that are in turn used to calculate aL and aU.
proc means data=hmohiv;
  var time;
run;

proc lifetest data=hmohiv;
  time time*censor(0);
run;

proc sql;
  create table temp1 as
  select  time, sum(censor) as num_event, count(time) as sub_total
  from hmohiv
  group by time;
  quit;
data temp2;
  set temp1 nobs = all;
  total1 = lag(sub_total);
  retain num_left 100; /* total # of obs = 100 */
   if _n_ > 1 then do;
   num_left = - total1 + num_left; end;
   retain surv 1 delta  h sigma2 0;
   surv = surv*(1-num_event/num_left);
   delta= delta + num_event/(num_left*(num_left-num_event));
   var =(surv**2)*delta;
   stderr = var**.5;
   h = h + num_event / num_left;
   sigma2 = sigma2 + num_event /(num_left)**2;
   stderrh = sigma2**.5;
   if num_event~=0 or _n_ = all;
run;

data temp3;
  set temp2;
  if surv ~=. then sigma = stderr / surv;
  md = probit(1-.05/2)*sigma ;
  md2 = 1.3581*(1+100*sigma2)/100**.5; /* 1.3581 = k(.145 .977) at alpha = .05*/
  pointL = surv - md * surv;
  pointU = surv + md * surv;
  hwL = surv - md2*surv;
  hwU = surv + md2*surv;
run;

goptions reset=all;
symbol1 value = dot h=.8  i = stepjr color = black;
symbol2 value = ":" h=.8  i = stepjr color = red;
symbol3 value = ":" h=.8  i = stepjr color = red;
symbol4 value = circle h=.8  i = stepjr color = green;
symbol5 value = circle h=.8  i = stepjr color = green;

proc gplot data=temp3;
 plot (surv pointU pointL hwL hwU )*time /overlay;
run;
quit;
Graph legend:
Black = Kaplan-Meier estimate
Green = Point-wise 95% CI
Red = Hall & Wellner 95% CI.Table 2.5, p. 50.
ods output  ProductLimitEstimates=est;
proc lifetest data=hmohiv;
  time time*censor(0);
run;

<output omitted>

Quartile Estimates

             Point     95% Confidence Interval
Percent    Estimate      [Lower      Upper)
     75     15.0000     10.0000     34.0000
     50      7.0000      5.0000      9.0000
     25      3.0000      2.0000      4.0000
Table 2.6, p. 52.
proc print data=est noobs;
  where  time ge 4 & time le 9 & survival ne .;
  var time failed survival stderr;
run;

    time    Failed    Survival      StdErr
  4.0000      34        0.6442      0.0493
  5.0000      41        0.5636      0.0517
  6.0000      43        0.5406      0.0521
  7.0000      49        0.4701      0.0526
  8.0000      53        0.4219      0.0525
  9.0000      56        0.3857      0.0520
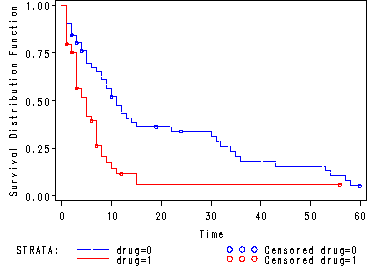
Fig. 2.7, p. 58.
Estimated survivorship functions for each group of drug use.
goptions reset = all;
proc lifetest data=hmohiv plots=(s) noprint;
  time time*censor(0);
  strata drug;
  test age;
run;
Table 2.8, p. 63.
Inputting the mini1 dataset.
data mini1;
  input time drug event;
cards;
 3 0 1
 4 0 0
 5 0 1
22 0 1
34 0 1
 2 1 1
 3 1 1
 4 1 1
 7 1 0
11 1 1
;
run;
proc print data=mini1;
run;

time    drug    event
  3       0       1
  4       0       0
  5       0       1
 22       0       1
 34       0       1
  2       1       1
  3       1       1
  4       1       1
  7       1       0
 11       1       1
Table 2.10, p. 64.
Log-rank and Wilcoxon tests of equality of the survivorship functions across the two drug strata.
proc lifetest data=mini1;
  time time*event(0);
  strata drug;
run;

<output omitted>

Test of Equality over Strata
                                   Pr >
Test      Chi-Square      DF    Chi-Square
Log-Rank      1.5118       1      0.2189
Wilcoxon      1.2500       1      0.2636
-2Log(LR)     1.6489       1      0.1991
Table 2.11, p. 65.
Testing for equality of survivorship functions across drug strata for the hmohiv data.
proc lifetest data=hmohiv;
  time time*censor(0);
  strata drug;
run;

<output omitted>

Test of Equality over Strata
                                   Pr >
Test      Chi-Square      DF    Chi-Square
Log-Rank     11.8556       1      0.0006
Wilcoxon     10.9104       1      0.0010
-2Log(LR)    20.9264       1      <.0001
Creating the categorical variable for age.
data agecat;
  set hmohiv;
  if age le 29 then agecat = 1;
  else if age le 34 then agecat = 2;
  else if age le 39 then agecat = 3;
  else agecat = 4;
run;
Table 2.12, p. 65.
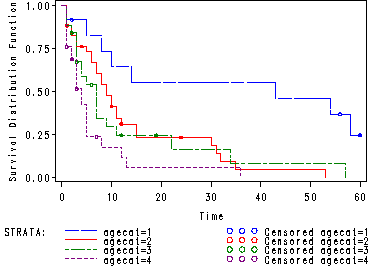
Note: The median and 95% CIE for each stratum is found in the quartile section of the output for each stratum.
goptions reset=all;

proc lifetest data=agecat plots=(s);
  time time*censor(0);
  strata agecat;
  symbol1 c=blue l=12 h=.5;
  symbol2 c=red l=1 h=.5;
  symbol3 c=green l=8 h=.5;
  symbol4 c=purple l=2 h=.5;
run;

<output omitted>

Summary of the Number of Censored and Uncensored Values

                                                            Percent
Stratum          agecat       Total  Failed    Censored    Censored
      1               1          12       8           4       33.33
      2               2          34      29           5       14.71
      3               3          25      20           5       20.00
      4               4          29      23           6       20.69
-------------------------------------------------------------------
  Total                         100      80          20       20.0

             Quartile Estimates

Stratum 1: agecat = 1

             Point     95% Confidence Interval
Percent    Estimate      [Lower      Upper)
     75     58.0000     43.0000       .
     50     43.0000      8.0000       .
     25      8.0000      5.0000     54.0000

Stratum 2: agecat = 2

             Point     95% Confidence Interval
Percent    Estimate      [Lower      Upper)
     75     15.0000     10.0000     32.0000
     50      9.0000      7.0000     12.0000
     25      5.0000      2.0000      8.0000

 Stratum 3: agecat = 3

             Point     95% Confidence Interval
Percent    Estimate      [Lower      Upper)
     75     11.0000      7.0000     34.0000
     50      7.0000      3.0000      9.0000
     25      3.0000      2.0000      5.0000

 Stratum 4: agecat = 4

             Point     95% Confidence Interval
Percent    Estimate      [Lower      Upper)
     75      5.0000      4.0000     13.0000
     50      4.0000      3.0000      5.0000
     25      2.0000      1.0000      3.0000
Tables 2.14, page 70. The tests of the equality of the survivorship function across all strata.
Test of Equality over Strata
                                   Pr >
Test      Chi-Square      DF    Chi-Square
Log-Rank     19.9058       3      0.0002
Wilcoxon     14.1433       3      0.0027
-2Log(LR)    31.3597       3      <.0001
Fig. 2.8, p. 69.
Table 2.17, p. 76.
Note: SAS does not have any built in functionality which will compute the Nelson-Aalen estimates.
proc sql;
  create table temp as
  select  time, sum(censor) as num_event, count(time) as sub_total
  from hmohiv
  group by time;
  quit;
data temp1;
  set temp;
  total1 = lag(sub_total);
  retain num_left 100; /* total obs = 100 */
   if _n_ > 1 then do;
   num_left = - total1 + num_left; end;
   if num_event~=0;
   retain surv 1 ;
   surv = surv*(1-num_event/num_left);
   keep time sub_total num_event num_left surv;
run;
/* Creating the Nelson-Aalen estimator (H tilda) and the Nelson-Aalen
   estimator of the survivorship function (S tilda) */
data temp2;
  set temp1;
  retain h 0;
  h = h + num_event/num_left;
  hsurv = exp(-h);
run;
/* Renaming the sub_total to be called freq, num_event to be d and
   num_left to be n in order to match the names used in the book. */
data temp3;
  set temp2;
  rename sub_total = freq;
  rename num_event = d;
  rename num_left = n;
run;
proc print data = temp3 noobs;
    var time freq d n h hsurv surv;
run;

time    freq     d      n       h        hsurv       surv
  1      17     15    100    0.15000    0.86071    0.85000
  2      10      5     83    0.21024    0.81039    0.79880
  3      12     10     73    0.34723    0.70664    0.68937
  4       5      4     61    0.41280    0.66179    0.64417
  5       7      7     56    0.53780    0.58403    0.56365
  6       3      2     49    0.57862    0.56067    0.54064
  7       7      6     46    0.70905    0.49211    0.47012
  8       4      4     39    0.81162    0.44414    0.42190
  9       3      3     35    0.89733    0.40766    0.38574
 10       4      3     32    0.99108    0.37118    0.34958
 11       3      3     28    1.09822    0.33346    0.31212
 12       4      2     25    1.17822    0.30783    0.28715
 13       1      1     21    1.22584    0.29351    0.27348
 14       1      1     20    1.27584    0.27920    0.25981
 15       2      2     19    1.38111    0.25130    0.23246
 22       1      1     16    1.44361    0.23608    0.21793
 30       1      1     14    1.51503    0.21980    0.20236
 31       1      1     13    1.59196    0.20353    0.18680
 32       1      1     12    1.67529    0.18725    0.17123
 34       1      1     11    1.76620    0.17098    0.15566
 35       1      1     10    1.86620    0.15471    0.14010
 36       1      1      9    1.97731    0.13844    0.12453
 43       1      1      8    2.10231    0.12217    0.10896
 53       1      1      7    2.24517    0.10591    0.09340
 54       1      1      6    2.41183    0.08965    0.07783
 57       1      1      4    2.66183    0.06982    0.05837
 58       1      1      3    2.99517    0.05003    0.03892
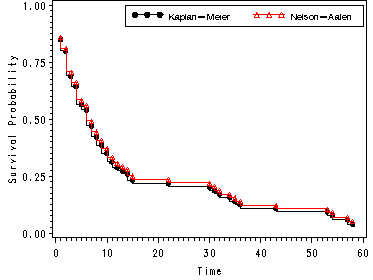
Fig. 2.10, p. 77.
Graphs of the Nelson-Aalen and Kaplan-Meier estimators of the survivorship function from the hmohiv data.
goptions reset=all;
symbol1 value = dot h=.8  i = stepjr color = black;
symbol2 value = triangle h=.8  i = stepjr color = red;
legend1 label=none value=(height=1 font=swiss 'Kaplan-Meier' 'Nelson-Aalen' )
        position=(top right inside) mode=share cborder=black;
axis1 label=(a=90 'Survival Probability') order=(0 to 1.0 by .25);

proc gplot data=temp3;
 plot (surv hsurv )*time /overlay legend=legend1 vaxis=axis1;
run;
quit;
