SAS Textbook Examples
Applied Survival Analysis by D. Hosmer and S. Lemeshow
Chapter 8: Parametric Regression Models
In this chapter we will be using the hmohiv data set.
Table 8.1, p. 278.
Exponential regression model with the predictor drug.
proc lifereg data=hmohiv;
  model time*censor(0) = drug / distribution=exponential;
run;

<output omitted>

Log Likelihood              -146.7920931

       Type III Analysis of Effects

                         Wald
Effect       DF    Chi-Square    Pr > ChiSq
drug          1       22.2338        <.0001


                    Analysis of Parameter Estimates

                          Standard   95% Confidence     Chi-
Parameter     DF Estimate    Error       Limits       Square Pr > ChiSq
Intercept      1   3.0239   0.1543   2.7215   3.3263  384.05     <.0001
drug           1  -1.0557   0.2239  -1.4945  -0.6169   22.23     <.0001
Scale          0   1.0000   0.0000   1.0000   1.0000
Weibull Shape  0   1.0000   0.0000   1.0000   1.0000


    Lagrange Multiplier Statistics

Parameter     Chi-Square    Pr > ChiSq
Scale             0.6405        0.4235
Table 8.2, p. 280.
Exponential regression model with the predictors drug and age.
proc lifereg data=hmohiv;
  model time*censor(0) = age drug / distribution=exponential;
run;

<output omitted>

Log Likelihood              -130.3970822

       Type III Analysis of Effects

                         Wald
Effect       DF    Chi-Square    Pr > ChiSq
age           1       32.3956        <.0001
drug          1       20.3276        <.0001


                    Analysis of Parameter Estimates

                          Standard   95% Confidence     Chi-
Parameter     DF Estimate    Error       Limits       Square Pr > ChiSq
Intercept      1   6.1516   0.6062   4.9635   7.3398  102.98     <.0001
age            1  -0.0921   0.0162  -0.1238  -0.0604   32.40     <.0001
drug           1  -1.0099   0.2240  -1.4489  -0.5709   20.33     <.0001
Scale          0   1.0000   0.0000   1.0000   1.0000
Weibull Shape  0   1.0000   0.0000   1.0000   1.0000


    Lagrange Multiplier Statistics

Parameter     Chi-Square    Pr > ChiSq
Scale             5.2252        0.0223
Fig. 8.4, p. 286.
First we output the estimates of the cumulative distribution function using the cdf option in the output statement. In the following data step we then calculate the Cox-Snell residual. Finally, we use the graphics ability of proc lifetest to plot the graph via the plots options in the proc lifetest statement. Furthermore, by specifying the Cox-Snell residuals as the time variable in the proc lifetest model statement the procedure computes the Kaplan-Meier estimates of the cumulative hazard function and graphs it against the Cox-Snell residuals. The fitted model is correct if the Cox-Snell residual have an exponential distribution, i.e. if the graph is a straight line through the origin and with a slope of 1. For more information on this method of obtaining the graph please consult "Survival Analysis Using the SAS System" by Paul Allison.
proc lifereg data=hmohiv noprint;
  model time*censor(0) = age drug / distribution=exponential;
  output out=exp cdf=f;
run;
data exp1;
  set exp;
  cox = -log( 1-f );
run;
proc lifetest data=exp1 outsurv=surv_exp noprint;
  time cox*censor(0);
run;
data surv_exp;
  set surv_exp;
  ls = -log(survival);
run;
goptions reset=all;
axis1 order=(0 to 4 by 1) minor=none label=('Exponential Reg Model Cum Hazard');
axis2 order=(0 to 4 by 1) minor=none label=( a=90 'Kaplan-Meier Cum Hazard');
symbol1 i=l1p  c= blue v=dot h=.4;
symbol2 i = join c = red l = 3;
proc gplot data=surv_exp;
  plot (ls cox)*cox / overlay haxis=axis1 vaxis= axis2;
run;
quit;
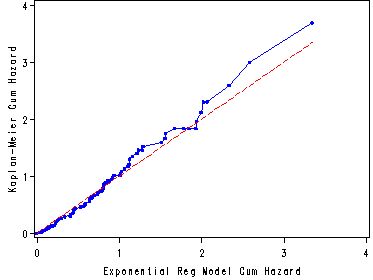
Table 8.4, p. 293.
Weibull regression model with predictors drug and age.
proc lifereg data=hmohiv;
  model time*censor(0) = age drug / distribution=weibull;
run;

<output omitted>

Log Likelihood              -128.5022852

       Type III Analysis of Effects

                         Wald
Effect       DF    Chi-Square    Pr > ChiSq
age           1       44.4377        <.0001
drug          1       30.8226        <.0001


                    Analysis of Parameter Estimates

                          Standard   95% Confidence     Chi-
Parameter     DF Estimate    Error       Limits       Square Pr > ChiSq
Intercept      1   6.1479   0.5107   5.1469   7.1489  144.91     <.0001
age            1  -0.0908   0.0136  -0.1175  -0.0641   44.44     <.0001
drug           1  -1.0492   0.1890  -1.4196  -0.6788   30.82     <.0001
Scale          1   0.8394   0.0722   0.7091   0.9936
Weibull Shape  1   1.1913   0.1025   1.0064   1.4102
Fig. 8.6, p. 297.
Graph of the Kaplan-Meier estimates of the cumulative hazard versus the Weibull regression model estimate of the cumulative hazard based on the model in table 8.4.
proc lifereg data=hmohiv noprint;
  model time*censor(0) = age drug / distribution=weibull;
  output out=weibull cdf=f;
run;
data weibull1;
  set weibull;
  cox = -log( 1-f );
run;
proc lifetest data=weibull1 outsurv=surv_wei noprint;
  time cox*censor(0);
run;
data surv_wei;
  set surv_wei;
  ls = -log(survival);
run;
goptions reset=all;
axis1 order=(0 to 5 by 1) minor=none label=('Weibull Reg Model Cum Hazard');
axis2 order=(0 to 5 by 1) minor=none label=( a=90 'Kaplan-Meier Cum Hazard');
symbol1 i=l1p  c= blue v=dot h=.4;
symbol2 i = join c = red l = 3;
proc gplot data=surv_wei;
  plot (ls cox)*cox / overlay haxis=axis1 vaxis= axis2;
run;
quit;
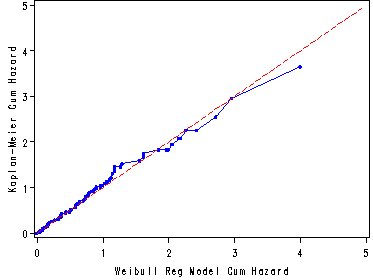
Table 8.5, p. 293.
Log-Logistic regression model with predictors drug and age.
proc lifereg data=hmohiv;
  model time*censor(0) = age drug / distribution=llogistic;
run;

<output omitted>

Log Likelihood              -129.1060635

       Type III Analysis of Effects

                         Wald
Effect       DF    Chi-Square    Pr > ChiSq
age           1       31.9123        <.0001
drug          1       17.4341        <.0001


                    Analysis of Parameter Estimates

                          Standard   95% Confidence     Chi-
Parameter     DF Estimate    Error       Limits       Square Pr > ChiSq
Intercept      1   5.5395   0.5751   4.4123   6.6667   92.78     <.0001
age            1  -0.0874   0.0155  -0.1177  -0.0571   31.91     <.0001
drug           1  -0.8915   0.2135  -1.3099  -0.4730   17.43     <.0001
Scale          1   0.5883   0.0542   0.4911   0.7047
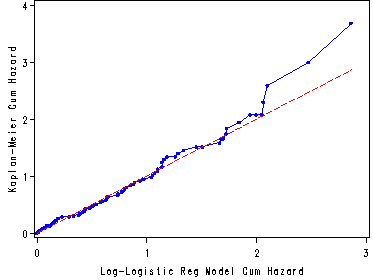
Fig. 8.6, p. 297.
Graph of the Kaplan-Meier estimates of the cumulative hazard versus the log-logistic regression model estimate of the cumulative hazard based on the model in table 8.4.
proc lifereg data=hmohiv noprint;
  model time*censor(0) = age drug / distribution=llogistic;
  output out=llog cdf=f;
run;
data llog1;
  set llog;
  cox = -log( 1-f );
run;
proc lifetest data=llog1 outsurv=surv_llog noprint;
  time cox*censor(0);
run;
data surv_llog;
  set surv_llog;
  ls = -log(survival);
run;
goptions reset=all;
axis1 order=(0 to 3 by 1) minor=none label=('Log-Logistic Reg Model Cum Hazard');
axis2 order=(0 to 4 by 1) minor=none label=( a=90 'Kaplan-Meier Cum Hazard');
symbol1 i=l1p  c= blue v=dot h=.4;
symbol2 i = join c = red l = 3;
proc gplot data=surv_llog;
  plot (ls cox)*cox / overlay haxis=axis1 vaxis= axis2;
run;
quit;