Table 2.1 on page 17. We will enter the data for this example.
data ch2f1;
input subj time censor;
cards;
1 6 1
2 44 1
3 21 0
4 14 1
5 62 1
;
run;

proc print data = ch2f1 noobs;
run;
subj    time    censor

  1       6        1
  2      44        1
  3      21        0
  4      14        1
  5      62        1
Table 2.2, page 20 and Figure 2.1, page 21 using the data we entered above.
proc lifetest data = ch2f1 plot=(s) censoredsymbol=none;
time time*censor(0);
run;
The LIFETEST Procedure

                   Product-Limit Survival Estimates

                                     Survival
                                     Standard     Number      Number
    time     Survival    Failure      Error       Failed       Left

  0.0000       1.0000           0           0       0           5
  6.0000       0.8000      0.2000      0.1789       1           4
 14.0000       0.6000      0.4000      0.2191       2           3
 21.0000*           .           .           .       2           2
 44.0000       0.3000      0.7000      0.2387       3           1
 62.0000            0      1.0000           0       4           0

NOTE: The marked survival times are censored observations.
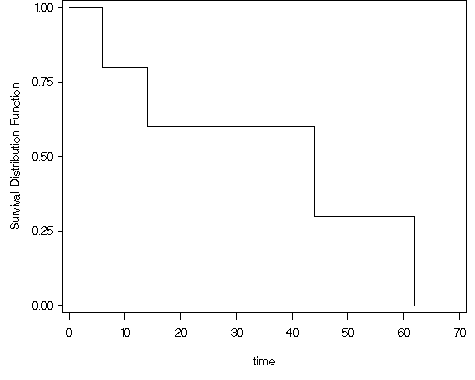
Figure 2.2, page 22 using the whas100 dataset.
data ch2f2;
set whas100;
year = foltime/365.25;
run;

proc lifetest data = ch2f2 plot=(s) cs = none;
time year*folstatus(0);
label year = "Survivial Time (Years)";
run;
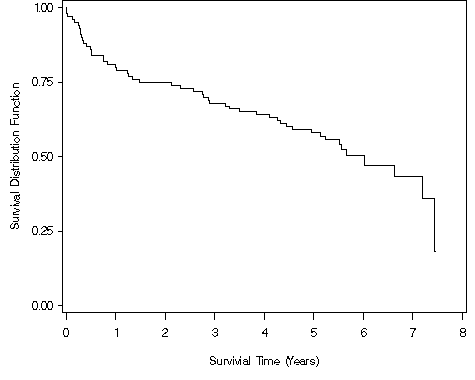
Table 2.3, page 23 using the whas100 dataset as modified in the above example. NOTE: We show two ways of doing this. The first method requires relatively little SAS code, but produces lots of output (some of which we have omitted for space), and does not look like the table presented in the text, although all of the information is in the output. The second method shown below reproduces the table as it appears in the text, but requires considerably more SAS code.
ods select ProductLimitEstimates;
proc lifetest data = ch2f2;
time foltime*folstatus(0);
run;
The LIFETEST Procedure

                   Product-Limit Survival Estimates

                                     Survival
                                     Standard     Number      Number
 FOLTIME     Survival    Failure      Error       Failed       Left

    0.00       1.0000           0           0        0         100
    6.00            .           .           .        1          99
    6.00       0.9800      0.0200      0.0140        2          98
   14.00       0.9700      0.0300      0.0171        3          97
   44.00       0.9600      0.0400      0.0196        4          96
   62.00       0.9500      0.0500      0.0218        5          95

< ... output omitted to save space ... >

 2624.00       0.3606      0.6394      0.0857       50           5
 2631.00*           .           .           .       50           4
 2638.00*           .           .           .       50           3
 2641.00*           .           .           .       50           2
 2710.00       0.1803      0.8197      0.1345       51           1
 2719.00*           .           .           .       51           0
* getting table 2.3, page 23, the hard way;
ods listing close;
ods output ProductLimitEstimates=d1;
proc lifetest data=ch2f2;
time foltime*folstatus(0);
run;
ods listing;

data d2;
set d1;
retain c 0;
retain s 1;
by foltime;
if first.foltime & _n_ >1 then c = censor;
else if _n_ > 1 then c = c + censor;
if survival ~=. then s = survival;
keep foltime failed left c s censor;
if last.foltime;
run;

data d3;
set d2;
flag = lag(failed);
d = failed-flag;
llag = lag(left);
s1 = (llag -d)/llag;
drop flag llag;
run;

proc print data = d3 (obs = 5);
var foltime left d c s1 s;
format s1 8.4 s 8.3;
run;
proc print data = d3 (firstobs = 94 obs=96) noobs;
var foltime left d c s1 s;
format s1 8.4 s 8.3;
run;
 FOLTIME    Left    d    c          s1           s

    0.00    100     .    0       .           1.000
    6.00     98     2    0      0.9800       0.980
   14.00     97     1    0      0.9898       0.970
   44.00     96     1    0      0.9897       0.960
   62.00     95     1    0      0.9896       0.950
 FOLTIME    Left    d    c          s1           s

 2641.00      2     0    1      1.0000       0.361
 2710.00      1     1    0      0.5000       0.180
 2719.00      0     0    1      1.0000       0.180
Table 2.4, page 24 continuing to use the modified whas100 dataset. NOTE: SAS lists a different number of censored observations in the fifth and sixth interval. Hence, the survival estimates are somewhat different from those shown in the text.
proc lifetest data = ch2f2 method = lt;
time year*folstatus(0);
run;
The LIFETEST Procedure

                         Life Table Survival Estimates

                                                                    Conditional
                                          Effective   Conditional   Probability
      Interval        Number    Number      Sample    Probability     Standard
 [Lower,     Upper)   Failed   Censored      Size     of Failure        Error

       0          1     20         0        100.0        0.2000        0.0400
       1          2      5         0         80.0        0.0625        0.0271
       2          3      7         0         75.0        0.0933        0.0336
       3          4      4         0         68.0        0.0588        0.0285
       4          5      6         0         64.0        0.0938        0.0364
       5          6      5        39         38.5        0.1299        0.0542
       6          7      2         0         14.0        0.1429        0.0935
       7          8      2        10          7.0       0.2857        0.1707

                                            Survival    Median     Median
      Interval                              Standard   Residual   Standard
 [Lower,     Upper)   Survival    Failure     Error    Lifetime     Error

       0          1     1.0000          0          0     6.0648     0.6935
       1          2     0.8000     0.2000     0.0400          .          .
       2          3     0.7500     0.2500     0.0433          .          .
       3          4     0.6800     0.3200     0.0466          .          .
       4          5     0.6400     0.3600     0.0480          .          .
       5          6     0.5800     0.4200     0.0494          .          .
       6          7     0.5047     0.4953     0.0532          .          .
       7          8     0.4326     0.5674     0.0656          .          .
Figure 2.3, page 25 continuing to use the modified whas100 dataset.
proc lifetest data = ch2f2 intervals=0 to 8 by 1 method = lt outsurv= temp1 maxtime=8;
time year*folstatus(0);
run;

data temp2;
set temp1 end = last;
output;
if last then do;
year = 8;
output;
end;
run;

goptions reset = all;
axis1 label=(a=90 'Estimated Survival Probability') order=(0 to 1 by .2) minor=none ;
axis2 label=('Survival Time (Years)') minor=none order=(0 to 8 by 2) ;
symbol1 i=steplj;
proc gplot data = temp2;
plot survival*year / overlay vaxis=axis1 haxis=axis2;
run;
quit;
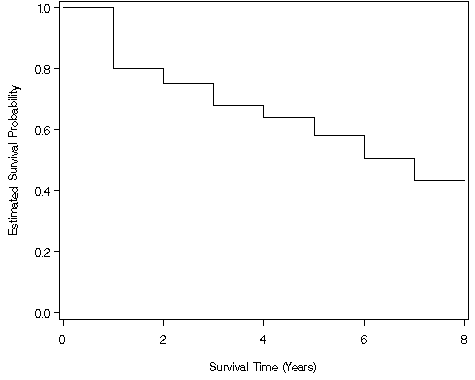
Figure 2.4, page 26 continuing to use the modified whas100 dataset.
proc lifetest data = ch2f2 method = lt plot=(s) cs=none;
time year*folstatus(0);
run;
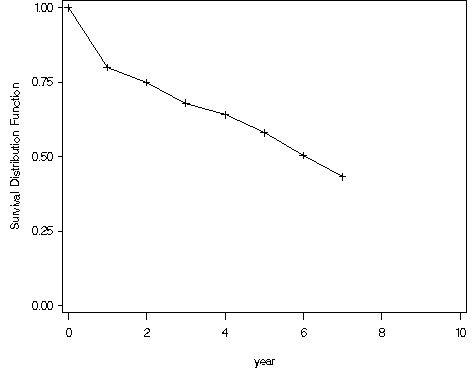
Figure 2.5, page 31 continuing to use the modified whas100 dataset.
proc lifetest data = ch2f2;
time foltime*folstatus(0);
survival out=ch2f5a conftype=loglog confband=hw;
run;

goptions reset = all;
axis1 label=(a=90 'Estimated Survival Probability') order=(0 to 1 by .2) minor=none ;
axis2 label=('Survival Time (Years)') minor=none order=(0 to 2920 by 730)
value=(tick=1 '0' tick=2 '2' tick=3 '4' tick=4 '6' tick=5 '8');
symbol1 i=steplj color=black line=5;
symbol2 i=steplj color=black line=14;
symbol3 i=steplj color=black line=14;
proc gplot data = ch2f5a;
plot (survival sdf_LCL)*foltime / overlay vaxis=axis1 haxis=axis2 legend=legend1;
plot2 sdf_ucl*foltime /overlay vaxis=axis1 noaxis nolegend;
run;
quit;
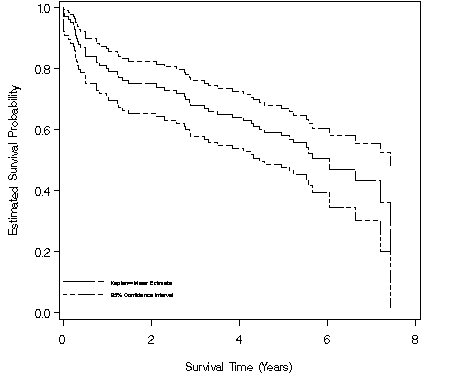
Figure 2.6, page 32 continuing to use the modified whas100 dataset.
proc sort data = ch2f2;
by foltime;
run;

proc lifetest data = ch2f2;
time foltime*folstatus(0);
survival out=ch2f5b conftype=loglog ;
run;

data ch2f5b;
set ch2f5b;
rename SDF_LCL=lcl_loglog SDF_UCL=ucl_loglog;
drop _censor_ CONFTYPE;
run;

proc lifetest data = ch2f2;
time foltime*folstatus(0);
survival out=ch2f5c conftype=log ;

data ch2f5c;
set ch2f5c;
rename SDF_LCL=lcl_log SDF_UCL=ucl_log;
drop _censor_ CONFTYPE;
run;

proc lifetest data = ch2f2;
time foltime*folstatus(0);
survival out=ch2f5d conftype=logit ;

data ch2f5d;
set ch2f5d;
rename SDF_LCL=lcl_logit SDF_UCL=ucl_logit;
drop _censor_ CONFTYPE;
run;

proc lifetest data = ch2f2;
time foltime*folstatus(0);
survival out=ch2f5e conftype=asinsqrt;
run;

data ch2f5e;
set ch2f5e;
rename SDF_LCL=lcl_asinsqrt SDF_UCL=ucl_asinsqrt;
drop _censor_ CONFTYPE;
run;

data ch2f6;
merge ch2f5b ch2f5c ch2f5d ch2f5e;
by foltime;
run;

goptions reset = all;

legend1 label=none value=(h=1.5 font=swiss 'Est. Surv. Pr.' 'Log' 'Log-Log' 'Logit' 'Arcsine'
        'lower logit' 'upper logit' 'lower arcsine' 'upper arcsine')
        position=(bottom left inside) mode=protect across=2;
axis1 label=(a=90 'Estimated Survival Probability') order=(0 to 1 by .2) minor=none ;
axis2 label=('Survival Time (Years)') minor=none order=(0 to 2920 by 730)
value=(tick=1 '0' tick=2 '2' tick=3 '4' tick=4 '6' tick=5 '8');

symbol1 i=steplj line=1 color=black;
symbol2 i=steplj line=4 color=black;
symbol3 i=steplj line=14 color=black;
symbol4 i=steplj line=46 color=black;
symbol5 i=steplj line=41 color=black;

symbol6 i=steplj line=4 color=black;
symbol7 i=steplj line=14 color=black;
symbol8 i=steplj line=46 color=black;
symbol9 i=steplj line=41 color=black;
proc gplot data = ch2f6;
plot (survival lcl_log lcl_loglog lcl_logit lcl_asinsqrt)*foltime / overlay vaxis=axis1 haxis=axis2 legend=legend1;
plot2 (ucl_log ucl_loglog ucl_logit ucl_asinsqrt)*foltime /overlay vaxis=axis1 noaxis nolegend;
run;
quit;
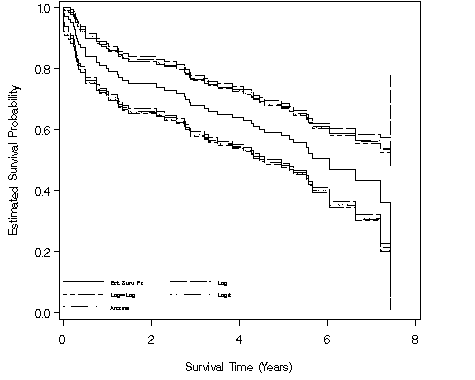
Figure 2.7, page 34 continuing to use the modified whas100 dataset.
proc lifetest data = ch2f2;
time foltime*folstatus(0);
survival out=ch2f5f confband=hw;
run;

goptions reset = all;

legend1 label=none value=(h=1.5 font=swiss 'Est. Surv. Pr.' 'Pointwise 95%' 'Hall & Wellner Band')
        position=(bottom center inside) mode=protect down=3 across=1;
axis1 label=(a=90 'Estimated Survival Probability') order=(0 to 1 by .2) minor=none ;
axis2 label=('Survival Time (Years)') minor=none order=(0 to 2920 by 730)
value=(tick=1 '0' tick=2 '2' tick=3 '4' tick=4 '6' tick=5 '8');
symbol1 i=steplj color=black line=1;
symbol2 i=steplj color=black line=14;
symbol3 i=steplj color=black line=46;
symbol4 i=steplj color=black line=14;
symbol5 i=steplj color=black line=46;
proc gplot data = ch2f5f;
plot (survival sdf_ucl hw_ucl)*foltime / overlay vaxis=axis1 haxis=axis2 legend=legend1;
plot2 (sdf_lcl hw_lcl)*foltime /overlay vaxis=axis1 noaxis nolegend;
run;
quit;
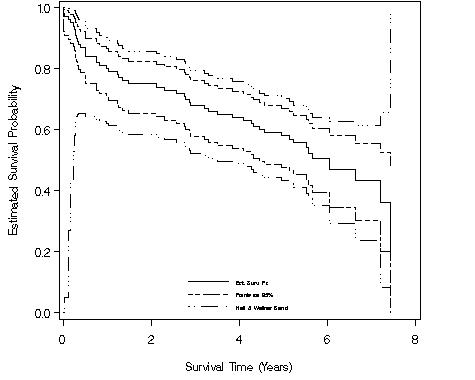
Figure 2.8, page 35 using the dataset entered for Figure 2.1.
goptions reset = all;
proc lifetest data = ch2f1 plots=(s) cs=none;
time time*censor(0);
label time = "Survival Time";
run;
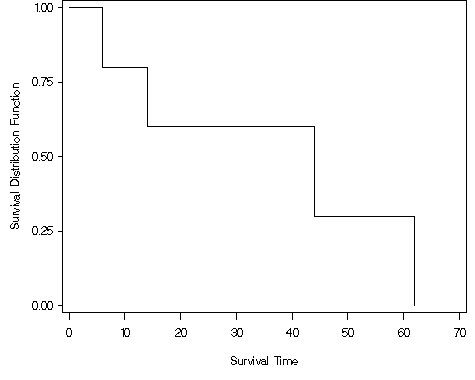
Table 2.5, page 39 using the modified whas100 dataset. NOTE: The SAS output is in a different order than the text. Additionally, SAS computes the 25th percentile as the mean of the event years at at which <=25% and >25% of the subjects have failed (rather that simply last even year where <=25% of the subjects have failed, as is reported in the book) and SAS calculates the confidence intervals differently from the book.
ods select Quartiles;
proc lifetest data = ch2f2;
time year*folstatus(0);
run;
The LIFETEST Procedure

             Quartile Estimates

             Point     95% Confidence Interval
Percent    Estimate      [Lower      Upper)

     75     7.41958     7.18412      .
     50     6.02601     4.56947     7.41958
     25     1.79603     0.75017     3.49897
Table 2.6, page 41 using the modified whas100 dataset.
proc lifetest data = ch2f2;
time year*folstatus(0);
survival out=ch2t6 conftype=loglog stderr;
run;

data ch2t6;
set ch2t6;
std = sqrt(sdf_stderr**2 /((survival*log(survival))**2));
z50 = abs(log(-log(survival))-log(-log(.5)))/std;
run ;

proc print data = ch2t6 noobs;
var year survival z50 sdf_lcl sdf_ucl;
where 4.3 < year < 4.6 or 5.654 < year < 7.6 and sdf_lcl ne .;
format year survival sdf_lcl sdf_ucl f8.3;
format z50 f8.2;
run;
    year    SURVIVAL         z50     SDF_LCL     SDF_UCL

   4.318       0.610        2.09       0.507       0.698
   4.446       0.600        1.91       0.497       0.688
   4.569       0.590        1.73       0.487       0.679
   6.026       0.469        0.52       0.347       0.582
   6.628       0.433        1.04       0.302       0.556
   7.184       0.361        1.66       0.200       0.524
   7.420       0.180        2.08       0.018       0.482
Table 2.7, page 44 using the dataset entered for Figure 2.1.
proc lifetest data = ch2f1;
time time*censor(0);
run;
... output omitted to save space ...

Summary Statistics for Time Variable time

             Quartile Estimates

             Point     95% Confidence Interval
Percent    Estimate      [Lower      Upper)

     75     62.0000     14.0000     62.0000
     50     44.0000      6.0000     62.0000
     25     14.0000      6.0000     62.0000

    Mean    Standard Error

 35.8000           11.8103
data ch2t7;
set ch2f1;
if subj = 5 then censor = 0;
run;

proc lifetest data = ch2t7;
time time*censor(0);
run;
... output omitted to save space ...

Summary Statistics for Time Variable time

             Quartile Estimates

             Point     95% Confidence Interval
Percent    Estimate      [Lower      Upper)

     75       .         14.0000       .
     50     44.0000      6.0000       .
     25     14.0000      6.0000       .

    Mean    Standard Error

 30.4000            9.2278

NOTE: The mean survival time and its standard error were underestimated because
      the largest observation was censored and the estimation was restricted to
      the largest event time.
Figure 2.9, page 46 using the modified whas100 dataset.
goptions reset = all;
proc lifetest data = ch2f2 plots=(s) cs=none;
time foltime*folstatus(0);
strata gender;
run;
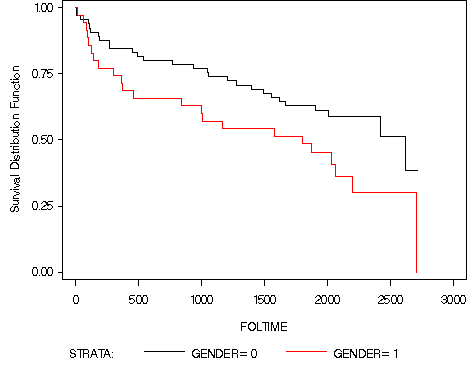
Table 2.10, page 50. We are entering the data for this example.
data ch2t10;
input id female time censor fdead fatrisk tdead tatrisk;
cards;
1 0 6   1 0 5 1 9
2 0 44  0 . . . .
3 0 98  1 1 2 2 4
4 0 114 1 0 0 1 1
5 1 14  1 1 5 1 8
6 1 44  1 1 4 1 7
7 1 89  0 . . . .
8 1 98  1 1 2 2 4
9 1 104 1 1 1 1 2
;
run;

proc sort data = ch2t10;
by time;
run;

data ch2t10a;
set ch2t10;
retain p 1;
n0 = tatrisk - fatrisk;
e1 = (fatrisk*tdead)/tatrisk;
v1 = (fatrisk*n0*tdead*(tatrisk-tdead))/(tatrisk*tatrisk*(tatrisk-1));
L = 1;
t = sqrt(tatrisk);
if tatrisk~=. & id~=8  then p = p*(tatrisk+1-tdead)/(tatrisk+1);
run;
* peto-prentice unmodifed weight is just the survival probability;
proc print data = ch2t10a noobs;
where censor ne 0 and id ne 8;
var time fdead fatrisk tdead tatrisk e1 v1 l tatrisk t p;
format e1 v1 t p f8.3;
run;
time fdead fatrisk tdead tatrisk       e1       v1 L tatrisk        t        p

   6   0      5      1      9       0.556    0.247 1    9       3.000    0.900
  14   1      5      1      8       0.625    0.234 1    8       2.828    0.800
  44   1      4      1      7       0.571    0.245 1    7       2.646    0.700
  98   1      2      2      4       1.000    0.333 1    4       2.000    0.420
 104   1      1      1      2       0.500    0.250 1    2       1.414    0.280
 114   0      0      1      1       0.000     .    1    1       1.000    0.140
Table 2.11, page 51 using the dataset entered for Table 2.10.
ods select HomTests;
proc lifetest data = ch2t10;
time time*censor(0);
strata female / test=(logrank wilcoxon peto tarone);
run;
The LIFETEST Procedure

       Test of Equality over Strata

                                   Pr >
Test      Chi-Square      DF    Chi-Square

Log-Rank      0.4273       1      0.5133
Wilcoxon      0.0750       1      0.7842
Tarone        0.1995       1      0.6551
Peto          0.1050       1      0.7459
Table 2.12, page 51 using the dataset entered for Table 2.10.
ods select HomTests;
proc lifetest data = ch2f2;
time year*folstatus(0);
strata gender / test=(logrank wilcoxon peto tarone);
run;
The LIFETEST Procedure

       Test of Equality over Strata

                                   Pr >
Test      Chi-Square      DF    Chi-Square

Log-Rank      3.9714       1      0.0463
Wilcoxon      3.4624       1      0.0628
Tarone        3.6860       1      0.0549
Peto          3.8507       1      0.0497
Table 2.13, page 52 using the whas100 dataset. Note that SAS computes the median as the mean of the event year at which <= 50% of the subjects have failed and the event year at which >50% of the subjects have failed (rather that simply the last event year where <= 50% of the subjects have failed, as is reported in the book).
data ch2t13; set whas100;
if (age < 60) then agecat = 1;
else if (age < 70) then agecat = 2;
else if (age < 80) then agecat = 3;
else agecat = 4;
year = foltime/365.25;
run;

proc lifetest data = ch2t13;
time year*folstatus(0);
strata agecat;
run;
< ... output omitted to save space ... >
Stratum 1: agecat = 1
             Quartile Estimates

             Point     95% Confidence Interval
Percent    Estimate      [Lower      Upper)

     75      .           .           .
     50      .          4.31759      .
     25     3.83573     2.86927      .
Stratum 2: agecat = 2
             Quartile Estimates

             Point     95% Confidence Interval
Percent    Estimate      [Lower      Upper)

     75      .          7.18412      .
     50     7.18412     7.18412      .
     25     4.56947     0.49829      .
Stratum 3: agecat = 3
             Quartile Estimates

             Point     95% Confidence Interval
Percent    Estimate      [Lower      Upper)

     75     6.62834     5.22108      .
     50     5.08282     2.88569     6.62834
     25     0.75017     0.35044     4.94456
Stratum 4: agecat = 4
             Quartile Estimates

             Point     95% Confidence Interval
Percent    Estimate      [Lower      Upper)

     75     6.02601     5.13073     7.41958
     50     2.43258     0.99384     5.65366
     25     0.40520     0.28474     1.26215

      Summary of the Number of Censored and Uncensored Values

                                                            Percent
Stratum          agecat       Total  Failed    Censored    Censored

      1               1          25       8          17       68.00
      2               2          23       7          16       69.57
      3               3          22      14           8       36.36
      4               4          30      22           8       26.67
-------------------------------------------------------------------
  Total                         100      51          49       49.00
Figure 2.10, page 55 using the modified version of whas100 from Table 13.
proc lifetest data = ch2t13 plots=(s) cs=none;
time year*folstatus(0);
strata agecat / test=(logrank wilcoxon peto tarone);
label year = 'Survival Time (Year)';
symbol1 c=black l=1;
symbol2 c=black l=4;
symbol3 c=black l=14;
symbol4 c=black l=22;
run;
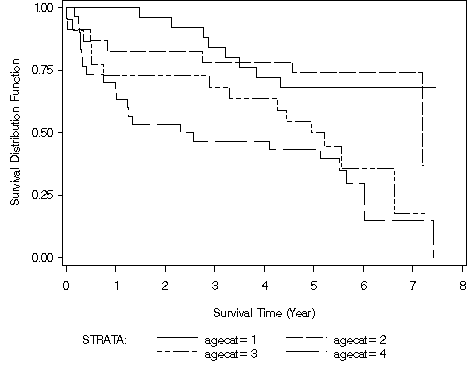
Table 2.15, page 56 using the modified version of whas100 from Table 13.
ods select HomTests;
proc lifetest data = ch2t13;
time year*folstatus(0);
strata agecat / test=(logrank wilcoxon peto tarone);
run;
The LIFETEST Procedure

       Test of Equality over Strata

                                   Pr >
Test      Chi-Square      DF    Chi-Square

Log-Rank     15.5721       3      0.0014
Wilcoxon     12.2981       3      0.0064
Tarone       13.5199       3      0.0036
Peto         14.5352       3      0.0023
Table 2.16, page 57 using the modified whas100 from Table 13. NOTE: The text shows a chi-square test and SAS gives a z-test. You can square the z-score from the table below to get the chi-square values shown in the text.
data ch2t16;
set ch2t13;
if agecat = 1 then agecat1 = 46;
if agecat = 2 then agecat1 = 65;
if agecat = 3 then agecat1 = 75;
if agecat = 4 then agecat1 = 86;
run;
ods select TrendTests;
proc lifetest data = ch2t16;
time year*folstatus(0) ;
strata agecat1 / test=(logrank wilcoxon peto tarone) trend;
run;
                        Trend Tests

                Test      Standard
Test       Statistic         Error       z-Score    Pr > |z|

Log-Rank    383.5416      108.7485        3.5269      0.0004
Wilcoxon  25474.0000     8060.8167        3.1602      0.0016
Tarone     2969.3761      907.7345        3.2712      0.0011
Peto        283.3549       81.5358        3.4752      0.0005
Figure 2.11, page 58 using the bpd dataset.
proc lifetest data = bpd plots=(s) cs=none;
time days*censor(0);
strata suf / test=(logrank wilcoxon peto tarone);
symbol1 c=black l=1;
symbol2 c=black l=4;
label days = 'Days on Oxygen';
run;
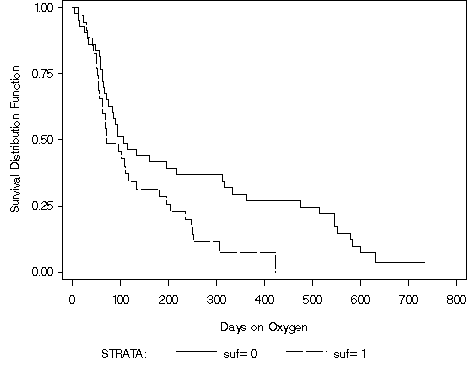
Table 2.17, page 58 using the bpd dataset.
proc lifetest data = bpd;
time days*censor(0);
strata suf / test=(logrank wilcoxon peto tarone);
run;
< ... output omitted to save space ... >
       Test of Equality over Strata

                                   Pr >
Test      Chi-Square      DF    Chi-Square

Log-Rank      5.6180       1      0.0178
Wilcoxon      2.4898       1      0.1146
Tarone        3.6984       1      0.0545
Peto          2.5343       1      0.1114
Figure 2.12, page 61 using the modified version of whas100 from Figure 2.
proc lifetest data = ch2f2;
time foltime*folstatus(0);
survival out=ch2f5a conftype=loglog;
run;
*nelson aalen estimate;
proc phreg data = ch2f2;
model foltime*folstatus(0) = ;
baseline out = ch2f12a survival=sur_nelson lower=low upper=high / method=ch cltype=loglog;
run;

data ch2f12;
merge ch2f5a ch2f12a;
by foltime;
run;

goptions reset = all;
legend1 label=none value=(h=1.5 'Nelson-Aalen' 'N-A Limits' 'Kaplan-Meier' 'K-M Limits')
        position=(bottom left inside) mode=protect down=2 across=2;
axis1 label=(a=90 'Estimated Survival Probability') order=(0 to 1 by .2) minor=none ;
axis2 label=('Survival Time (Years)') minor=none order=(0 to 2920 by 730)
value=(tick=1 '0' tick=2 '2' tick=3 '4' tick=4 '6' tick=5 '8');
symbol1 i=steplj color=black line=1;
symbol2 i=steplj color=black line=5;
symbol3 i=steplj color=black line=14;
symbol4 i=steplj color=black line=40;
symbol5 i=steplj color=black line=14;
symbol6 i=steplj color=black line=40;
proc gplot data = ch2f12;
plot (sur_nelson survival high sdf_ucl )*foltime / overlay vaxis=axis1 haxis=axis2 legend=legend1;
plot2 (low sdf_lcl)*foltime /overlay vaxis=axis1 noaxis nolegend;
run;
quit;
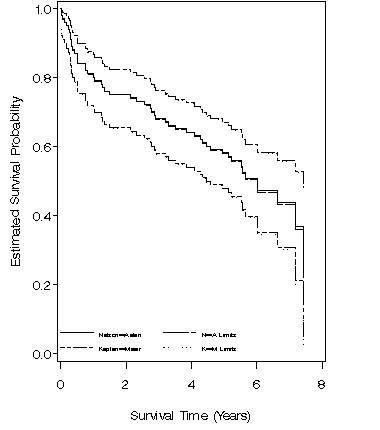
Figure 2.13, page 62 using the modified version of whas100 from Figure 2.
proc phreg data = ch2f2;
model year*folstatus(0) = ;
baseline out = ch2f13 cumhaz=cumhaz;
run;

goptions reset = all;
symbol1 i=steplj color=black line=1;
axis1 label=(a=90 'Nelson-Aalen Estimated Cumulative Hazard Function') order=(0 to 1.5 by .5) minor=none ;
axis2 label=('Survival Time (Years)') minor=none order=(0 to 8 by 2)
value=(tick=1 '0' tick=2 '2' tick=3 '4' tick=4 '6' tick=5 '8');
proc gplot data = ch2f13;
plot cumhaz*year / vaxis=axis1 haxis=axis2;
run;
quit;
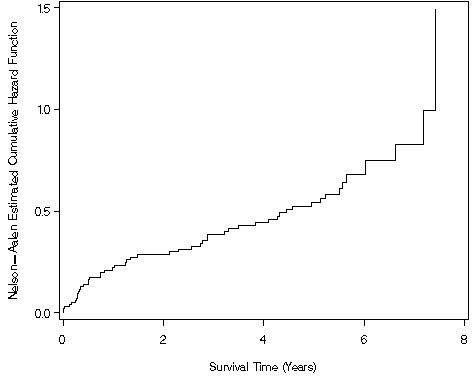
Figure 2.14, page 64
We were unable to reproduce this graph.
