The whas100 , actg320 , gbcs , uis and whas500 data sets are used in this chapter. We frequently use the ods select statement before proc phreg to limit the amount of output produced by SAS.
We have skipped Table 4.1 and Figure 4.1 because they use hypothetical data.
Table 4.2 on page 97 using the whas100 data.
NOTE: The calculations in the data step are necessary to obtain the confidence interval estimates. We do not show this calculation for each example, but the procedure is the same.
ods output ParameterEstimates=out1;
proc phreg data = whas100;
model foltime*folstatus(0) = gender;
run;

data out2;
set out1;
* note that z and z2 are equal;
z = sqrt(chisq);
z2 = estimate /stderr;
lb = estimate-1.96*stderr;
ub = estimate+1.96*stderr;
run;

proc print data = out2 noobs;
var variable estimate stderr z z2 probchisq lb ub;
format estimate z2 probchisq lb ub f8.3;
format stderr f8.4;
run;
                                                  ProbChi
Variable  Estimate    StdErr     z           z2        Sq        lb        ub

 GENDER      0.556    0.2824  1.96735     1.967     0.049     0.002     1.109
Table 4.3 on page 98 using the actg320 data.
ods select ParameterEstimates;
proc phreg data = actg320;
model time*censor(0) = tx;
run;
                  Analysis of Maximum Likelihood Estimates

                 Parameter     Standard                               Hazard
Variable   DF     Estimate        Error   Chi-Square   Pr > ChiSq      Ratio

TX          1     -0.68425      0.21492      10.1365       0.0015      0.504
Table 4.4 on page 99 using the whas100 data.
data whas100rc;
set whas100;
age_2 = 0;
age_3 = 0;
age_4 = 0;
if 60 <= age <=69 then age_2 = 1;
if 70 <= age <=79 then age_3 = 1;
if age => 80 then age_4 = 1;
run;

proc freq data = whas100rc;
tables age_2 age_3 age_4 / missing ;
run;
The FREQ Procedure

                                  Cumulative    Cumulative
age_2    Frequency     Percent     Frequency      Percent
----------------------------------------------------------
    0          77       77.00            77        77.00
    1          23       23.00           100       100.00


                                  Cumulative    Cumulative
age_3    Frequency     Percent     Frequency      Percent
----------------------------------------------------------
    0          78       78.00            78        78.00
    1          22       22.00           100       100.00


                                  Cumulative    Cumulative
age_4    Frequency     Percent     Frequency      Percent
----------------------------------------------------------
    0          70       70.00            70        70.00
    1          30       30.00           100       100.00
Tables 4.5, 4.6, and 4.7 on pages 101 and 102 using the whas100 data with modifications from above example.
ods select ParameterEstimates covb;
proc phreg data = whas100rc;
model foltime*folstatus(0) = age_2 age_3 age_4 / risklimits covb;
run;

/* Table 4.5 */
               Analysis of Maximum Likelihood Estimates

                   Parameter      Standard
Variable    DF      Estimate         Error    Chi-Square    Pr > ChiSq

age_2        1       0.04687       0.51864        0.0082        0.9280
age_3        1       0.98560       0.44537        4.8974        0.0269
age_4        1       1.26299       0.41554        9.2379        0.0024

/* Table 4.6 */
               Analysis of Maximum Likelihood Estimates

              Hazard      95% Hazard Ratio
Variable       Ratio      Confidence Limits

age_2          1.048       0.379       2.896
age_3          2.679       1.119       6.414
age_4          3.536       1.566       7.984

/* Table 4.7 */
Estimated Covariance Matrix

Variable             age_2             age_3             age_4

age_2         0.2689920483      0.1259939719      0.1251236388
age_3         0.1259939719      0.1983540952      0.1260337445
age_4         0.1251236388      0.1260337445      0.1726742158
Table 4.8 on page 105 using the whas100 data.
data whas100dm;
set whas100;
age_2 = 0;
age_3 = 0;
age_4 = 0;
if age < 60 then do;
age_2 = -1;
age_3 = -1;
age_4 = -1;
end;
if 60 <= age <=69 then age_2 = 1;
if 70 <= age <=79 then age_3 = 1;
if age => 80 then age_4 = 1;
run;

ods select ParameterEstimates;
proc phreg data = whas100dm;
model foltime*folstatus(0) = age_2 age_3 age_4;
run;
                 Analysis of Maximum Likelihood Estimates

                 Parameter     Standard                               Hazard
Variable   DF     Estimate        Error   Chi-Square   Pr > ChiSq      Ratio

age_2       1     -0.52700      0.30997       2.8905       0.0891      0.590
age_3       1      0.41174      0.24558       2.8110       0.0936      1.509
age_4       1      0.68913      0.21887       9.9135       0.0016      1.992
Table 4.9 on page 107 using the whas100 data.
ods select ParameterEstimates;
proc phreg data = whas100;
model foltime*folstatus(0) = age;
run;
                  Analysis of Maximum Likelihood Estimates

                 Parameter     Standard                               Hazard
Variable   DF     Estimate        Error   Chi-Square   Pr > ChiSq      Ratio

AGE         1      0.04566      0.01195      14.5989       0.0001      1.047
Table 4.10 on page 107 using the actg320 data.
ods select ParameterEstimates;
proc phreg data = actg320;
model time*censor(0) = cd4;
run;
                  Analysis of Maximum Likelihood Estimates

                 Parameter     Standard                               Hazard
Variable   DF     Estimate        Error   Chi-Square   Pr > ChiSq      Ratio

CD4         1     -0.01619      0.00250      41.8630       <.0001      0.984
Table 4.11 on page 113 using the gbcs data.
data gbcs;
set gbcs;
hormone = hormone - 1; /* coding the variable hormone 0/1 instead of coded 1/2 */
run;

/* crude model */
ods select ParameterEstimates;
proc phreg data = gbcs;
model rectime*censrec(0) = hormone;
run;

               Analysis of Maximum Likelihood Estimates

                 Parameter     Standard                               Hazard
Variable   DF     Estimate        Error   Chi-Square   Pr > ChiSq      Ratio

HORMONE     1     -0.36385      0.12504       8.4669       0.0036      0.695
/* adjusted model */
ods select ParameterEstimates;
proc phreg data = gbcs;
model rectime*censrec(0) = hormone size;
run;

               Analysis of Maximum Likelihood Estimates

                 Parameter     Standard                               Hazard
Variable   DF     Estimate        Error   Chi-Square   Pr > ChiSq      Ratio

HORMONE     1     -0.37347      0.12518       8.9018       0.0028      0.688
SIZE        1      0.01525      0.00356      18.3128       <.0001      1.015

/* interaction model */
ods select ParameterEstimates;
proc phreg data = gbcs;
model rectime*censrec(0) = hormone size hs;
hs=hormone*size;
run;

               Analysis of Maximum Likelihood Estimates

                 Parameter     Standard                               Hazard
Variable   DF     Estimate        Error   Chi-Square   Pr > ChiSq      Ratio

HORMONE     1     -0.39417      0.26019       2.2950       0.1298      0.674
SIZE        1      0.01497      0.00470      10.1284       0.0015      1.015
hs          1    0.0006520      0.00718       0.0082       0.9277      1.001
Table 4.12 on page 114 using the uis data.
data uis1;
set uis;
if ivhxn ne . then drug = (ivhxn ne 1);
run;

/* crude model */
ods select ParameterEstimates;
proc phreg data = uis1;
model time*censor(0) = drug;
where ivhxn ne . and agen ne . ;
run;

                  Analysis of Maximum Likelihood Estimates

                 Parameter     Standard                               Hazard
Variable   DF     Estimate        Error   Chi-Square   Pr > ChiSq      Ratio
drug        1      0.32099      0.09481      11.4623       0.0007      1.378

/* adjusted model */
ods select ParameterEstimates;
proc phreg data = uis1;
model time*censor(0) = drug agen;
where ivhxn ne . and agen ne . ;
run;
               Analysis of Maximum Likelihood Estimates

                   Parameter      Standard
Variable    DF      Estimate         Error    Chi-Square    Pr > ChiSq      HR
drug         1       0.43944       0.10072       19.0377        <.0001   1.552
agen         1      -0.02638       0.00784       11.3236        0.0008   0.974

/* interaction model */
ods select ParameterEstimates;
proc phreg data = uis1;
model time*censor(0) = drug agen da;
da = drug*agen;
where ivhxn ne . and agen ne . ;
run;

               Analysis of Maximum Likelihood Estimates

                   Parameter      Standard
Variable    DF      Estimate         Error    Chi-Square    Pr > ChiSq	   HR
drug         1      -0.01241       0.54845        0.0005        0.9819	0.988
agen         1      -0.03723       0.01523        5.9744        0.0145	0.963
da           1       0.01484       0.01776        0.6985        0.4033	1.015
Table 4.13 on page 116 using the whas500 dataset.
/* crude model */
ods select ParameterEstimates;
proc phreg data = whas500;
model lenfol*fstat(0) = gender;
run;

                  Analysis of Maximum Likelihood Estimates

                 Parameter     Standard                               Hazard
Variable   DF     Estimate        Error   Chi-Square   Pr > ChiSq      Ratio
GENDER      1      0.38126      0.13758       7.6789       0.0056      1.464

/* adjusted model */
ods select ParameterEstimates;
proc phreg data = whas500;
model lenfol*fstat(0) = gender age;
run;

                  Analysis of Maximum Likelihood Estimates

                 Parameter     Standard                               Hazard
Variable   DF     Estimate        Error   Chi-Square   Pr > ChiSq      Ratio
GENDER      1     -0.06556      0.14057       0.2175       0.6410      0.937
AGE         1      0.06683      0.00619     116.3986       <.0001      1.069

/* interaction model */
ods select ParameterEstimates;
proc phreg data = whas500;
model lenfol*fstat(0) = gender age ga;
ga = gender*age;
output out=fig42 xbeta=xbeta;
run;
                  Analysis of Maximum Likelihood Estimates

                 Parameter     Standard                               Hazard
Variable   DF     Estimate        Error   Chi-Square   Pr > ChiSq      Ratio
GENDER      1      2.32852      0.99234       5.5060       0.0190     10.263
AGE         1      0.07840      0.00802      95.5361       <.0001      1.082
ga          1     -0.03043      0.01254       5.8907       0.0152      0.970
Figure 4.2 on page 117 using the data output by the interaction model from the previous example.
proc sort data = fig42;
by gender age;
run;

goptions reset=all;
legend1 label=none value=(h=1.5 justify=left 'Males' 'Females' )
        position=(top left inside) mode=protect down=2 across=1;
axis1 order=(2 to 8 by 1) label=(a=90 'Estimated Log Hazard') minor=none;
axis2 order=(20 to 100 by 20) label=('Age in Years') minor=none;
symbol1 i=join v=none c=black line=1;
symbol2 i=join v=none c=black line=14;
proc gplot data = fig42;
plot xbeta*age=gender / vaxis=axis1 haxis=axis2 legend=legend1;
run;
quit;
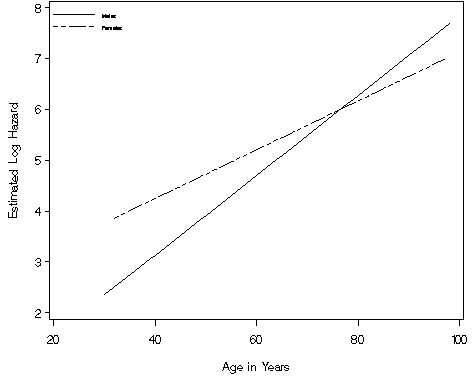
Table 4.14 on page 118 using the whas500 data.
ods output covb = covb;
proc phreg data = whas500;
model lenfol*fstat(0) = gender age ga / covb;
ga = gender*age;
run;
data _null_;
  set covb;
  if _n_= 1 then
    call symput('vgender', gender);
  if _n_ = 3 then do;
    call symput('vga', ga);
    call symput('covga_age', gender);
   end;
run;
* see equation 4.20 on page 112;
data fig43;
  do age =30 to 100 by 5;
   hz = 2.32852 -0.03043*age;
   ul = hz + 1.96*sqrt(&vgender+ age**2*&vga +2*age*&covga_age);
   ll = hz - 1.96*sqrt(&vgender+ age**2*&vga +2*age*&covga_age);
   exphz=exp(hz);
   expul = exp(ul);
   expll =exp(ll);
   output;
  end;
run;

proc print data = fig43 noobs label;
var age exphz expll expul;
where age in (40, 50, 60, 65, 85, 90);
format exphz f8.2;
format expul expll f8.3;
label age='Age' exphz='HR' expll='Lower Limit' expul='Upper Limit';
run;
                      Lower       Upper
Age          HR       Limit       Limit

 40        3.04       1.139       8.106
 50        2.24       1.061       4.736
 60        1.65       0.976       2.799
 65        1.42       0.928       2.173
 85        0.77       0.564       1.059
 90        0.66       0.448       0.983
Figure 4.3 on page 118 using the data generated in the previous example.
NOTE: We were unable to include the right-hand axis because the ticks on the left and right sides of the graph must be at exactly the same height in SAS. We create an annotated legend in order to label both the upper and lower limits of our confidence interval with the same description.
data annolegend;
  length function style color $8 text $20;
  retain xsys ysys '1' when 'a' color 'black';

  function='move';
    x=1;  y=3;  output;
  function='draw';
    x=6;  y=3;  line=33;  output;
  function='label';
    x=7;  y=3;  position='6';
    text='Confidence Limits';
    output;

  function='move';
    x=1;  y=6;  output;
  function='draw';
    x=6;  y=6;  line=1;  output;
  function='label';
    x=7;  y=6;  position='6';
    text='Log Hazard Ratio';
    output;
run;

symbol1 i=join v=none c=black line=1;
symbol2 i=join v=none c=black line=33;
symbol3 i=join v=none c=black line=33;
symbol4 i=none v=none c=black;

axis1 order=(-1 to 2.5 by .5) label=(a=90 'Estimated Log Hazard Ratio')
axis2 order=(20 to 100 by 20) label=('Age in Years') minor=none;

proc gplot data = fig43;
  plot (exphz expul expll)*age / vaxis=axis1 haxis=axis2 overlay vref=0
nolegend annotate=annolegend;
run;
quit;
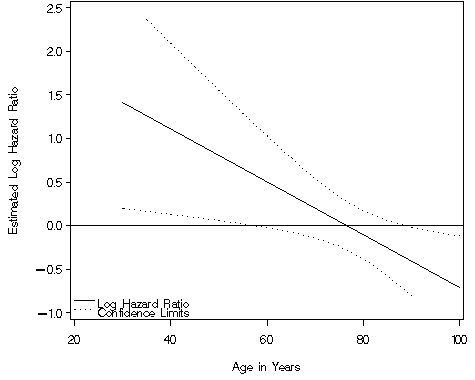
Table 4.15 on page 119 using the gbcs data.
/* crude model */
ods select ParameterEstimates;
proc phreg data = gbcs;
model rectime*censrec(0) = hormone;
run;

                  Analysis of Maximum Likelihood Estimates

                 Parameter     Standard                               Hazard
Variable   DF     Estimate        Error   Chi-Square   Pr > ChiSq      Ratio
HORMONE     1     -0.36385      0.12504       8.4669       0.0036      0.695

/* adjusted model */
ods select ParameterEstimates;
proc phreg data = gbcs;
model rectime*censrec(0) = hormone nodes;
run;

                  Analysis of Maximum Likelihood Estimates

                 Parameter     Standard                               Hazard
Variable   DF     Estimate        Error   Chi-Square   Pr > ChiSq      Ratio
HORMONE     1     -0.35694      0.12522       8.1253       0.0044      0.700
NODES       1      0.05768      0.00666      75.0746       <.0001      1.059

/* interaction model */
ods select ParameterEstimates;
proc phreg data = gbcs;
model rectime*censrec(0) = hormone nodes hn;
hn = hormone*nodes;
run;

                  Analysis of Maximum Likelihood Estimates

                 Parameter     Standard                               Hazard
Variable   DF     Estimate        Error   Chi-Square   Pr > ChiSq      Ratio
HORMONE     1     -0.60600      0.16350      13.7365       0.0002      0.546
NODES       1      0.01105      0.02051       0.2902       0.5901      1.011
hn          1      0.03820      0.01498       6.5046       0.0108      1.039
Table 4.16 on page 120 using the gbcs data.
ods output covb = covb1;
proc phreg data = gbcs;
model rectime*censrec(0) = hormone nodes hn / covb;
hn = hormone*nodes;
run;
proc print data = covb1;
run;
data _null_;
  set covb1;
  if _n_= 1 then
    call symput('vhormone', hormone);
  if _n_ = 3 then do;
    call symput('vhn', hn);
    call symput('covhn_nodes', hormone);
   end;
run;
* see equation 4.20 on page 112;
data fig44;
  do nodes = 1 to 49 by 2;
   hz = -0.60600 + 0.03820*nodes;
   ul = hz + 1.96*sqrt(&vhormone+ nodes**2*&vhn +2*nodes*&covhn_nodes);
   ll = hz - 1.96*sqrt(&vhormone+ nodes**2*&vhn +2*nodes*&covhn_nodes);
   exphz=exp(hz);
   expul = exp(ul);
   expll =exp(ll);
   output;
  end;
run;

proc print data = fig44 noobs label;
where nodes <= 9;
var nodes exphz expll expul;
label nodes='Nodes' exphz='HR' expll='Lower Limit' expul='Upper Limit';
format exphz f8.2;
format expul expll f8.3;
run;
                        Lower       Upper
Nodes          HR       Limit       Limit

  1          0.57       0.419       0.767
  3          0.61       0.466       0.803
  5          0.66       0.513       0.850
  7          0.71       0.558       0.911
  9          0.77       0.598       0.990
Figure 4.4 on page 120 using the data generated in the previous example. Again, we create an annotated legend in order to label both the upper and lower limits of our confidence interval with the same description.
goptions reset=all;

data annolegend1;
  length function style color $8 text $20;
  retain xsys ysys '1' when 'a' color 'black';

  function='move';
    x=1;  y=93;  output;
  function='draw';
    x=6;  y=93;  line=33;  output;
  function='label';
    x=7;  y=93;  position='6';
    text='Confidence Limits';
    output;

function='move';
    x=1;  y=96;  output;
  function='draw';
    x=6;  y=96;  line=1;  output;
  function='label';
    x=7;  y=96;  position='6';
    text='Log Hazard Ratio';
    output;

symbol1 i=join v=none c=black line=1;
symbol2 i=join v=none c=black line=33;
symbol3 i=join v=none c=black line=33;
symbol4 i=none v=none c=black;

axis1 order=(-1 to 3 by 1) label=(a=90 'Estimated Log Hazard Ratio')
      minor=none logbase=e logstyle=power ;
axis2 order=(0 to 50 by 10) label=('Number of nodes involved') minor=none;

proc gplot data = fig44;
  plot (exphz expul expll)*nodes / vaxis=axis1 haxis=axis2 overlay vref=0
                                 nolegend annotate=annolegend1;
run;
quit;
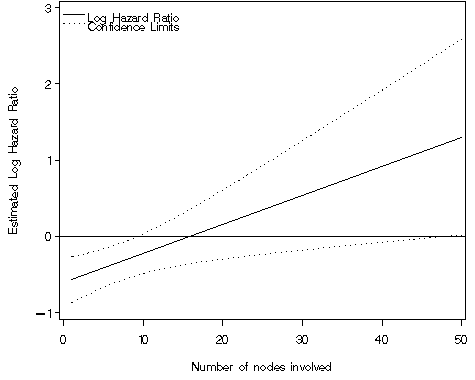
Table 4.17 on page 121 using the gbcs data.
ods select ParameterEstimates;
proc phreg data = gbcs;
model rectime*censrec(0) = hormone;
run;
                  Analysis of Maximum Likelihood Estimates

                 Parameter     Standard                               Hazard
Variable   DF     Estimate        Error   Chi-Square   Pr > ChiSq      Ratio

HORMONE     1     -0.36385      0.12504       8.4669       0.0036      0.695
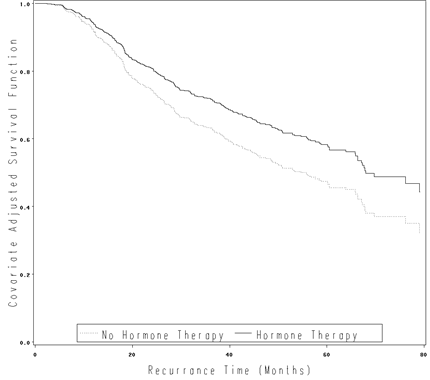
Figure 4.5 on page 123 using the gbcs data.
data gbcs1;
set gbcs;
time = rectime/30;
run;

proc phreg data = gbcs1;
model time*censrec(0) = hormone;
output out = fig45 survival=survival;
run;

proc sort data = fig45;
by hormone time;
run;

goptions reset=all;
axis1 order=(0 to 1 by .2) label=(a=90 'Covariate Adjusted Survival Function') minor=none;
axis2 order=(0 to 80 by 20) label=('Recurrence Time (Months)') minor=none;
symbol1 i=stepjll v=none c=black line=33;
symbol2 i=stepjll v=none c=black line=1;
legend label=none value=('No Hormone Therapy' 'Hormone Therapy')
       position=(bottom inside) mode=share cborder=black;

proc gplot data = fig45;
plot survival*time = hormone /vaxis=axis1 haxis=axis2 legend = legend;
run;
quit;
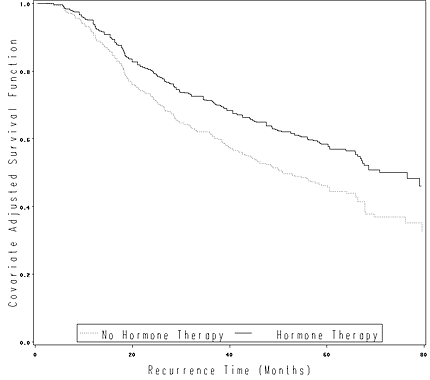
Table 4.18 on page 124 using the gbcs data.
ods select ParameterEstimates;
proc phreg data = gbcs;
model rectime*censrec(0) = hormone size_c;
size_c = size - 25;
run;
                  Analysis of Maximum Likelihood Estimates

                 Parameter     Standard                               Hazard
Variable   DF     Estimate        Error   Chi-Square   Pr > ChiSq      Ratio

HORMONE     1     -0.37347      0.12518       8.9018       0.0028      0.688
size_c      1      0.01525      0.00356      18.3128       <.0001      1.015
Figure 4.6 on page 125 using the gbcs data.
proc phreg data = gbcs;
model rectime*censrec(0) = hormone size_c;
size_c = size - 25;
output out=fig46 survival=survival;
run;

data cov;
  hormone = 0;
  size_c=0;
run;

proc phreg data = gbcs1;
model time*censrec(0) = hormone size_c;
size_c = size - 25;
baseline out=fig46 survival=survival covariates =cov /nomean;
run;

proc sort data = fig46;
  by hormone time;
run;

data fig46_a;
  set fig46;
  survival1 = survival**(exp(-0.37347));
  hormone = 1;
  output;
  set fig46;
  survival1 = survival;
  hormone = 0;
  output;
run;

goptions reset = all;
symbol1 i=join v=none c=black line=33;
symbol2 i=join v=none c=black line=1;
axis1 label=(h=2 a=90 'Covariate Adjusted Survival Function')  minor=none order=(0 to 1 by .2);
axis2  label=(h=2 'Recurrance Time (Months)') minor=none order=(0 to 80 by 20);
legend label=none value=(h=2 'Hormone Therapy' 'No Hormone Therapy')
       position=(bottom inside) mode=share cborder=black;
proc gplot data = fig46_a;
plot survival1*time = hormone /vaxis=axis1 haxis=axis2 legend = legend;
run;
quit;
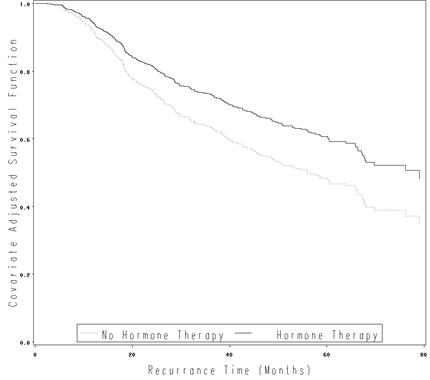
Table 4.19 on page 126 using the modified gbcs data from Figure 4.5.
data gbcs_t419;
set gbcs1;
grade_2 = 0;
grade_3 = 0;
if grade = 2 then grade_2 = 1;
if grade = 3 then grade_3 = 1;
ln_prg = log(prog_recp+1);
run;
ods select ParameterEstimates;
proc phreg data = gbcs_t419;
model rectime*censrec(0) = hormone grade_2 grade_3 size ln_prg;
run;
                  Analysis of Maximum Likelihood Estimates

                 Parameter     Standard                               Hazard
Variable   DF     Estimate        Error   Chi-Square   Pr > ChiSq      Ratio

HORMONE     1     -0.32588      0.12616       6.6718       0.0098      0.722
grade_2     1      0.62436      0.25078       6.1984       0.0128      1.867
grade_3     1      0.62884      0.27583       5.1976       0.0226      1.875
SIZE        1      0.01352      0.00365      13.7242       0.0002      1.014
ln_prg      1     -0.18069      0.03148      32.9423       <.0001      0.835
Figure 4.7 on page 127 using the modified version of gbcs from the previous example.
data c47;
  hormone = 0;
  grade_2 = 0;
  grade_3 = 0;
     size = 0;
   ln_prg = 0;
run;
proc phreg data = gbcs_t419;
model time*censrec(0) = hormone grade_2 grade_3 size ln_prg;
output out = fig47 xbeta=xbeta;
baseline out=fig47_base covariates=c47 survival=survival /nomean;* method = ch;
run;
proc univariate data = fig47;
  var xbeta;
  output out = fig47_a p10=p10 q1=q1 median=q2 q3=q3 p90=p90;
run;
data _null_;
  set fig47_a;
  call symput('p10', p10);
  call symput('p25', q1);
  call symput('p50', q2);
  call symput('p75', q3);
  call symput('p90', p90);
run;
data fig47_base_a;
  set fig47_base;
  s10 = survival**(exp(&p10));
  s25 = survival**(exp(&p25));
  s50 = survival**(exp(&p50));
  s75 = survival**(exp(&p75));
  s90 = survival**(exp(&p90));
run;


goptions reset = all;
symbol1 i=stepjl v=none c=black line=33;
symbol2 i=stepjl v=none c=black line=2;
symbol3 i=stepjl v=none c=black line=1;
symbol4 i=stepjl v=none c=black line=39;
symbol5 i=stepjl v=none c=black line=46;
axis1 label=(h=2 a=90 'Covariate Adjusted Survival Function')  minor=none order=(0 to 1 by .2);
axis2  label=(h=2 'Recurrance Time (Months)') minor=none order=(0 to 100 by 20);
legend label=none value=(h=2 '10th Pctl. of Risk' 'First Quartile of Risk'
						'Second Quartile of Risk' 'Third Quartile of Risk' '90th Pctl. of Risk')
       position=(bottom inside) mode=share cborder=black;
proc gplot data = fig47_base_a;
plot (s10 s25 s50 s75 s90)*time / overlay vaxis = axis1 haxis = axis2 legend = legend;
run;
quit;
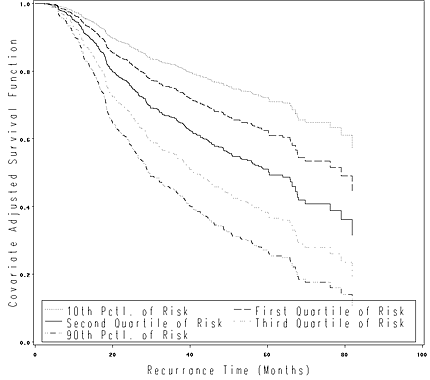
Figure 4.8 on page 129 using the modified gbcs data from the previous example.
data c48;
  hormone = 0;
  grade_2 = 0;
  grade_3 = 0;
     size = 0;
   ln_prg = 0;
run;

proc phreg data = gbcs_t419;
model time*censrec(0) = hormone grade_2 grade_3 size ln_prg;
output out = fig48 xbeta=xbeta;
baseline out=fig48_base covariates=c48 survival=survival / nomean;
run;

data fig48_a;
set fig48;
rm = xbeta-(-0.32588)*hormone;
run;

proc means data = fig48_a;
var rm;
run;

data fig48_b;
set fig48_base;
s0 = survival**exp(0.3428946);
s1 = survival**exp(0.3428946+(-0.32588));
run;

goptions reset = all;
symbol1 i=stepjl v=none c=black line=33;
symbol2 i=stepjl v=none c=black line=1;
axis1 label=(h=2 a=90 'Covariate Adjusted Survival Function')  minor=none order=(0 to 1 by .2);
axis2  label=(h=2 'Recurrance Time (Months)') minor=none order=(0 to 80 by 20);
legend label=none value=(h=2 'No Hormone Therapy' 'Hormone Therapy')
       position=(bottom inside) mode=share cborder=black;
proc gplot data = fig48_b;
plot (s0 s1)*time / overlay vaxis = axis1 haxis = axis2 legend = legend;
run;
quit;
