The whas500 data set is used in this chapter. We will also use a macro written to generate Brookmeyer-Crowley confidence intervals (bcconf) and a macro written to perform likelihood ratio tests (lrtest). Please download these two files, read them over, convert them to SAS programs, and create a filename for each. This will allow us to use %include when we wish to invoke the macros. Then run the %include statement before continuing with the examples.
filename bc "C:bcconf.sas";
filename lr "C:lrtest.sas";
%include bc;
%include lr;
Table 5.1 on page 142 using the whas500 data and the bcconf macro to obtain the Brookmeyer-Crowley confidence intervals.
NOTE: We use the ods select statement to limit the output to just the part presented in the table.
data t51; set whas500;
lf = lenfol / 365.25;
run;

* gender;
ods select CensoredSummary HomTests;
proc lifetest data = t51;
strata gender / test=(logrank) nodetail;
time lf*fstat(0);
run;
The LIFETEST Procedure

      Summary of the Number of Censored and Uncensored Values
                                                            Percent
Stratum          GENDER       Total  Failed    Censored    Censored
      1               0         300     111         189       63.00
      2               1         200     104          96       48.00
-------------------------------------------------------------------
  Total                         500     215         285       57.00

       Test of Equality over Strata
                                   Pr >
Test      Chi-Square      DF    Chi-Square
Log-Rank      7.7911       1      0.0053
%bcconf(t51, lf, fstat, byvar=gender);
Brookmeyer-Crowley 95% Confidence Interval

                                  Lower       Upper
GENDER    total    Estimate       Limit       Limit    bc_lower    bc_upper
   0       111      5.91781     4.44932      .          4.44932      .
   1       104      3.60822     2.47945     4.32603     2.36986     4.32055
* cvd;
ods select CensoredSummary HomTests;
proc lifetest data = t51;
strata cvd / test=(logrank) nodetail;
time lf*fstat(0);
run;
The LIFETEST Procedure

      Summary of the Number of Censored and Uncensored Values
                                                            Percent
Stratum             CVD       Total  Failed    Censored    Censored
      1               0         125      45          80       64.00
      2               1         375     170         205       54.67
-------------------------------------------------------------------
  Total                         500     215         285       57.00


       Test of Equality over Strata
                                   Pr >
Test      Chi-Square      DF    Chi-Square
Log-Rank      2.8615       1      0.0907
%bcconf(t51, lf, fstat, byvar=cvd);
Brookmeyer-Crowley 95% Confidence Interval

                               Lower       Upper
CVD    total    Estimate       Limit       Limit    bc_lower    bc_upper
 0       45      6.44658     4.31781     6.44658     4.31781      .
 1      170      4.32055     3.72329     6.43836     3.72329     5.91781
* afb;
ods select CensoredSummary HomTests;
proc lifetest data = t51;
strata afb / test=(logrank) nodetail;
time lf*fstat(0);
run;
The LIFETEST Procedure

      Summary of the Number of Censored and Uncensored Values
                                                            Percent
Stratum             AFB       Total  Failed    Censored    Censored
      1               0         422     168         254       60.19
      2               1          78      47          31       39.74
-------------------------------------------------------------------
  Total                         500     215         285       57.00


       Test of Equality over Strata
                                   Pr >
Test      Chi-Square      DF    Chi-Square
Log-Rank     10.9000       1      0.0010
%bcconf(t51, lf, fstat, byvar=afb);
Brookmeyer-Crowley 95% Confidence Interval

                               Lower       Upper
AFB    total    Estimate       Limit       Limit    bc_lower    bc_upper
 0      168      5.91781     4.31781     6.46027     4.31781     6.44658
 1       47      2.36986     1.22192     3.77260     1.14795     3.50411
* sho;
ods select CensoredSummary HomTests;
proc lifetest data = t51;
strata sho / test=(logrank) nodetail;
time lf*fstat(0);
run;
The LIFETEST Procedure

      Summary of the Number of Censored and Uncensored Values
                                                            Percent
Stratum             SHO       Total  Failed    Censored    Censored
      1               0         478     198         280       58.58
      2               1          22      17           5       22.73
-------------------------------------------------------------------
  Total                         500     215         285       57.00


       Test of Equality over Strata
                                   Pr >
Test      Chi-Square      DF    Chi-Square
Log-Rank     23.8365       1      <.0001
%bcconf(t51, lf, fstat, byvar=sho);
Brookmeyer-Crowley 95% Confidence Interval

                               Lower       Upper
SHO    total    Estimate       Limit       Limit    bc_lower    bc_upper
 0      198      5.27671     4.20822     6.46027     4.20822     6.44658
 1       17      0.05342     0.01370     1.22192     0.01096     1.14795
* chf;
ods select CensoredSummary HomTests;
proc lifetest data = t51;
strata chf / test=(logrank) nodetail;
time lf*fstat(0);
run;
The LIFETEST Procedure

      Summary of the Number of Censored and Uncensored Values
                                                            Percent
Stratum             CHF       Total  Failed    Censored    Censored
      1               0         345     105         240       69.57
      2               1         155     110          45       29.03
-------------------------------------------------------------------
  Total                         500     215         285       57.00


       Test of Equality over Strata

                                   Pr >
Test      Chi-Square      DF    Chi-Square
Log-Rank     84.6007       1      <.0001
%bcconf(t51, lf, fstat, byvar=chf);
Brookmeyer-Crowley 95% Confidence Interval

                               Lower       Upper
CHF    total    Estimate       Limit       Limit    bc_lower    bc_upper
 0      105      6.46027     5.91781     6.46027     5.91781      .
 1      110      0.98356     0.75068     1.53973     0.70959     1.51233
* av3;
ods select CensoredSummary HomTests;
proc lifetest data = t51;
strata av3 / test=(logrank) nodetail;
time lf*fstat(0);
run;
The LIFETEST Procedure

      Summary of the Number of Censored and Uncensored Values
                                                            Percent
Stratum             AV3       Total  Failed    Censored    Censored
      1               0         489     208         281       57.46
      2               1          11       7           4       36.36
-------------------------------------------------------------------
  Total                         500     215         285       57.00


       Test of Equality over Strata

                                   Pr >
Test      Chi-Square      DF    Chi-Square
Log-Rank      1.5236       1      0.2171
%bcconf(t51, lf, fstat, byvar=av3);
Brookmeyer-Crowley 95% Confidence Interval

                               Lower       Upper
AV3    total    Estimate       Limit       Limit    bc_lower    bc_upper
 0      208      4.45753     4.12603     6.46027     4.12603     6.44658
 1        7      5.35342     0.05479     6.43836     0.00548      .
* miord;
ods select CensoredSummary HomTests;
proc lifetest data = t51;
strata miord / test=(logrank) nodetail;
time lf*fstat(0);
run;
The LIFETEST Procedure

      Summary of the Number of Censored and Uncensored Values
                                                            Percent
Stratum           MIORD       Total  Failed    Censored    Censored
      1               0         329     125         204       62.01
      2               1         171      90          81       47.37
-------------------------------------------------------------------
  Total                         500     215         285       57.00


       Test of Equality over Strata
                                   Pr >
Test      Chi-Square      DF    Chi-Square
Log-Rank      9.5706       1      0.0020
%bcconf(t51, lf, fstat,byvar= miord);
Brookmeyer-Crowley 95% Confidence Interval

                                 Lower       Upper
MIORD    total    Estimate       Limit       Limit    bc_lower    bc_upper
  0       125      5.91781     5.27671     6.44658     5.27671     6.43836
  1        90      3.37534     1.96712     4.32055     1.96712     4.25479
* mitype;
ods select CensoredSummary HomTests;
proc lifetest data = t51;
strata mitype / test=(logrank) nodetail;
time lf*fstat(0);
run;
The LIFETEST Procedure

      Summary of the Number of Censored and Uncensored Values
                                                            Percent
Stratum          MITYPE       Total  Failed    Censored    Censored
      1               0         347     169         178       51.30
      2               1         153      46         107       69.93
-------------------------------------------------------------------
  Total                         500     215         285       57.00


       Test of Equality over Strata
                                   Pr >
Test      Chi-Square      DF    Chi-Square
Log-Rank     16.1806       1      <.0001
%bcconf(t51, lf, fstat, byvar=mitype);
Brookmeyer-Crowley 95% Confidence Interval

                                  Lower       Upper
MITYPE    total    Estimate       Limit       Limit    bc_lower    bc_upper
   0       169      3.50411     2.88767     4.44932     2.61096     4.32603
   1        46      6.43836     6.43836     6.44658      .           .
Table 5.2 on page 143 using the whas500 data and the lrtest macro which is used to get the p-values in the right-most column of the table.
NOTE: We use the ods select statement to limit the output to just the part presented in the table.
data whas500_t52;
set whas500;
age5 = age/5;
hr10 = hr/10;
sysbp10 = sysbp/10;
diasbp10 = diasbp/10;
bmi5 = bmi/5;
run;
* age;
ods select ParameterEstimates;
proc phreg data = whas500_t52;
model lenfol*fstat(0) = age5 / risklimits;
run;
The PHREG Procedure

               Analysis of Maximum Likelihood Estimates

                   Parameter      Standard
Variable    DF      Estimate         Error    Chi-Square    Pr > ChiSq
age5         1       0.33123       0.03039      118.7963        <.0001

  Analysis of Maximum Likelihood Estimates

              Hazard      95% Hazard Ratio
Variable       Ratio      Confidence Limits
age5           1.393       1.312       1.478
%lrtest(whas500_t52, lenfol, fstat, , age5);
Full model:  age5
Test variables:  age5
Degrees of freedom:  1
P value:  .000
* heart rate;
ods select ParameterEstimates;
proc phreg data = whas500_t52;
model lenfol*fstat(0) = hr10 / risklimits;
run;
The PHREG Procedure

               Analysis of Maximum Likelihood Estimates

                   Parameter      Standard
Variable    DF      Estimate         Error    Chi-Square    Pr > ChiSq
hr10         1       0.15036       0.02687       31.3135        <.0001

  Analysis of Maximum Likelihood Estimates

              Hazard      95% Hazard Ratio
Variable       Ratio      Confidence Limits
hr10           1.162       1.103       1.225
%lrtest(whas500_t52, lenfol, fstat, , hr10);
Full model:  hr10
Test variables:  hr10
Degrees of freedom:  1
P value:  .000
* sysbp;
ods select ParameterEstimates;
proc phreg data = whas500_t52;
model lenfol*fstat(0) = sysbp10 / risklimits;
run;
The PHREG Procedure

               Analysis of Maximum Likelihood Estimates

                   Parameter      Standard
Variable    DF      Estimate         Error    Chi-Square    Pr > ChiSq
sysbp10      1      -0.04502       0.02226        4.0902        0.0431

  Analysis of Maximum Likelihood Estimates

              Hazard      95% Hazard Ratio
Variable       Ratio      Confidence Limits
sysbp10        0.956       0.915       0.999
%lrtest(whas500_t52, lenfol, fstat, , sysbp10);
Full model:  sysbp10
Test variables:  sysbp10
Degrees of freedom:  1
P value:  .041
* diasbp;
ods select ParameterEstimates;
proc phreg data = whas500_t52;
model lenfol*fstat(0) = diasbp10 / risklimits;
run;
The PHREG Procedure

               Analysis of Maximum Likelihood Estimates

                   Parameter      Standard
Variable    DF      Estimate         Error    Chi-Square    Pr > ChiSq
diasbp10     1      -0.15993       0.03284       23.7145        <.0001

  Analysis of Maximum Likelihood Estimates

              Hazard      95% Hazard Ratio
Variable       Ratio      Confidence Limits
diasbp10       0.852       0.799       0.909
%lrtest(whas500_t52, lenfol, fstat, , diasbp10);
Full model:  diasbp10
Test variables:  diasbp10
Degrees of freedom:  1
P value:  .000
* bmi;
ods select ParameterEstimates;
proc phreg data = whas500_t52;
model lenfol*fstat(0) = bmi5 / risklimits;
run;
The PHREG Procedure

               Analysis of Maximum Likelihood Estimates

                   Parameter      Standard
Variable    DF      Estimate         Error    Chi-Square    Pr > ChiSq
bmi5         1      -0.49133       0.07372       44.4254        <.0001

  Analysis of Maximum Likelihood Estimates

              Hazard      95% Hazard Ratio
Variable       Ratio      Confidence Limits
bmi5           0.612       0.530       0.707
%lrtest(whas500_t52, lenfol, fstat, , bmi5);
Full model:  bmi5
Test variables:  bmi5
Degrees of freedom:  1
P value:  .000
Table 5.3 on page 143 using the whas500 data.
ods output ParameterEstimates=out1;
proc phreg data = whas500;
model lenfol*fstat(0) = age hr sysbp diasbp bmi gender cvd afb chf miord mitype;
run;

data out2;
set out1;
z = estimate /stderr;
lb = estimate-1.96*stderr;
ub = estimate+1.96*stderr;
run;

proc print data = out2 noobs;
var variable estimate stderr z probchisq lb ub;
format z f8.2;
format estimate probchisq lb ub f8.3;
format stderr f8.4;
run;
                                                      ProbChi
Variable    Estimate      StdErr           z          Sq          lb          ub

 AGE           0.049      0.0068        7.12       0.000       0.035       0.062
 HR            0.010      0.0031        3.38       0.001       0.004       0.016
 SYSBP         0.000      0.0030        0.12       0.904      -0.006       0.006
 DIASBP       -0.011      0.0049       -2.16       0.031      -0.020      -0.001
 BMI          -0.044      0.0164       -2.66       0.008      -0.076      -0.011
 GENDER       -0.271      0.1457       -1.86       0.063      -0.556       0.015
 CVD           0.007      0.1781        0.04       0.967      -0.342       0.356
 AFB           0.128      0.1712        0.75       0.455      -0.208       0.464
 CHF           0.774      0.1499        5.16       0.000       0.480       1.067
 MIORD         0.044      0.1484        0.30       0.768      -0.247       0.335
 MITYPE       -0.164      0.1879       -0.87       0.382      -0.532       0.204
Table 5.4 on page 144 using the whas500 data.
ods output ParameterEstimates=out3;
proc phreg data = whas500;
model lenfol*fstat(0) = age hr diasbp bmi gender afb chf miord mitype;
run;

data out4;
set out3;
z = estimate /stderr;
lb = estimate-1.96*stderr;
ub = estimate+1.96*stderr;
run;

proc print data = out4 noobs;
var variable estimate stderr z probchisq lb ub;
format z f8.2;
format estimate probchisq lb ub f8.3;
format stderr f8.4;
run;
                                                 ProbChi
Variable    Estimate      StdErr           z          Sq          lb          ub

 AGE           0.049      0.0067        7.23       0.000       0.036       0.062
 HR            0.010      0.0030        3.45       0.001       0.004       0.016
 DIASBP       -0.010      0.0035       -2.87       0.004      -0.017      -0.003
 BMI          -0.044      0.0163       -2.67       0.008      -0.076      -0.012
 GENDER       -0.268      0.1447       -1.85       0.064      -0.552       0.015
 AFB           0.125      0.1697        0.74       0.460      -0.207       0.458
 CHF           0.776      0.1486        5.22       0.000       0.485       1.067
 MIORD         0.045      0.1454        0.31       0.758      -0.240       0.330
 MITYPE       -0.169      0.1838       -0.92       0.357      -0.529       0.191
Table 5.5 on page 144 using the whas500 data.
ods output ParameterEstimates=out5;
proc phreg data = whas500;
model lenfol*fstat(0) = age hr diasbp bmi gender afb chf mitype;
run;

data out6;
set out5;
z = estimate /stderr;
lb = estimate-1.96*stderr;
ub = estimate+1.96*stderr;
run;

proc print data = out6 noobs;
var variable estimate stderr z probchisq lb ub;
format z f8.2;
format estimate probchisq lb ub f8.3;
format stderr f8.4;
run;
                                                 ProbChi
Variable    Estimate      StdErr           z          Sq          lb          ub

 AGE           0.049      0.0067        7.24       0.000       0.036       0.062
 HR            0.010      0.0030        3.49       0.000       0.005       0.016
 DIASBP       -0.010      0.0035       -2.89       0.004      -0.017      -0.003
 BMI          -0.044      0.0163       -2.70       0.007      -0.076      -0.012
 GENDER       -0.274      0.1437       -1.90       0.057      -0.555       0.008
 AFB           0.124      0.1697        0.73       0.464      -0.208       0.457
 CHF           0.777      0.1486        5.23       0.000       0.486       1.069
 MITYPE       -0.182      0.1789       -1.02       0.309      -0.533       0.169
Table 5.6 on page 145 using the whas500 data.
ods output ParameterEstimates=out7;
proc phreg data = whas500;
model lenfol*fstat(0) = age hr diasbp bmi gender chf;
run;

data out8;
set out7;
z = estimate /stderr;
lb = estimate-1.96*stderr;
ub = estimate+1.96*stderr;
run;

proc print data = out8 noobs;
var variable estimate stderr z probchisq lb ub;
format z f8.2;
format estimate probchisq lb ub f8.3;
format stderr f8.4;
run;
                                                 ProbChi
Variable    Estimate      StdErr           z          Sq          lb          ub

 AGE           0.050      0.0066        7.55       0.000       0.037       0.063
 HR            0.011      0.0029        3.83       0.000       0.005       0.017
 DIASBP       -0.011      0.0035       -3.02       0.003      -0.017      -0.004
 BMI          -0.045      0.0163       -2.77       0.006      -0.077      -0.013
 GENDER       -0.270      0.1436       -1.88       0.060      -0.551       0.012
 CHF           0.778      0.1467        5.30       0.000       0.490       1.065
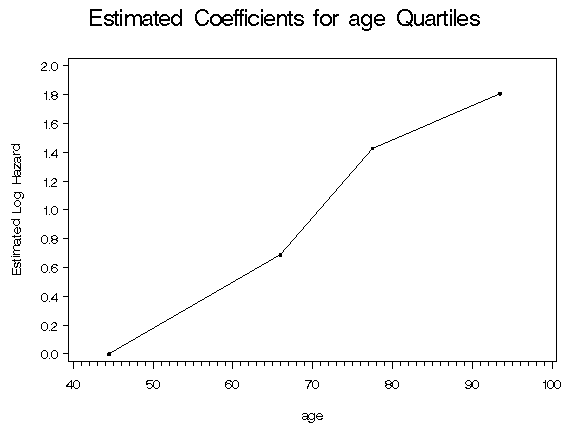
Table 5.7 and Figure 5.1 on page 146 using the whas500 data.
We have created a macro for creating this table and the accompanying graph. However, bmi can be treated as a discrete variable or not. Because of this, we have included code so that the output will match exactly with the text.
%macro table5_7(data, des_var, covlist);
  proc rank data = &data groups = 4 out = _temp_ ties = low;
      var &des_var;
      ranks new_&des_var;
  run;

  proc means data = _temp_ min max;
     class new_&des_var;
     var &des_var;
  ods output Summary = _temp_cut;
run;

  data _temp_a;
   set _temp_;
   &des_var.cat1 = (new_&des_var=1);
   &des_var.cat2 = (new_&des_var=2);
   &des_var.cat3 = (new_&des_var=3);
  run;

  proc phreg data = _temp_a;
     model lenfol*fstat(0) = &des_var.cat1 &des_var.cat2 &des_var.cat3 &covlist;
  ods output ParameterEstimates = _temp_parm;
  run;
data _temp_parma (keep = new_&des_var p);
  set _temp_parm;
  if _n_=1 then do;
  new_&des_var = 0;
  p = 0;
  output;
  new_&des_var = 1;
  p = estimate;
  output;
  end;
  if _n_=2 then do;
  new_&des_var = 2;
  p = estimate;
  output;
  end;
  if _n_=3 then do;
  new_&des_var = 3;
  p = estimate;
  output;
  end;
if _n_<=3;
run;
data _temp_graph;
  merge _temp_cut  _temp_parma;
  by new_&des_var;
  x = (&des_var._min + &des_var._max)/2;
run;
proc print data = _temp_graph noobs label;
var x p;
format p f8.3;
format x f8.1;
label x="&des_var Quartile Midpoint" p='Coeff.';
run;
symbol i = join v = dot;
axis1 label=(a=90 'Estimated Log Hazard') minor=none;
axis2 label=("&des_var");
title "Estimated Coefficients for &des_var Quartiles";
proc gplot data = _temp_graph;
  plot p*x / vaxis=axis1 haxis=axis2;
run;
quit;
title;
%mend;

%table5_7(whas500, age, hr diasbp bmi gender chf);
  age
Quartile
Midpoint      Coeff.

    44.5       0.000
    66.0       0.690
    77.5       1.428
    93.5       1.807
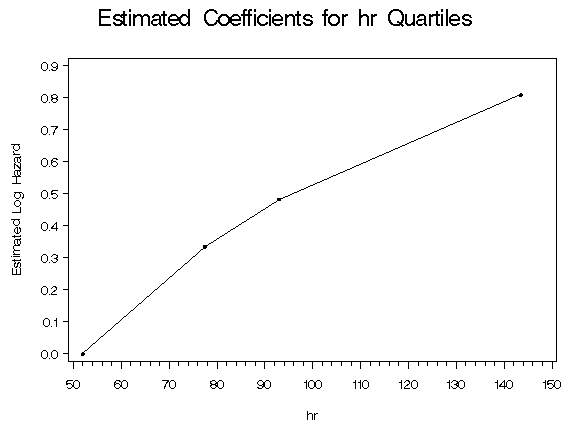
%table5_7(whas500, hr, age diasbp bmi gender chf);
   hr
Quartile
Midpoint      Coeff.

    52.0       0.000
    77.5       0.335
    93.0       0.483
   143.5       0.809
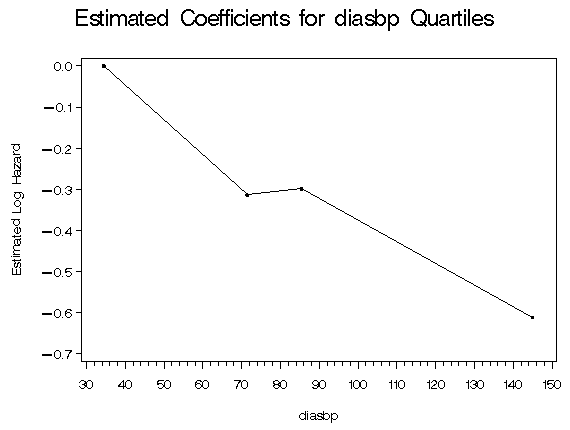
%table5_7(whas500, diasbp, age hr bmi gender chf);
 diasbp
Quartile
Midpoint      Coeff.

    34.5       0.000
    71.5      -0.314
    85.5      -0.298
   145.0      -0.610
%table5_7(whas500, bmi, age hr diasbp gender chf);
  bmi
Quartile
Midpoint      Coeff.

    18.1       0.000
    24.6      -0.403
    27.7      -0.370
    37.1      -0.430
* code to make bmi match to text;
data part4b;
set whas500;
bmicat0 = (bmi le 23);
bmicat1 = (23 < bmi <= 26);
bmicat2 = (26< bmi <= 29);
bmicat3 = (bmi gt 29);
if bmicat0 = 1 then nbmi = 0;
if bmicat1 = 1 then nbmi = 1;
if bmicat2 = 1 then nbmi = 2;
if bmicat3 = 1 then nbmi = 3;
run;

proc freq data = part4b;
tables nbmi;
tables bmicat0 bmicat1 bmicat2 bmicat3;
run;

proc phreg data = part4b;
model lenfol*fstat(0) = bmicat1 bmicat2 bmicat3 age hr diasbp gender chf;
ods output ParameterEstimates = part4_parm;
run;
proc univariate data = whas500;
  var bmi;
  output out = part4_sum min=min q1=q1 median=median q3=q3 max=max;
run;
data part4_cut;
  set part4_sum;
  new_bmi = 0;
  x = (min+q1)/2;
  output;
  new_bmi = 1;
  x = (q1 + median)/2;
  output;
new_bmi = 2;
  x = (median + q3)/2;
  output;
new_bmi = 3;
  x = (q3+max)/2;
  output;
  keep new_bmi x;
run;

data part4_parma (keep = new_bmi p);
  set part4_parm;
  if _n_=1 then do;
  new_bmi = 0;
  p = 0;
  output;
  new_bmi = 1;
  p = estimate;
  output;
  end;
  if _n_=2 then do;
  new_bmi = 2;
  p = estimate;
  output;
  end;
  if _n_=3 then do;
  new_bmi = 3;
  p = estimate;
  output;
  end;
if _n_<=3;
run;

data part4_graph;
  merge part4_cut part4_parma;
  by new_bmi;
  x = put(x, 8.1);
run;

proc print data = part4_graph noobs label;
var x p;
format p f8.3;
label x="BMI Quartile Midpoint" p='Coeff.';
run;
  BMI
Quartile
Midpoint      Coeff.

    18.1       0.000
    24.6      -0.453
    27.7      -0.315
    37.1      -0.592
goptions reset=all;
symbol i = join v = dot;
axis1 order=(-.6 to 0 by .2) label=(a=90 'Estimated Log Hazard') minor=none;
axis2 order=(18.1 24.6 27.7 37.1) label=('Body Mass Index (kg/m^2)');
title 'Estimated Coefficients for Body Mass Index Quartiles';
proc gplot data = part4_graph;
plot p*x / vaxis = axis1 haxis = axis2;
run;
quit;
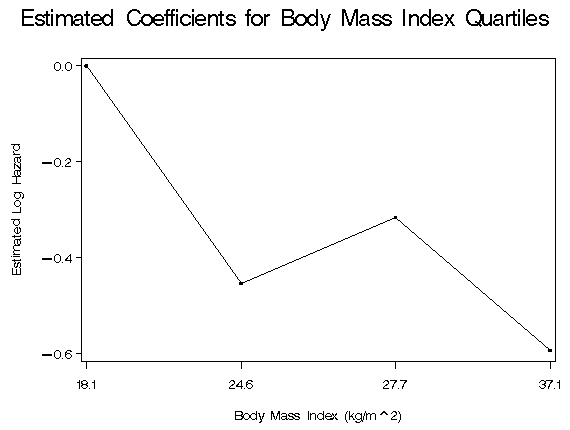
Table 5.8 on page 147 using the whas500 data. For each fitted model, we use the ods output statement to save the fit statistics as a dataset. These datasets are then combined and compared using a likelihood ratio tests.
data table58;
set whas500;
bmi12 = bmi**(-2);
bmi2 = (bmi/10)**2;
bmi3 = (bmi/10)**3;
run;
* not in the model;
ods output FitStatistics = not;
proc phreg data = whas500;
model lenfol*fstat(0) = age hr diasbp gender chf;
run;
* linear;
ods output FitStatistics = linear;
proc phreg data = whas500;
model lenfol*fstat(0) = age hr diasbp bmi gender chf;
run;
* j = 1 (2 df);
ods output FitStatistics = j1;
proc phreg data = table58;
model lenfol*fstat(0) = age hr diasbp bmi12 gender chf;
run;
* j = 2 (4 df);
ods output FitStatistics = j2;
proc phreg data = table58;
model lenfol*fstat(0) = age hr diasbp bmi2 bmi3 gender chf;
run;
data _null_;
set not;
if _n_ = 1 then call symput('not', withcovariates);
set linear;
if _n_ = 1 then call symput('linear', withcovariates);
set j1;
if _n_ = 1 then call symput('j1', withcovariates);
set j2;
if _n_ = 1 then call symput('j2', withcovariates);
run;
data table5_8;
length power $8;
loglikelihood = ¬
gstat = .;
pvalue = .;
power = "";
output;
loglikelihood = &linear;
gstat = &linear-&linear;
pvalue = 1- probchi(¬ - &linear ,1);
power = "1";
output;
loglikelihood = &j1;
gstat = &linear - &j1;
pvalue = 1- probchi(&linear - &j1 ,1);
power = "-2";
output;
loglikelihood = &j2;
gstat = &linear - &j2;
pvalue = 1- probchi(&j1 - &j2 ,2);
power = "(2,3)";
output;
run;
proc print data = table5_8 noobs;
var loglikelihood gstat pvalue power;
format loglikelihood gstat pvalue f8.3;
run;
loglikelihood       gstat      pvalue    power

  2255.945           .           .
  2247.999          0.000       0.005    1
  2241.668          6.331       0.012    -2
  2237.784         10.215       0.143    (2,3)
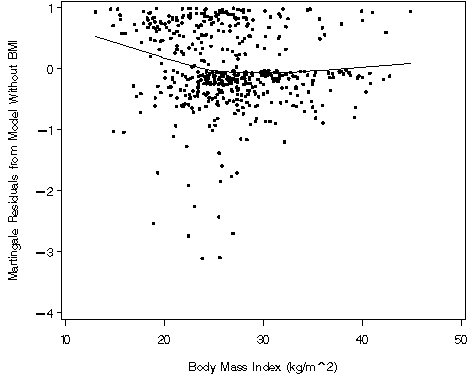
Figure 5.2 on page 149 using the whas500 data.
proc phreg data = whas500;
model lenfol*fstat(0) = age hr diasbp gender chf;
id id;
output out=fig52ar resmart=mart;
run;

proc sort data = whas500;
by id;
run;

proc sort data = fig52ar;
by id;
run;

data fig52a;
merge fig52ar whas500;
by id;
run;

proc loess data = fig52a;
model mart = bmi ;
ods output OutputStatistics=results_fig52a;
run;

proc sort data=results_fig52a;
by bmi;
run;

goptions reset=all;
axis1 order=(-4 to 1 by 1) label=(a=90 'Martingale Residuals from Model Without BMI') minor=none;
axis2 order=(10 to 50 by 10) label=('Body Mass Index (kg/m^2)') minor=none;
symbol1 v=dot i=none c=black;
symbol2 v=none i=join c=black;
proc gplot data = results_fig52a;
plot DepVar*bmi=1 pred*bmi=2 / overlay vaxis = axis1 haxis = axis2;
run;
quit;
proc phreg data = whas500;
model lenfol*fstat(0) = age hr diasbp gender chf bmi;
id id;
output out=fig52br resmart=mart_full;
run;

data temp1;
set fig52br;
hat = fstat - mart_full;
run;

proc loess data = temp1;
model fstat = bmi / smooth = .4 bucket = 20;
ods output OutputStatistics=results_fig52b1;
run;

data temp2;
set results_fig52b1;
rename DepVar = depvar_fstat;
rename Pred = pred_fstat;
run;

proc loess data = temp1;
model hat = bmi / smooth = .4 bucket = 20;
ods output OutputStatistics=results_fig52b2;
run;

data temp3;
set results_fig52b2;
rename DepVar = depvar_hat;
rename Pred = pred_hat;
run;

proc sort data = temp2;
by obs;
run;

proc sort data = temp3;
by obs;
run;

data temp4;
merge temp2 temp3;
by obs;
run;

data temp5;
set temp4;
f = log(pred_fstat/pred_hat)-.0451558*bmi;
id = obs;
run;

proc sort data = temp5;
by bmi;
run;

goptions reset=all;
axis1 order=(-1.5 to .5 by .5) label=(a=90 'ln(csmoothed/Hsmoothed)+beta*x') minor=none;
axis2 order=(10 to 50 by 10) label=('Body Mass Index (kg/m^2)') minor=none;
symbol1 v=none i=join c=black;
proc gplot data = temp5;
plot f*bmi / vaxis = axis1 haxis = axis2;
run;
quit;
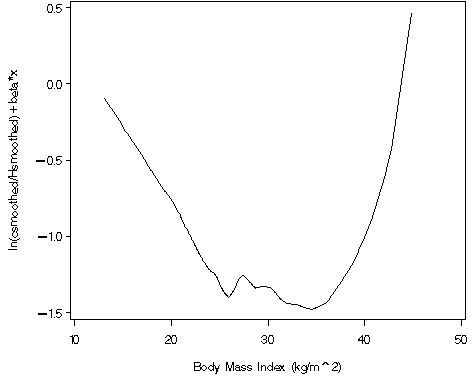
Table 5.9 on page 150 using the modified version of the whas500 data from Table 5.8.
proc phreg data = table58;
model lenfol*fstat(0) = bmi2 bmi3 age hr diasbp gender chf;
run;
< some output omitted >
                  Analysis of Maximum Likelihood Estimates

                 Parameter     Standard                               Hazard
Variable   DF     Estimate        Error   Chi-Square   Pr > ChiSq      Ratio

bmi2        1     -0.72476      0.17261      17.6297       <.0001      0.484
bmi3        1      0.15442      0.03923      15.4958       <.0001      1.167
AGE         1      0.04978      0.00661      56.6729       <.0001      1.051
HR          1      0.01180      0.00295      15.9574       <.0001      1.012
DIASBP      1     -0.01067      0.00350       9.2930       0.0023      0.989
GENDER      1     -0.32640      0.14422       5.1226       0.0236      0.722
CHF         1      0.82341      0.14718      31.3003       <.0001      2.278
Figure 5.3 on page 150 using the whas500 data and the data generated in the previous example from the two term model.
data temp6;
set whas500;
bmifp1=(bmi/10)**2;
bmifp2=(bmi/10)**3;
run;

proc sort data = temp5;
by id;
run;

proc means data = temp6;
var id;
run;

proc sort data = temp6;
by id;
run;

data temp7;
merge temp5 temp6;
by id;
run;

proc phreg data = whas500;
model lenfol*fstat(0) = bmifp1 bmifp2 age hr diasbp gender chf;
run;

* f is generated in the temp5 data set above;
data temp8;
set temp7;
fp_funct=-0.72476*bmifp1+0.15442*bmifp2;
diff=f-fp_funct;
run;

data temp8;
set temp7;
fp_funct=-0.725*bmifp1+0.154*bmifp2;
diff=f-fp_funct;
run;

proc means data = temp8;
var diff;
run;

data temp9;
set temp8;
fp_funct1 = fp_funct + 0.9076111;
run;

proc sort data = temp9;
by bmi;
run;

proc means data = temp9;
var bmi f fp_funct1;
run;

goptions reset=all;

axis1 order=(-1.5 to .5 by .5) label=(a=90 'Estimated Log Hazard') minor=none;
axis2 order=(10 to 50 by 10) label=('Body Mass Index (kg/m^2)') minor=none;
symbol1 v=none i=join c=red line=1;
symbol2 v=none i=join c=black line=14;
legend label=none value=('GTF Smooth' 'Two Term (2, 3) Model')
       position=(top left inside) mode=share down = 2;

proc gplot data = temp9;
plot fp_funct1*bmi=1 f*bmi=2 / vaxis = axis1 haxis = axis2 overlay legend = legend;
run;
quit;
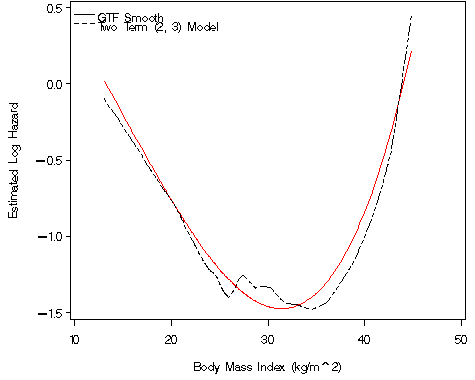
Table 5.10 on page 151 using the whas500 data and the lrtest macro.
data table510;
set whas500;
bmi2=(bmi/10)**2;
bmi3=(bmi/10)**3;

/* Creating age interactions */
bmi2age=age*(bmi/10)**2;
bmi3age=age*(bmi/10)**3;
hrage=age*hr;
diasbpage=age*diasbp;
genderage=age*gender;
chfage=age*chf;

/* Creating gender interactions */
bmi2gender=gender*(bmi/10)**2;
bmi3gender=gender*(bmi/10)**3;
hrgender=gender*hr;
diasbpgender=gender*diasbp;
chfgender=gender*chf;

run;

/* With Age Interactions */

%lrtest(table510, lenfol, fstat, bmi2 bmi3 age hr diasbp gender chf, bmi2age bmi3age);
Full model:     bmi2 bmi3 age hr diasbp gender chf  bmi2age bmi3age
Reduced model:  bmi2 bmi3 age hr diasbp gender chf
Test variables:  bmi2age bmi3age
Degrees of freedom:  2
P value:  .190
%lrtest(table510, lenfol, fstat, bmi2 bmi3 age hr diasbp gender chf, hrage);
Full model:     bmi2 bmi3 age hr diasbp gender chf  hrage
Reduced model:  bmi2 bmi3 age hr diasbp gender chf
Test variables:  hrage
Degrees of freedom:  1
P value:  .132
%lrtest(table510, lenfol, fstat, bmi2 bmi3 age hr diasbp gender chf, diasbpage);
Full model:     bmi2 bmi3 age hr diasbp gender chf  diasbpage
Reduced model:  bmi2 bmi3 age hr diasbp gender chf
Test variables:  diasbpage
Degrees of freedom:  1
P value:  .100
%lrtest(table510, lenfol, fstat, bmi2 bmi3 age hr diasbp gender chf, genderage);
Full model:     bmi2 bmi3 age hr diasbp gender chf  genderage
Reduced model:  bmi2 bmi3 age hr diasbp gender chf
Test variables:  genderage
Degrees of freedom:  1
P value:  .022
%lrtest(table510, lenfol, fstat, bmi2 bmi3 age hr diasbp gender chf, chfage);
Full model:     bmi2 bmi3 age hr diasbp gender chf  chfage
Reduced model:  bmi2 bmi3 age hr diasbp gender chf
Test variables:  chfage
Degrees of freedom:  1
P value:  .025


/* With Gender Interactions */

%lrtest(table510, lenfol, fstat, bmi2 bmi3 age hr diasbp gender chf, bmi2gender bmi3gender);
Full model:     bmi2 bmi3 age hr diasbp gender chf  bmi2gender bmi3gender
Reduced model:  bmi2 bmi3 age hr diasbp gender chf
Test variables:  bmi2gender bmi3gender
Degrees of freedom:  2
P value:  .147
%lrtest(table510, lenfol, fstat, bmi2 bmi3 age hr diasbp gender chf, hrgender);
Full model:     bmi2 bmi3 age hr diasbp gender chf  hrgender
Reduced model:  bmi2 bmi3 age hr diasbp gender chf
Test variables:  hrgender
Degrees of freedom:  1
P value:  .145
%lrtest(table510, lenfol, fstat, bmi2 bmi3 age hr diasbp gender chf, diasbpgender);
Full model:     bmi2 bmi3 age hr diasbp gender chf  diasbpgender
Reduced model:  bmi2 bmi3 age hr diasbp gender chf
Test variables:  diasbpgender
Degrees of freedom:  1
P value:  .080
%lrtest(table510, lenfol, fstat, bmi2 bmi3 age hr diasbp gender chf, chfgender);
Full model:     bmi2 bmi3 age hr diasbp gender chf  chfgender
Reduced model:  bmi2 bmi3 age hr diasbp gender chf
Test variables:  chfgender
Degrees of freedom:  1
P value:  .482
Tables 5.11, 5.12, and 5.13 on pages 152 and 153 using the whas500 data as modified for Table 5.8.
/* 5.11 */
proc phreg data = table58;
model lenfol*fstat(0) = bmi2 bmi3 age hr diasbp gender chf agegender;
agegender = age*gender;
run;
                  Analysis of Maximum Likelihood Estimates

                  Parameter     Standard                               Hazard
Variable    DF     Estimate        Error   Chi-Square   Pr > ChiSq      Ratio

bmi2         1     -0.67309      0.17358      15.0363       0.0001      0.510
bmi3         1      0.14214      0.03944      12.9886       0.0003      1.153
AGE          1      0.06053      0.00832      52.9614       <.0001      1.062
HR           1      0.01167      0.00294      15.7310       <.0001      1.012
DIASBP       1     -0.01071      0.00347       9.5085       0.0020      0.989
GENDER       1      1.85462      0.95783       3.7492       0.0528      6.389
CHF          1      0.82352      0.14654      31.5808       <.0001      2.279
agegender    1     -0.02766      0.01205       5.2685       0.0217      0.973

/* 5.12 */
proc phreg data = table58;
model lenfol*fstat(0) = bmi2 bmi3 age hr diasbp gender chf agegender agechf agediasbp genderdiasbp;
agegender = age*gender;
agechf = age*chf;
agediasbp = age*diasbp;
genderdiasbp = gender*diasbp;
run;
The PHREG Procedure

                    Analysis of Maximum Likelihood Estimates

                     Parameter     Standard                               Hazard
Variable       DF     Estimate        Error   Chi-Square   Pr > ChiSq      Ratio

bmi2            1     -0.64101      0.17539      13.3582       0.0003      0.527
bmi3            1      0.13723      0.04000      11.7676       0.0006      1.147
AGE             1      0.03382      0.02032       2.7699       0.0961      1.034
HR              1      0.01119      0.00297      14.1921       0.0002      1.011
DIASBP          1     -0.05269      0.02130       6.1199       0.0134      0.949
GENDER          1      0.74765      1.22006       0.3755       0.5400      2.112
CHF             1      2.45613      1.00301       5.9964       0.0143     11.660
agegender       1     -0.02202      0.01316       2.7986       0.0943      0.978
agechf          1     -0.02029      0.01272       2.5466       0.1105      0.980
agediasbp       1    0.0004846    0.0002649       3.3464       0.0674      1.000
genderdiasbp    1      0.00899      0.00693       1.6823       0.1946      1.009

/* 5.13 */
proc phreg data = table58;
model lenfol*fstat(0) = bmi2 bmi3 age hr diasbp gender chf agegender;
agegender = age*gender;
run;
                  Analysis of Maximum Likelihood Estimates

                  Parameter     Standard                               Hazard
Variable    DF     Estimate        Error   Chi-Square   Pr > ChiSq      Ratio

bmi2         1     -0.67309      0.17358      15.0363       0.0001      0.510
bmi3         1      0.14214      0.03944      12.9886       0.0003      1.153
AGE          1      0.06053      0.00832      52.9614       <.0001      1.062
HR           1      0.01167      0.00294      15.7310       <.0001      1.012
DIASBP       1     -0.01071      0.00347       9.5085       0.0020      0.989
GENDER       1      1.85462      0.95783       3.7492       0.0528      6.389
CHF          1      0.82352      0.14654      31.5808       <.0001      2.279
agegender    1     -0.02766      0.01205       5.2685       0.0217      0.973
Table 5.14 on page 158 using the whas500 data as modified for Table 5.8. For each step, we have formatted in bold the statistics shown in the text.
proc phreg data = table58;
model lenfol*fstat(0) = age chf hr diasbp bmi gender mitype miord sysbp cvd afb
/ selection = forward  details slentry = 0.25 sls = 0.8;
run;
The PHREG Procedure

          Model Information

Data Set                 WORK.TABLE58
Dependent Variable       LENFOL
Censoring Variable       FSTAT
Censoring Value(s)       0
Ties Handling            BRESLOW

Number of Observations Read         500
Number of Observations Used         500

Summary of the Number of Event and Censored Values

                                     Percent
   Total       Event    Censored    Censored

     500         215         285       57.00

Analysis of Variables Not in the Model

                 Score
Variable    Chi-Square    Pr > ChiSq

AGE           126.2605        <.0001
CHF            84.3701        <.0001
HR             31.2839        <.0001
DIASBP         23.3804        <.0001
BMI            44.1654        <.0001
GENDER          7.7720        0.0053
MITYPE         16.1432        <.0001
MIORD           9.5467        0.0020
SYSBP           4.0922        0.0431
CVD             2.8547        0.0911
AFB            10.8722        0.0010

Step  1. Variable AGE is entered.  The model contains the following explanatory
         variables:

         AGE
 < some output omitted >

                  Analysis of Maximum Likelihood Estimates

                 Parameter     Standard                               Hazard
Variable   DF     Estimate        Error   Chi-Square   Pr > ChiSq      Ratio

AGE         1      0.06625      0.00608     118.7963       <.0001      1.068

Analysis of Variables Not in the Model

                 Score
Variable    Chi-Square    Pr > ChiSq

CHF            38.4054        <.0001
HR             19.0853        <.0001
DIASBP          5.7844        0.0162
BMI             7.2246        0.0072
GENDER          0.2175        0.6409
MITYPE          2.6101        0.1062
MIORD           1.8527        0.1735
SYSBP           3.8985        0.0483
CVD             0.0254        0.8733
AFB             4.1289        0.0422
Step  2. Variable CHF is entered.  The model contains the following explanatory
         variables:

         AGE  CHF

< some output omitted >

                  Analysis of Maximum Likelihood Estimates

                 Parameter     Standard                               Hazard
Variable   DF     Estimate        Error   Chi-Square   Pr > ChiSq      Ratio

AGE         1      0.05860      0.00610      92.4062       <.0001      1.060
CHF         1      0.86085      0.14235      36.5698       <.0001      2.365

Analysis of Variables Not in the Model

                 Score
Variable    Chi-Square    Pr > ChiSq

HR              9.1084        0.0025
DIASBP          5.4058        0.0201
BMI             8.2188        0.0041
GENDER          1.2019        0.2729
MITYPE          2.9333        0.0868
MIORD           1.8879        0.1694
SYSBP           4.4567        0.0348
CVD             0.1742        0.6764
AFB             1.0596        0.3033

Step  3. Variable HR is entered.  The model contains the following explanatory
         variables:

         AGE  CHF  HR

< some output omitted >
                  Analysis of Maximum Likelihood Estimates

                 Parameter     Standard                               Hazard
Variable   DF     Estimate        Error   Chi-Square   Pr > ChiSq      Ratio

AGE         1      0.05905      0.00617      91.6434       <.0001      1.061
CHF         1      0.75665      0.14589      26.8996       <.0001      2.131
HR          1      0.00867      0.00287       9.1191       0.0025      1.009

Analysis of Variables Not in the Model

                 Score
Variable    Chi-Square    Pr > ChiSq

DIASBP          9.2900        0.0023
BMI             8.3197        0.0039
GENDER          1.8804        0.1703
MITYPE          1.6807        0.1948
MIORD           1.1879        0.2758
SYSBP           4.7888        0.0286
CVD             0.1367        0.7116
AFB             0.6020        0.4378

Step  4. Variable DIASBP is entered.  The model contains the following
         explanatory variables:

         AGE  CHF  HR  DIASBP

< some output omitted >

                  Analysis of Maximum Likelihood Estimates

                 Parameter     Standard                               Hazard
Variable   DF     Estimate        Error   Chi-Square   Pr > ChiSq      Ratio

AGE         1      0.05359      0.00631      72.0525       <.0001      1.055
CHF         1      0.74062      0.14622      25.6536       <.0001      2.097
HR          1      0.01075      0.00294      13.4105       0.0003      1.011
DIASBP      1     -0.01079      0.00353       9.3578       0.0022      0.989

Analysis of Variables Not in the Model

                 Score
Variable    Chi-Square    Pr > ChiSq

BMI             7.1659        0.0074
GENDER          2.9642        0.0851
MITYPE          0.8518        0.3561
MIORD           0.7155        0.3976
SYSBP           0.0058        0.9395
CVD             0.0027        0.9582
AFB             0.9543        0.3286

Step  5. Variable BMI is entered.  The model contains the following explanatory
         variables:

         AGE  CHF  HR  DIASBP  BMI

< some output omitted >

                  Analysis of Maximum Likelihood Estimates

                 Parameter     Standard                               Hazard
Variable   DF     Estimate        Error   Chi-Square   Pr > ChiSq      Ratio

AGE         1      0.04805      0.00656      53.6544       <.0001      1.049
CHF         1      0.74520      0.14583      26.1132       <.0001      2.107
HR          1      0.01070      0.00293      13.3047       0.0003      1.011
DIASBP      1     -0.01019      0.00355       8.2368       0.0041      0.990
BMI         1     -0.04271      0.01595       7.1716       0.0074      0.958

Analysis of Variables Not in the Model

                 Score
Variable    Chi-Square    Pr > ChiSq

GENDER          3.5509        0.0595
MITYPE          0.8205        0.3650
MIORD           0.4975        0.4806
SYSBP           0.0003        0.9851
CVD             0.0539        0.8164
AFB             0.5165        0.4723

Step  6. Variable GENDER is entered.  The model contains the following
         explanatory variables:
         AGE  CHF  HR  DIASBP  BMI  GENDER

< some output omitted >

                  Analysis of Maximum Likelihood Estimates

                 Parameter     Standard                               Hazard
Variable   DF     Estimate        Error   Chi-Square   Pr > ChiSq      Ratio

AGE         1      0.04979      0.00660      56.9804       <.0001      1.051
CHF         1      0.77764      0.14670      28.1009       <.0001      2.176
HR          1      0.01118      0.00292      14.7008       0.0001      1.011
DIASBP      1     -0.01059      0.00351       9.0927       0.0026      0.989
BMI         1     -0.04516      0.01628       7.6981       0.0055      0.956
GENDER      1     -0.26999      0.14362       3.5341       0.0601      0.763

Analysis of Variables Not in the Model

                 Score
Variable    Chi-Square    Pr > ChiSq

MITYPE          0.9514        0.3294
MIORD           0.2701        0.6033
SYSBP           0.0490        0.8247
CVD             0.0781        0.7799
AFB             0.4458        0.5043
             Summary of Forward Selection

        Variable    Number         Score
Step     Entered      In      Chi-Square    Pr > ChiSq

   1    AGE              1      126.2605        <.0001
   2    CHF              2       38.4054        <.0001
   3    HR               3        9.1084        0.0025
   4    DIASBP           4        9.2900        0.0023
   5    BMI              5        7.1659        0.0074
   6    GENDER           6        3.5509        0.0595
Table 5.15 on page 161 using the whas500 data as modified for Table 5.8.
NOTE: Lines 3 and 4 are reversed from what is shown in the text.
proc phreg data = table58;
model lenfol*fstat(0) = age chf hr diasbp bmi gender mitype miord sysbp cvd afb
/ selection=score best=3;
ods output BestSubsets = bestsub;
run;

* last is 0/1 temporary variable;
data _null_;
  set bestsub end=last;
  if last then call symput('s11', scorechisq);
run;

data bestsub_a;
  set bestsub;
  sq = &s11 - scorechisq;
  c = sq - (11 - 2*numberinmodel);
run;

proc sort data = bestsub_a;
by c;
run;

proc print data = bestsub_a (obs = 5) noobs label;
var VariablesInModel c sq;
format c sq f8.2;
label VariablesInModel = "Model Covariates";
run;
Model Covariates                              c          sq

AGE CHF HR DIASBP BMI GENDER               3.13        2.13
AGE CHF HR DIASBP BMI GENDER MITYPE        3.58        0.58
AGE CHF HR DIASBP BMI GENDER SYSBP         4.77        1.77
AGE CHF HR DIASBP BMI                      4.95        5.95
AGE CHF HR DIASBP BMI GENDER MIORD         4.99        1.99
We were unable to reproduce table 5.16 on page 165.
Table 5.17, page 166 and table 5.18, page 167 are not reproduced because they use hypothetical data.
