The whas500 data set is used in this chapter. We will also use a macro written to perform a score test for proportional hazards (phreg_score_test). Please download this file, read it over, convert it to a SAS program, and create a filename for it. This will allow us to use %include when we wish to invoke the macro. Then run the %include statement before continuing with the examples.
filename ph_score "C:phreg_score_test.sas";
%include ph_score;
Table 6.1 on page 180 using the whas500 data.
data whas500;
set whas500;
bmifp1=(bmi/10)**2;
bmifp2=(bmi/10)**3;
ga = gender*age;
time = lenfol/365.25;
run;
%phreg_score_test(lenfol, fstat, bmifp1 bmifp2 age hr diasbp gender chf ga, data=whas500);

Score test of proportional hazards assumption

Time variable: lenfol

                     Rho   Chi-Square           df      P-value

bmifp1             0.083        1.658        1.000        0.198
bmifp2            -0.072        1.242        1.000        0.265
AGE                0.083        1.407        1.000        0.236
HR                 0.019        0.081        1.000        0.777
DIASBP             0.000        0.000        1.000        0.997
GENDER             0.034        0.232        1.000        0.630
CHF               -0.044        0.441        1.000        0.507
ga                -0.030        0.179        1.000        0.672
Global test         .           3.655        8.000        0.887
%phreg_score_test(lenfol, fstat, bmifp1 bmifp2 age hr diasbp gender chf ga,
                  data=whas500, type="logtime");
Score test of proportional hazards assumption

Time variable: LOG(lenfol)

                     Rho   Chi-Square           df      P-value

bmifp1             0.007        0.012        1.000        0.914
bmifp2             0.004        0.003        1.000        0.957
AGE                0.146        4.295        1.000        0.038
HR                 0.068        1.032        1.000        0.310
DIASBP             0.047        0.530        1.000        0.467
GENDER             0.101        2.046        1.000        0.153
CHF                0.038        0.333        1.000        0.564
ga                -0.105        2.240        1.000        0.134
Global test         .           7.470        8.000        0.487
%phreg_score_test(lenfol, fstat, bmifp1 bmifp2 age hr diasbp gender chf ga,
                  data=whas500, type="km");
Score test of proportional hazards assumption

Time variable: KM(lenfol)

                     Rho   Chi-Square           df      P-value

bmifp1             0.038        0.350        1.000        0.554
bmifp2            -0.028        0.181        1.000        0.671
AGE                0.128        3.291        1.000        0.070
HR                 0.051        0.567        1.000        0.452
DIASBP             0.038        0.348        1.000        0.555
GENDER             0.081        1.317        1.000        0.251
CHF                0.011        0.026        1.000        0.873
ga                -0.082        1.352        1.000        0.245
Global test         .           5.102        8.000        0.747
%phreg_score_test(lenfol, fstat, bmifp1 bmifp2 age hr diasbp gender chf ga,
                  data=whas500, type="rank");
Score test of proportional hazards assumption

Time variable: RANK(lenfol)

                     Rho   Chi-Square           df      P-value

bmifp1             0.027        0.171        1.000        0.679
bmifp2            -0.015        0.056        1.000        0.814
AGE                0.138        3.864        1.000        0.049
HR                 0.064        0.911        1.000        0.340
DIASBP             0.041        0.408        1.000        0.523
GENDER             0.091        1.646        1.000        0.199
CHF                0.020        0.088        1.000        0.767
ga                -0.093        1.725        1.000        0.189
Global test         .           6.358        8.000        0.607
Figure 6.1 on page 181 using the whas500 data.
proc sql noprint;
  select sum(fstat) into :total
  from whas500;
quit;

proc phreg data = whas500 outest=est61 covout;
model time*fstat(0) = bmifp1 bmifp2 age hr diasbp gender chf ga;
id id;
output out=t61 ressch = bmifp1_r bmifp2_r age_r hr_r diasbp_r gender_r chf_r ga_r;
run;
proc means data = t61;
var bmifp1_r bmifp2_r age_r hr_r diasbp_r gender_r chf_r ga_r;
run;

ods output ProductLimitEstimates=d61;
proc lifetest data = t61;
time time*fstat(0);
id bmifp1_r bmifp2_r age_r hr_r diasbp_r gender_r chf_r ga_r;
run;
data d61_a;
  set d61;
  if censor = 0;
  logtime = log(time);
run;

proc iml;
  use d61_a;
  read all variables {bmifp1_r bmifp2_r age_r hr_r diasbp_r gender_r chf_r ga_r} into L;
  read all variables {time logtime survival censor } into X;
  use est61;
  read all  var {bmifp1 bmifp2 age hr diasbp gender chf ga} into V
      where (_type_ = "COV");
  ssr =  (&total)*L*V;
  W = X || ssr;
  create fig61_b var {time logtime survival censor  sbmifp1_r sbmifp2_r sage_r shr_r sdiasbp_r sgender_r schf_r sga_r};
  append from W;
quit;
***EMPTY GRAPHICS CATALOG;
proc greplay nofs igout=gseg;
delete _all_;
run;
quit;

* figure 6.1 (a);
goptions reset=all htext = 2 htitle = 3;
symbol v = dot;
axis1 order=(-.1 to .15 by .05) label=(a=90 'Scaled Schonefeld Residuals') minor=none;
axis2 order=(-6 to 2 by 2) label=('Log Time') minor=none;
title 'Figure 6.1a';
proc gplot data = fig61_b;
plot shr_r*logtime / vaxis = axis1 haxis = axis2 name = "fig61a" noframe;
run;
quit;

* figure 6.1 (b);
goptions reset=all htext = 2 htitle = 3;
symbol v = dot;
axis1 order=(-.1 to .15 by .05) label=(a=90 'Scaled Schonefeld Residuals') minor=none;
axis2 order=(0 to 8 by 2) label=('Time') minor=none;
title 'Figure 6.1b';
proc gplot data = fig61_b;
plot shr_r*time / vaxis = axis1 haxis = axis2 name = "fig61b" noframe;
run;
quit;

* figure 6.1 (c);
goptions reset=all htext = 2 htitle = 3;
symbol v = dot;
axis1 order=(-.1 to .15 by .05) label=(a=90 'Scaled Schonefeld Residuals') minor=none;
axis2 order=(0 to 1 by .2) label=('Kaplan-Meier Estimate') minor=none;
title 'Figure 6.1c';
proc gplot data = fig61_b;
plot shr_r*survival / vaxis = axis1 haxis = axis2 name = "fig61c" noframe;
run;
quit;

* figure 6.1 (d);
proc rank data = fig61_b out=fig61_b_ranked;
var time;
run;

goptions reset=all htext = 2 htitle = 3;
symbol v = dot;
axis1 order=(-.1 to .15 by .05) label=(a=90 'Scaled Schonefeld Residuals') minor=none;
axis2 order=(0 to 250 by 50) label=('Rank of Time') minor=none;
title 'Figure 6.1d';
proc gplot data = fig61_b_ranked;
plot shr_r*time / vaxis = axis1 haxis = axis2 name = "fig61d" noframe;
run;
quit;
title;

goptions reset=all;
proc greplay igout=work.gseg tc=sashelp.templt template=l2r2 nofs;
treplay 1:fig61a 2:fig61c 3:fig61b 4:fig61d;
run;
quit;
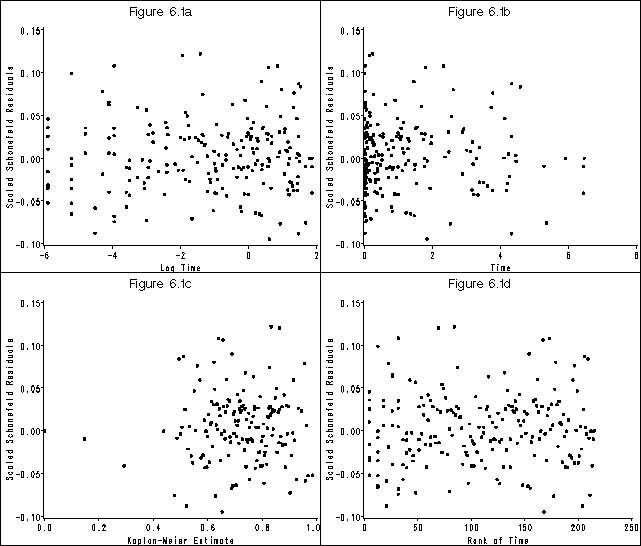
Figure 6.2 on page 182 using the whas500 data modified in the previous example.
***EMPTY GRAPHICS CATALOG;
proc greplay nofs igout=gseg;
delete _all_;
run;
quit;

* figure 6.2 (a);
goptions reset=all htext = 2 htitle = 3;
symbol v = dot;
axis1 order=(-4 to 6 by 2) label=(a=90 'Scaled Schonefeld Residuals') minor=none;
axis2 order=(-6 to 2 by 2) label=('Log Time') minor=none;
title 'Figure 6.2a';
proc gplot data = fig61_b;
plot schf_r*logtime / vaxis = axis1 haxis = axis2 name = "fig62a" noframe;
run;
quit;

* figure 6.2 (b) htext = 2 htitle = 3;
goptions reset=all;
symbol v = dot;
axis1 order=(-4 to 6 by 2) label=(a=90 'Scaled Schonefeld Residuals') minor=none;
axis2 order=(0 to 8 by 2) label=('Time') minor=none;
title 'Figure 6.2b';
proc gplot data = fig61_b;
plot schf_r*time / vaxis = axis1 haxis = axis2 name = "fig62b" noframe;
run;
quit;

* figure 6.2 (c) htext = 2 htitle = 3;
goptions reset=all;
symbol v = dot;
axis1 order=(-4 to 6 by 2) label=(a=90 'Scaled Schonefeld Residuals') minor=none;
axis2 order=(0 to 1 by .2) label=('Kaplan-Meier Estimate') minor=none;
title 'Figure 6.2c';
proc gplot data = fig61_b;
plot schf_r*survival / vaxis = axis1 haxis = axis2 name = "fig62c" noframe;
run;
quit;

* figure 6.2 (d);
proc rank data = fig61_b out=fig61_b_ranked;
var time;
run;

goptions reset=all htext = 2 htitle = 3;
symbol v = dot;
axis1 order=(-4 to 6 by 2) label=(a=90 'Scaled Schonefeld Residuals') minor=none;
axis2 order=(0 to 250 by 50) label=('Rank of Time') minor=none;
title 'Figure 6.2d';
proc gplot data = fig61_b_ranked;
plot schf_r*time / vaxis = axis1 haxis = axis2 name = "fig62d" noframe;
run;
quit;
title;

goptions reset=all;
proc greplay igout=work.gseg tc=sashelp.templt template=l2r2 nofs;
treplay 1:fig62a 2:fig62c 3:fig62b 4:fig62d;
run;
quit;
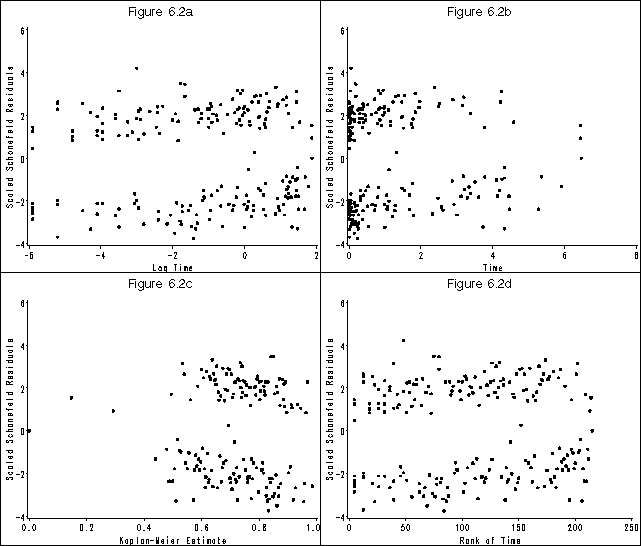
Figure 6.3 on page 183 using the whas500 data modified in a previous example.
***EMPTY GRAPHICS CATALOG;
proc greplay nofs igout=gseg;
delete _all_;
run;
quit;

* figure 6.3 (a);
goptions reset=all htext = 2 htitle = 3;
symbol v = dot;
axis1 order=(-.6 to .4 by .2) label=(a=90 'Scaled Schonefeld Residuals') minor=none;
axis2 order=(-6 to 2 by 2) label=('Log Time') minor=none;
title 'Figure 6.3a';
proc gplot data = fig61_b;
plot sage_r*logtime / vaxis = axis1 haxis = axis2 name = "fig63a" noframe;
run;
quit;
* figure 6.3 (b);
goptions reset=all htext = 2 htitle = 3;
symbol v = dot;
axis1 order=(-.4 to .4 by .2) label=(a=90 'Scaled Schonefeld Residuals') minor=none;
axis2 order=(0 to 8 by 2) label=('Time') minor=none;
title 'Figure 6.3b';
proc gplot data = fig61_b;
plot sage_r*time / vaxis = axis1 haxis = axis2 name = "fig63b" noframe;
run;
quit;
* figure 6.3 (c);
goptions reset=all htext = 2 htitle = 3;
symbol v = dot;
axis1 order=(-.4 to .4 by .2) label=(a=90 'Scaled Schonefeld Residuals') minor=none;
axis2 order=(0 to 1 by .2) label=('Kaplan-Meier Estimate') minor=none;
title 'Figure 6.3c';
proc gplot data = fig61_b;
plot sage_r*survival / vaxis = axis1 haxis = axis2 name = "fig63c" noframe;
run;
quit;

* figure 6.3 (d);
proc rank data = fig61_b out=fig61_b_ranked;
var time;
run;

goptions reset=all htext = 2 htitle = 3;
symbol v = dot;
axis1 order=(-.4 to .4 by .2) label=(a=90 'Scaled Schonefeld Residuals') minor=none;
axis2 order=(0 to 250 by 50) label=('Rank of Time') minor=none;
title 'Figure 6.3d';
proc gplot data = fig61_b_ranked;
plot sage_r*time / vaxis = axis1 haxis = axis2 name = "fig63d" noframe;
run;
quit;
title;

goptions reset=all;
proc greplay igout=work.gseg tc=sashelp.templt template=l2r2 nofs;
treplay 1:fig63a 2:fig63c 3:fig63b 4:fig63d;
run;
quit;
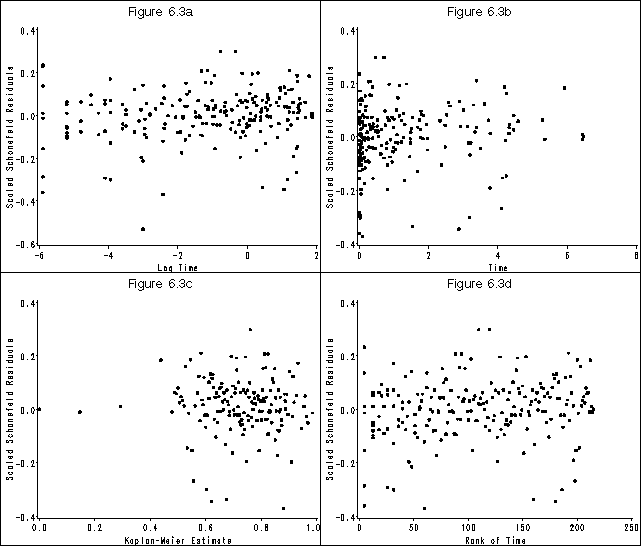
Figure 6.4 on page 186 using the whas500 data.
proc phreg data = whas500 ;
model lenfol*fstat(0) = bmifp1 bmifp2 age hr diasbp gender chf ga;
id id;
output out=f64 ressco = bmifp1_r bmifp2_r age_r hr_r diasbp_r gender_r chf_r ga_r;
run;

proc sort data = whas500;
by id;
run;

proc sort data = f64;
by id;
run;

data f64m;
merge whas500 f64;
by id;
run;

goptions reset=all htext = 2 htitle = 3;
symbol v = dot;
axis1 order=(-10 to 20 by 5) label=(a=90 'Score Residuals') minor=none;
axis2 order=(10 to 50 by 10) label=('Body Mass Index (kg/m^2)') minor=none;
title 'Figure 6.4a';
proc gplot data = f64m;
plot bmifp1_r*bmi / vaxis = axis1 haxis = axis2 name = "f64a" noframe;
run;
quit;

goptions reset=all htext = 2 htitle = 3;
symbol v = dot;
axis1 order=(-40 to 60 by 20) label=(a=90 'Score Residuals') minor=none;
axis2 order=(10 to 50 by 10) label=('Body Mass Index (kg/m^2)') minor=none;
title 'Figure 6.4b';
proc gplot data = f64m;
plot bmifp2_r*bmi / vaxis = axis1 haxis = axis2 name = "f64b" noframe;
run;
quit;

goptions reset=all htext = 2 htitle = 3;
symbol v = dot;
axis1 order=(-100 to 150 by 50) label=(a=90 'Score Residuals') minor=none;
axis2 order=(0 to 200 by 50) label=('Heart Rate (Beats/Min)') minor=none;
title 'Figure 6.4c';
proc gplot data = f64;
plot hr_r*hr / vaxis = axis1 haxis = axis2 name = "f64c" noframe;
run;
quit;

goptions reset=all htext = 2 htitle = 3;
symbol v = dot;
axis1 order=(-100 to 150 by 50) label=(a=90 'Score Residuals') minor=none;
axis2 order=(0 to 200 by 50) label=('Diastolic Blood Pressure (mmHg)') minor=none;
title 'Figure 6.4d';
proc gplot data = f64;
plot diasbp_r*diasbp / vaxis = axis1 haxis = axis2 name = "f64d" noframe;
run;
quit;

goptions reset=all;
proc greplay igout=work.gseg tc=sashelp.templt template=l2r2 nofs;
treplay 1:f64a 2:f64c 3:f64b 4:f64d;
run;
quit;
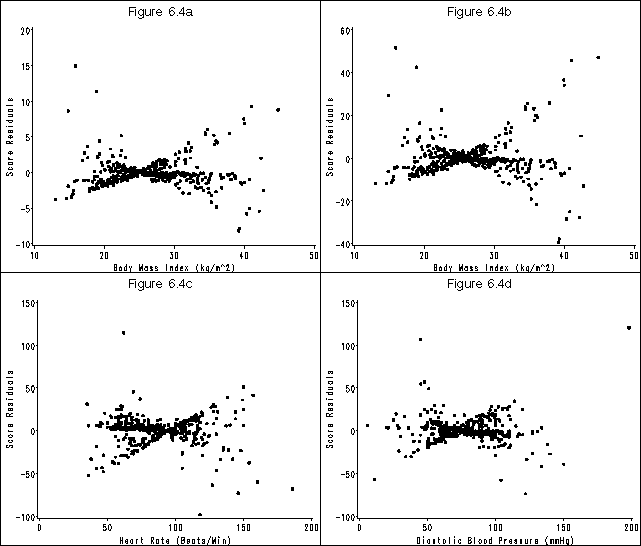
Figure 6.5 on page 186 using the whas500 data as modified in the previous example.
***EMPTY GRAPHICS CATALOG;
proc greplay nofs igout=gseg;
delete _all_;
run;
quit;

goptions reset=all htext = 2 htitle = 3;
symbol v = dot;
axis1 order=(-80 to 20 by 20) label=(a=90 'Score Residuals') minor=none;
axis2 order=(20 to 100 by 20) label=('Age (Years)') minor=none;
title 'Figure 6.5a';
proc gplot data = f64;
plot age_r*age / vaxis = axis1 haxis = axis2 name = "f65a" noframe;
run;
quit;

goptions reset=all htext = 2 htitle = 3;
symbol v = dot;
axis1 order=(-200 to 200 by 100) label=(a=90 'Score Residuals') minor=none;
axis2 order=(20 to 100 by 20) label=('Age (Years)') minor=none;
title 'Figure 6.5b';
proc gplot data = f64;
plot ga_r*age / vaxis = axis1 haxis = axis2 name = "f65b" noframe;
run;
quit;

goptions reset=all htext = 2 htitle = 3;
symbol v = dot;
axis1 order=(-3 to 2 by 1) label=(a=90 'Score Residuals') minor=none;
axis2 offset=(4 cm, 4 cm) value=('No' 'Yes') order=(0 1) label=('Congestive Heart Complications') minor=none;
title 'Figure 6.5c';
proc gplot data = f64;
plot chf_r*chf / vaxis = axis1 haxis = axis2 name = "f65c" noframe;
run;
quit;

goptions reset=all htext = 2 htitle = 3;
symbol v = dot;
axis1 order=(-2 to 2 by 1) label=(a=90 'Score Residuals') minor=none;
axis2 offset=(4 cm, 4 cm) value=('Male' 'Female') order=(0 1) label=('Gender') minor=none;
title 'Figure 6.5d';
proc gplot data = f64;
plot gender_r*gender / vaxis = axis1 haxis = axis2 name = "f65d" noframe;
run;
quit;

goptions reset=all;
proc greplay igout=work.gseg tc=sashelp.templt template=l2r2 nofs;
treplay 1:f65a 2:f65c 3:f65b 4:f65d;
run;
quit;
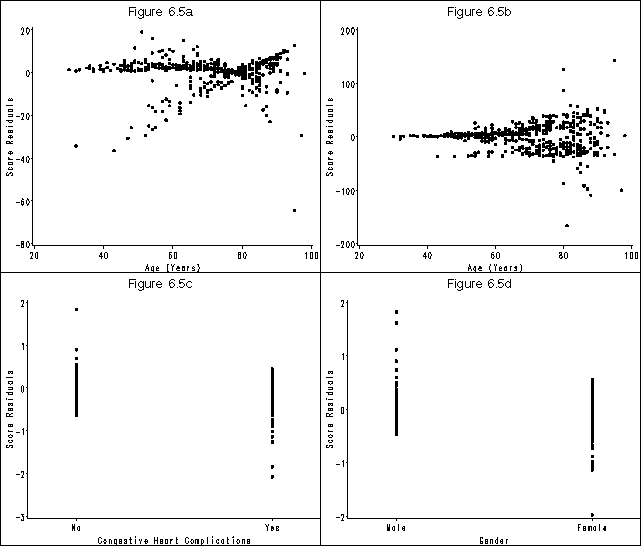
Figure 6.6 on page 187 using the whas500 data.
* requires scaled score residuals which you can get from SAS with the dfbeta option on the output statement;
proc phreg data = whas500;
model lenfol*fstat(0) = bmifp1 bmifp2 age hr diasbp gender chf ga;
id id;
output out=fig66 resmart = mgale dfbeta = ssbmifp1_r ssbmifp2_r ssage_r sshr_r ssdiasbp_r ssgender_r sschf_r ssga_r;
run;


***EMPTY GRAPHICS CATALOG;
proc greplay nofs igout=gseg;
delete _all_;
run;
quit;

goptions reset = all htext = 2 htitle = 3;
data bmi;
set fig66;
bmi = sqrt(bmifp1)*10;
run;

* f6.6(a);
goptions reset=all;
symbol v = dot;
axis1 order=(-.1 to .1 by .05) label=(a=90 'Scaled Score Residuals') minor=none;
axis2 order=(10 to 50 by 10) label=('Body Mass Index (kg/m^2)') minor=none;
title 'Figure 6.6a';
proc gplot data = bmi;
plot ssbmifp1_r*bmi / vaxis = axis1 haxis = axis2 name = "f66a" noframe;
run;
quit;

* f6.6(b);
goptions reset=all htext = 2 htitle = 3;
symbol v = dot;
axis1 order=(-.02 to .02 by .01) label=(a=90 'Scaled Score Residuals') minor=none;
axis2 order=(10 to 50 by 10) label=('Body Mass Index (kg/m^2)') minor=none;
title 'Figure 6.6b';
proc gplot data = bmi;
plot ssbmifp2_r*bmi / vaxis = axis1 haxis = axis2 name = "f66b" noframe;
run;
quit;

* f6.6(c);
goptions reset=all htext = 2 htitle = 3;
symbol v = dot;
axis1 order=(-.0008 to .0006 by .0002) label=(a=90 'Scaled Score Residuals') minor=none;
axis2 order=(0 to 200 by 50) label=('Heart Rate (Beats/Min)') minor=none;
title 'Figure 6.6c';
proc gplot data = bmi;
plot sshr_r*hr / vaxis = axis1 haxis = axis2 name = "f66c" noframe;
run;
quit;

* f6.6(d);
goptions reset=all htext = 2 htitle = 3;
symbol v = dot;
axis1 order=(-.001 to .0015 by .0005) label=(a=90 'Scaled Score Residuals') minor=none;
axis2 order=(0 to 200 by 50) label=('Diastolic Blood Pressure (mmHg)') minor=none;
title 'Figure 6.6d';
proc gplot data = bmi;
plot ssdiasbp_r*diasbp / vaxis = axis1 haxis = axis2 name = "f66d" noframe;
run;
quit;
title;

goptions reset=all;
proc greplay igout=work.gseg tc=sashelp.templt template=l2r2 nofs;
treplay 1:f66a 2:f66c 3:f66b 4:f66d;
run;
quit;
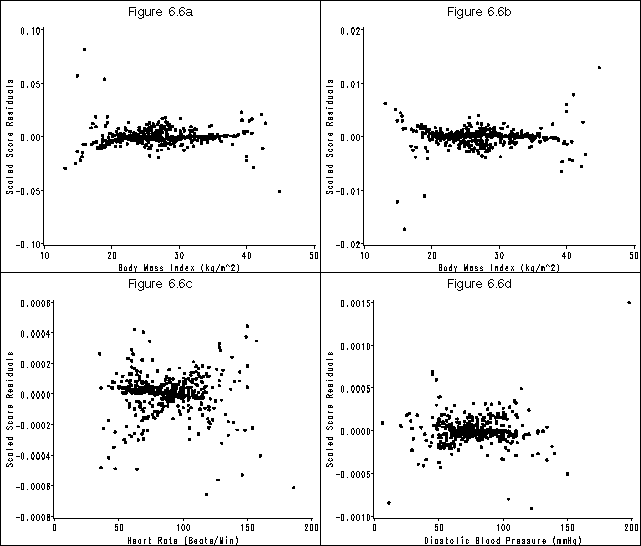
Figure 6.7 on page 188 using the whas500 data as modified in the previous example.
***EMPTY GRAPHICS CATALOG;
proc greplay nofs igout=gseg;
delete _all_;
run;
quit;

* f6.7(a);
goptions reset=all htext = 2 htitle = 3;
symbol v = dot;
axis1 order=(-.003 to .001 by .001) label=(a=90 'Scaled Score Residuals') minor=none;
axis2 order=(20 to 120 by 20) label=('Age (Years)') minor=none;
title 'Figure 6.7a';
proc gplot data = bmi;
plot ssage_r*age / vaxis = axis1 haxis = axis2 name = "f67a" noframe;
run;
quit;

* f6.7(b);
goptions reset=all htext = 2 htitle = 3;
symbol v = dot;
axis1 order=(-.004 to .004 by .002) label=(a=90 'Scaled Score Residuals') minor=none;
axis2 order=(20 to 120 by 20) label=('Age (Years)') minor=none;
title 'Figure 6.7b';
proc gplot data = bmi;
plot ssga_r*age / vaxis = axis1 haxis = axis2 name = "f67b" noframe;
run;
quit;

* f6.7(c);
goptions reset=all htext = 2 htitle = 3;
symbol v = dot;
axis1 order=(-.04 to .04 by .02) label=(a=90 'Scaled Score Residuals') minor=none;
axis2 offset=(4 cm, 4 cm) value=('No' 'Yes') order=(0 1) label=('Congestive Heart Complications') minor=none;
title 'Figure 6.7c';
proc gplot data = bmi;
plot sschf_r*chf / vaxis = axis1 haxis = axis2 name = "f67c" noframe;
run;
quit;

* f6.7(d);
goptions reset=all htext = 2 htitle = 3;
symbol v = dot;
axis1 order=(-.2 to .3 by .1) label=(a=90 'Scaled Score Residuals') minor=none;
axis2 offset=(4 cm, 4 cm) value=('Male' 'Female') order=(0 1) label=('Gender') minor=none;
title 'Figure 6.7d';
proc gplot data = bmi;
plot ssgender_r*gender / vaxis = axis1 haxis = axis2 name = "f67d" noframe;
run;
quit;

goptions reset=all;
proc greplay igout=work.gseg tc=sashelp.templt template=l2r2 nofs;
treplay 1:f67a 2:f67c 3:f67b 4:f67d;
run;
quit;
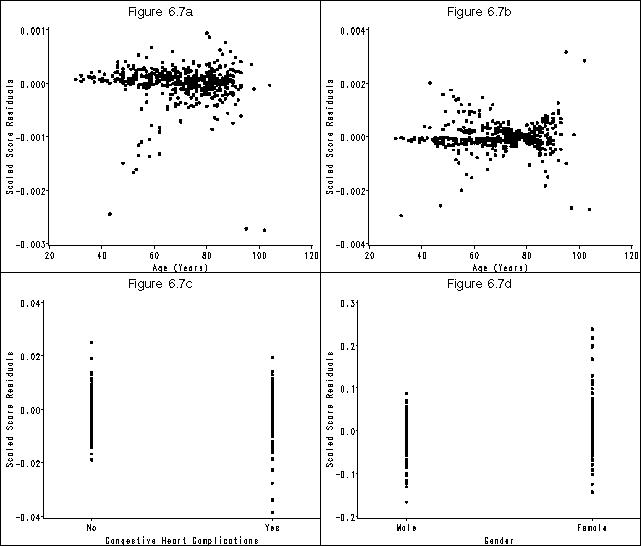
Figure 6.8 on page 190 using the whas500 dataset. We are presenting this example before Table 6.2 on the previous page because the results of this graph are used in selecting the observations of interest in the table.
proc phreg data = whas500;
model lenfol*fstat(0) = bmifp1 bmifp2 age hr diasbp gender chf ga;
output out=f68 resmart = martres ld = ld;
run;

goptions reset=all;
symbol v = dot;
axis1 order=(0 to .8 by .2) label=(a=90 'Likelihood Dispacement') minor=none;
axis2 order=(-4 to 1 by 1) label=('Martingale Residuals') minor=none;

proc gplot data = f68;
plot ld*martres / vaxis = axis1 haxis = axis2;
run;
quit;
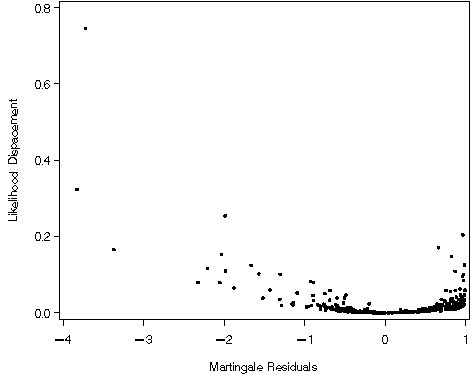
Table 6.2 on page 189 using the modified versions of whas500 used in creating Figures 6.4-6.8. To determine which IDs to include in the table, we will identify those observations highlighted as outliers in Figures 6.4-6.8.
* Listing of subjects identified in Figure 6.4 and 6.5;
data t62a; set f64m;
keep id;
if (bmi < 20 & bmifp1_r>8) or
 (bmi < 20 & bmifp2_r>20) or
 (hr_r>90) or
 (diasbp_r>100) or
 (age>80 & age_r<-50) or
 (age>80 & ga_r<-150) or
 (chf=0 & chf_r>1.5) or
 (chf=1 & chf_r<-1.5) or
 (gender=0 & gender_r>1.5) or
 (gender=1 & gender_r<-1.5);
run;

* Listing of subjects identified in Figure 6.6 and 6.7;
data t62b; set bmi;
keep id;
if (bmi < 20 & ssbmifp1_r >0.05) or
 (bmi < 20 & ssbmifp2_r <-0.01) or
 (bmi > 41 & ssbmifp2_r >0.01) or
 (hr > 170) or
 (diasbp > 190) or
 (age > 85 & ssage_r <-0.002) or
 (age < 40 & ssga_r <-.002) or
 (age > 70 & ssga_r >0.002) or
 (chf=1 & sschf_r<-0.03) or
 (gender=0 & ssgender_r<-.15);
run;

* Listing of subjects identified in Figure 6.8;
data t62c; set f68;
keep id;
if (martres<-3 & ld>.2);
run;

data ids; set t62a t62b t62c;
run;

proc sort data = ids;
by id;
run;

data ids62; set ids;
by id;
if first.id;
run;

proc print data = ids62 noobs;
run;

 ID

 51
 89
112
115
153
194
251
256
416
472

proc format;
value genderfmt
0 = "Male"
1 = "Female";
value chffmt
0 = "No"
1 = "Yes";
run;

proc print data = whas500 label noobs;
var id bmi age hr diasbp gender chf;
where id in(51 89 112 115 153 194 251 256 416 472);
label id =  "Study ID" bmi = "Body Mass Index" age = "Age" hr = "Heart Rate" diasbp = "Diastolic Blood Pressure"
gender = "Gender" chf = "CHF";
format bmi f8.2 gender genderfmt. chf chffmt.;
run;
             Body                    Diastolic
Study        Mass           Heart      Blood
  ID        Index    Age     Rate     Pressure    Gender    CHF

  51        22.45     80     105         72       Male      Yes
  89        15.93     95      62         45       Male      No
 112        14.84     87     105        104       Female    No
 115        18.90     81     118         70       Female    Yes
 153        39.94     32     102         83       Female    No
 194        24.21     43      47         90       Male      Yes
 251        22.27    102      89         60       Male      Yes
 256        44.84     53      96         99       Female    No
 416        28.55     80      64        198       Male      No
 472        25.40     72     186         84       Male      No
Table 6.3 on page 191 using the whas500 data.
ods output ParameterEstimates=out63a;
proc phreg data = whas500 ;
model lenfol*fstat(0) = bmifp1 bmifp2 age hr diasbp gender chf ga;
where diasbp ne 198;
run;

data out63;
set out63a;
z = estimate /stderr;
lb = estimate-1.96*stderr;
ub = estimate+1.96*stderr;
run;

proc print data = out63 noobs;
var variable estimate stderr z probchisq lb ub;
format z f8.2;
format estimate probchisq lb ub f8.3;
format stderr f8.4;
run;
                                                 ProbChi
Variable    Estimate      StdErr           z          Sq          lb          ub

 bmifp1       -0.685      0.1741       -3.94       0.000      -1.026      -0.344
 bmifp2        0.145      0.0395        3.66       0.000       0.067       0.222
 AGE           0.060      0.0083        7.15       0.000       0.043       0.076
 HR            0.012      0.0029        4.13       0.000       0.006       0.018
 DIASBP       -0.012      0.0035       -3.48       0.000      -0.019      -0.005
 GENDER        1.838      0.9579        1.92       0.055      -0.040       3.715
 CHF           0.830      0.1469        5.65       0.000       0.542       1.118
 ga           -0.027      0.0121       -2.28       0.023      -0.051      -0.004
Table 6.4 on page 194 using the whas500 data.
proc phreg data = whas500 ;
model lenfol*fstat(0) = bmifp1 bmifp2 age hr diasbp gender chf ga;
where diasbp ne 198;
output out = t64 xbeta = xb resmart = martres;
run;

proc sort data = t64 (where=(diasbp ne 198)) out=t64s;
by xb;
run;

data t64a;
set t64s;
if _n_ <= 100 then quin = 1;
if 101 <= _n_ <= 200 then quin = 2;
if 201 <= _n_ <= 300 then quin = 3;
if 301 <= _n_ <= 400 then quin = 4;
if _n_ >= 401 then quin = 5;
run;

proc sql;
  create table t64b as
  select quin, max(xb) as cut_point, count(quin) as count,
         sum(fstat) as observed, sum(fstat-martres) as expected
  from t64a
  group by quin;
quit;

data t64c;
  set t64b;
  z = (observed-expected)/sqrt(expected);
  p = 2*(1-PROBNORM(abs(z)));
run;

proc print data = t64c noobs label;
label quin = "Quintile" cut_point = "Cut Point" count = "Count" observed = "Observed" expected = "Expected";
format cut_point expected z f8.2 p f8.3;
run;
                 Cut
Quintile       Point    Count    Observed    Expected           z           p

    1           1.37     100         6           8.17       -0.76       0.448
    2           2.17     100        15          22.47       -1.58       0.115
    3           2.80     100        41          37.55        0.56       0.574
    4           3.52     100        66          53.39        1.73       0.084
    5           5.66      99        86          92.41       -0.67       0.505
Table 6.5 on page 196 using the whas500 data.
ods output ParameterEstimates=out65a;
proc phreg data = whas500 ;
model lenfol*fstat(0) = bmifp1 bmifp2 age hr diasbp gender chf ga;
where diasbp ne 198;
run;

data out65;
set out65a;
z = estimate /stderr;
lb = estimate-1.96*stderr;
ub = estimate+1.96*stderr;
run;
proc print data = out65 noobs;
var variable estimate stderr z probchisq lb ub;
format z f8.2;
format estimate probchisq lb ub f8.3;
format stderr f8.4;
run;
                                                 ProbChi
Variable    Estimate      StdErr           z          Sq          lb          ub

 bmifp1       -0.685      0.1741       -3.94       0.000      -1.026      -0.344
 bmifp2        0.145      0.0395        3.66       0.000       0.067       0.222
 AGE           0.060      0.0083        7.15       0.000       0.043       0.076
 HR            0.012      0.0029        4.13       0.000       0.006       0.018
 DIASBP       -0.012      0.0035       -3.48       0.000      -0.019      -0.005
 GENDER        1.838      0.9579        1.92       0.055      -0.040       3.715
 CHF           0.830      0.1469        5.65       0.000       0.542       1.118
 ga           -0.027      0.0121       -2.28       0.023      -0.051      -0.004
Table 6.6 on page 198 using the whas500 data.
proc phreg data = whas500 ;
model lenfol*fstat(0) = bmifp1 bmifp2 age hr10 diasbp10 gender chf ga / risklimits;
where diasbp ne 198;
hr10 = hr/10;
diasbp10 = diasbp/10;
run;
The PHREG Procedure

               Analysis of Maximum Likelihood Estimates

                   Parameter      Standard
Variable    DF      Estimate         Error    Chi-Square    Pr > ChiSq

bmifp1       1      -0.68510       0.17408       15.4891        <.0001
bmifp2       1       0.14480       0.03954       13.4100        0.0003
AGE          1       0.05957       0.00833       51.1641        <.0001
hr10         1       0.12170       0.02945       17.0712        <.0001
diasbp10     1      -0.12237       0.03513       12.1357        0.0005
GENDER       1       1.83776       0.95793        3.6805        0.0551
CHF          1       0.83029       0.14693       31.9321        <.0001
ga           1      -0.02742       0.01205        5.1767        0.0229

  Analysis of Maximum Likelihood Estimates

              Hazard      95% Hazard Ratio
Variable       Ratio      Confidence Limits

bmifp1         0.504       0.358       0.709
bmifp2         1.156       1.070       1.249
AGE            1.061       1.044       1.079
hr10           1.129       1.066       1.197
diasbp10       0.885       0.826       0.948
GENDER         6.282       0.961      41.070
CHF            2.294       1.720       3.060
ga             0.973       0.950       0.996
Table 6.7 on page 198 using the whas500 data. Our confidence intervals are slightly different from those in the book.
ods output covb = covb;
proc phreg data = whas500;
model lenfol*fstat(0) = bmifp1 bmifp2 age hr diasbp gender chf ga / covb;
ga = gender*age;
run;
data _null_;
  set covb;
  if upcase(rowname) = "GENDER" then
    call symput('vgender', gender);
  if upcase(rowname) = "GA" then do;
    call symput('vga', ga);
    call symput('covga_age', gender);
   end;
run;
* see equations on pages 197-198;
data t67;
  do age =40 to 90 by 10;
   hz = 1.838 - 0.027*age;
   ul = hz + 1.96*sqrt(&vgender+ age**2*&vga +2*age*&covga_age);
   ll = hz - 1.96*sqrt(&vgender+ age**2*&vga +2*age*&covga_age);
   exphz=exp(hz);
   expul = exp(ul);
   expll =exp(ll);
   output;
  end;
run;

proc print data = t67 noobs label;
var age exphz expll expul;
format exphz expul expll f8.2;
label age='Age' exphz='HR' expll='Lower Limit' expul='Upper Limit';
run;
                      Lower       Upper
Age          HR       Limit       Limit

 40        2.13        0.82        5.54
 50        1.63        0.78        3.38
 60        1.24        0.74        2.09
 70        0.95        0.67        1.34
 80        0.72        0.55        0.96
 90        0.55        0.38        0.81
Figure 6.9 on page 202 using the whas500 data. To achieve the desired labeling of the lines, we must create a legend using a data step.
ods output covb = f69;
ods output ParameterEstimates = pe;
proc phreg data = whas500;
model lenfol*fstat(0) = bmifp1 bmifp2 age hr diasbp gender chf ga / covb;
where id ne 416;
ga = gender*age;
run;

data _null_;
set pe;
if Variable = "bmifp1" then
call symput('ebmifp1', Estimate);
if Variable = "bmifp2" then
call symput('ebmifp2', Estimate);
run;

data _null_;
  set f69;
  if rowname = "bmifp1" then
    call symput('vbmifp1', bmifp1);
  if rowname = "bmifp2" then do;
    call symput('vbmifp2', bmifp2);
    call symput('cov1_2', bmifp1);
   end;
run;

data ch6f9;
set whas500;
a = bmifp1 - 9.9225;
b = bmifp2 - 31.25588;
ln_hr = &ebmifp1*a+&ebmifp2*b;
hr = exp(ln_hr);
se_ln_hr = sqrt(a**2*&vbmifp1+b**2*&vbmifp2+2*a*b*&cov1_2);
ln_hr_l = ln_hr-1.96*se_ln_hr;
ln_hr_u= ln_hr+1.96*se_ln_hr;
hr_l=exp(ln_hr_l);
hr_u=exp(ln_hr_u);
run;
proc print data = ch6f9 (obs = 15);
var hr;
run;

proc sort data = ch6f9;
by bmi;
run;

data annolegend;
length function style color $8 text $22;
  retain xsys ysys '1' when 'a' color 'black';

  function='move';
    x=35;  y=90;  output;
  function='draw';
    x=51;  y=90;  line=14;  output;
  function='label';
    x=52;  y=90;  position='6';
    text='Confidence Limits';
    output;

  function='move';
    x=35;  y=93;  output;
  function='draw';
    x=51;  y=93;  line=1;  output;
  function='label';
    x=52;  y=93;  position='6';
    text='Estimated Hazard Ratio';
    output;
run;

goptions reset = all;
axis1 order=(0 to 8 by 2) label=(a=90 'Estimated Hazard Ratio') minor=none;
axis2 order=(10 to 50 by 10) label=('Body Mass Index (kg/m^2)') minor=none;
symbol1 i=join v=none c=black line=1;
symbol2 i=join v=none c=black line=14;
symbol3 i=join v=none c=black line=14;
goptions  ftext = swiss htitle = 5 htext = 3 gunit = pct
          cback = white hsize = 5in vsize = 4in;
proc gplot data = ch6f9;
plot (hr hr_u hr_l)* bmi / overlay vaxis = axis1 haxis = axis2 vref=1 nolegend annotate=annolegend;
run;
quit;
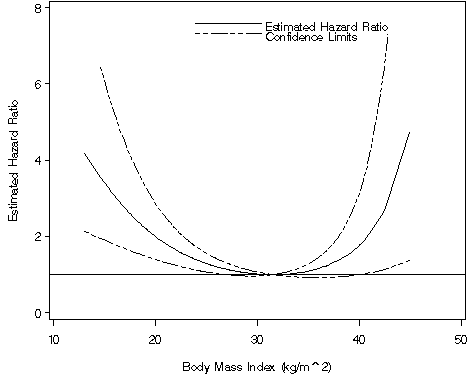
Table 6.8 on page 203 continuing to use the whas500 data. We will use parameter estimates, variances, and co-variances from the model we ran to generate Figure 6.9 and the formulas on page 201.
data t68;
  do bmi = 15 to 40 by 5;
   a = (bmi/10)**2 - 9.9225;
   b = (bmi/10)**3 - 31.25588;
   ln_hr = &ebmifp1*a+&ebmifp2*b;
   hr = exp(ln_hr);
   se_ln_hr = sqrt(a**2*&vbmifp1+b**2*&vbmifp2+2*a*b*&cov1_2);
   ul = ln_hr + 1.96*se_ln_hr;
   ll = ln_hr - 1.96*se_ln_hr;
   expul = exp(ul);
   expll =exp(ll);
   output;
  end;
run;

proc print data = t68 noobs;
var bmi hr expll expul;
run;

 bmi       hr       expll      expul

  15    3.38472    1.89928    6.03194
  20    1.99381    1.39381    2.85210
  25    1.28746    1.06698    1.55350
  30    1.01588    0.96612    1.06820
  35    1.09186    0.92607    1.28734
  40    1.78188    1.00170    3.16972
Figure 6.10 on page 204 using the whas500 data.
data c;
  array a(*) bmifp1 bmifp2 age hr diasbp gender chf ga;
  do i = 1 to dim(a);
    a(i) = 0;
  end;
  drop i;
  output;
run;
proc phreg data = whas500 outest=f610_cov covout;
model lenfol*fstat(0) = bmifp1 bmifp2 age hr diasbp gender chf ga;
ga = gender*age;
id id;
where diasbp ne 198;
output out = f610 xbeta = xb;
baseline out = f610bsurv covariates = c survival = surv /nomean;
run;

data test1;
  set f610_cov;
  if _n_ = 1 then do;
    call symput('bgender', gender);
    call symput('bage', age);
    call symput('bga', ga);
   end;
run;

proc sort data = f610bsurv;
by lenfol;
run;

proc sort data = f610;
by lenfol;
run;

data test2;
merge f610bsurv f610;
by lenfol;
rm = xb - &bage*age - &bgender*gender - &bga*ga;
run;
proc means data = test2 median;
  var rm;
  output out=m median=median;
run;
proc sql;
  select median into :rm
  from m;
quit;

data test3;
  set test2;
s72_male = surv**(exp(&rm + &bage*72));
s72_female = surv**(exp(&rm + &bage*72 + &bgender + &bga*72));
years = lenfol/365.25;
run;

goptions reset=all;
goptions  ftext = swiss htitle = 5 htext = 3 gunit = pct
          cback = white hsize = 5in vsize = 4in;
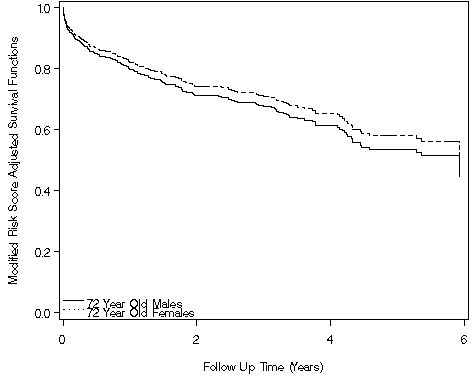
axis1 order=(0 to 1 by .2) label=(a=90 'Modified Risk Score Adjusted Survival Functions') minor=none;
axis2 order=(0 to 6 by 2) label=('Follow Up Time (Years)') minor=none;
symbol1 i=stepjll v=none c=black line=1;
symbol2 i=stepjll v=none c=black line=14;
legend label=none value=('72 Year Old Males' '72 Year Old Females')
       position=(bottom left inside) mode=share down = 2;

proc gplot data = test3;
where years <=6;
plot (s72_male s72_female) * years / overlay vaxis = axis1 haxis = axis2 legend = legend;
run;
quit;
