All of the examples in this chapter use the whas100 data set.
Table 8.1, page 250.
data whas100;
set whas100;
time = foltime / 365.25;
ga = gender*age;
run;
ods select ParameterEstimates;
proc lifereg data = whas100;
model time*folstatus(0) = gender / distribution = exponential;
run;
                    Analysis of Parameter Estimates

                          Standard   95% Confidence     Chi-
Parameter     DF Estimate    Error       Limits       Square Pr > ChiSq

Intercept      1   2.3176   0.1890   1.9472   2.6880  150.39     <.0001
GENDER         1  -0.6016   0.2814  -1.1532  -0.0501    4.57     0.0325
Scale          0   1.0000   0.0000   1.0000   1.0000
Weibull Shape  0   1.0000   0.0000   1.0000   1.0000
Table 8.2, page 252
ods select ParameterEstimates;
proc lifereg data = whas100;
model time*folstatus(0) = gender age ga bmi / distribution = exponential;
run;

                    Analysis of Parameter Estimates

                          Standard   95% Confidence     Chi-
Parameter     DF Estimate    Error       Limits       Square Pr > ChiSq

Intercept      1   3.3891   1.6200   0.2139   6.5642    4.38     0.0364
GENDER         1  -3.9324   1.8098  -7.4795  -0.3852    4.72     0.0298
AGE            1  -0.0532   0.0157  -0.0840  -0.0224   11.48     0.0007
ga             1   0.0498   0.0241   0.0024   0.0971    4.24     0.0394
BMI            1   0.0935   0.0376   0.0199   0.1671    6.20     0.0128
Scale          0   1.0000   0.0000   1.0000   1.0000
Weibull Shape  0   1.0000   0.0000   1.0000   1.0000
Figure 8.1, page 225
ods output covb = covf81;
proc lifereg data = whas100;
model time*folstatus(0) = gender age ga bmi / distribution = exponential covb;
output out = fig81 xbeta = xb;
run;

data fig81_a;
set fig81;
* creating score residuals;
lint = (time*exp(-xb) - folstatus);
lgender = gender*(time*exp(-xb) - folstatus);
lage = age*(time*exp(-xb) - folstatus);
lga = ga*(time*exp(-xb) - folstatus);
lbmi = bmi*(time*exp(-xb) - folstatus);
lscale = 1;
mgale = -lint;
run;
* scaling the score residuals;
proc iml;
  use fig81_a ;
  read all variables {lint lgender lage lga lbmi lscale} into L;
  read all variables {id folstatus time gender age ga bmi mgale} into X;
  use covf81;
  read all variables _num_ into V;
  dbeta = L*V;
  ld = J(100, 1, 0);
  do i = 1 to 100;
  ld[i] = L[i,]*t(dbeta[i,]);
  end;
  W = X || dbeta ||ld;
  create fig81_b var {id folstatus time gender age ga bmi mgale dbint dbgender dbage dbga dbbmi dbscale ld};
  append from W;
quit;
***EMPTY GRAPHICS CATALOG;
proc greplay nofs igout=gseg;
delete _all_;
run;
quit;

goptions reset=all htext = 2 htitle = 3;
symbol v = dot;
axis1 order=(-1 to .5 by .5) label=(a=90 'Scaled Score Residuals for Gender') minor=none;
axis2 offset=(4 cm, 4 cm) value=('Male' 'Female') order=(0 1) label=('Gender') minor=none;
title 'Figure 8.1a';
proc gplot data = fig81_b;
plot dbgender*gender / vaxis = axis1 haxis = axis2 name = "f81a" noframe;
run;
quit;

goptions reset=all htext = 2 htitle = 3;
symbol v = dot;
axis1 order=(-.004 to .006 by .002) label=(a=90 'Scaled Score Residuals for Age') minor=none;
axis2 order=(20 to 100 by 20) label=('Age (Years)') minor=none;
title 'Figure 8.1b';
proc gplot data = fig81_b;
plot dbage*age / vaxis = axis1 haxis = axis2 name = "f81b" noframe;
run;
quit;

goptions reset=all htext = 2 htitle = 3;
symbol v = dot;
axis1 order=(-.005 to .015 by .005) label=(a=90 'Scaled Score Residuals for Age Interaction') minor=none;
axis2 order=(20 to 100 by 20) label=('Age (Years)') minor=none;
title 'Figure 8.1c';
proc gplot data = fig81_b;
plot dbga*age / vaxis = axis1 haxis = axis2 name = "f81c" noframe;
where gender = 1;
run;
quit;

goptions reset=all htext = 2 htitle = 3;
symbol v = dot;
axis1 order=(-.02 to .01 by .01) label=(a=90 'Scaled Score Residuals for BMI') minor=none;
axis2 order=(15 to 40 by 5) label=('Body Mass Index (kg/m**2)') minor=none;
title 'Figure 8.1d';
proc gplot data = fig81_b;
plot dbbmi*bmi / vaxis = axis1 haxis = axis2 name = "f81d" noframe;
run;
quit;
title;

goptions reset=all;
proc greplay igout=work.gseg tc=sashelp.templt template=l2r2 nofs;
treplay 1:f81a 2:f81c 3:f81b 4:f81d;
run;
quit;
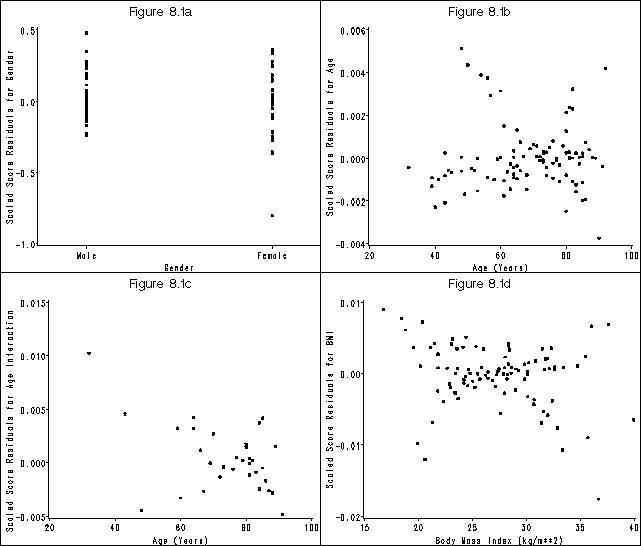
Figure 8.2, page 226
goptions reset=all;
symbol1 v = circle c=black;
symbol2 v = dot c=black;
legend1 label=none value=(tick=2 justify=l 'Non-censored' tick=1 justify = l 'Censored')
       position=(top left inside) mode=share down=2 ;
axis1 order=(0 to .5 by .1) label=(a=90 'Likelihood Displacement') minor=none;
axis2 order=(-2 to 1 by 1) label=('Martingale Residuals') minor=none;
proc gplot data = fig81_b;
plot ld*mgale=folstatus / vaxis = axis1 haxis = axis2 legend=legend1;
run;
quit;
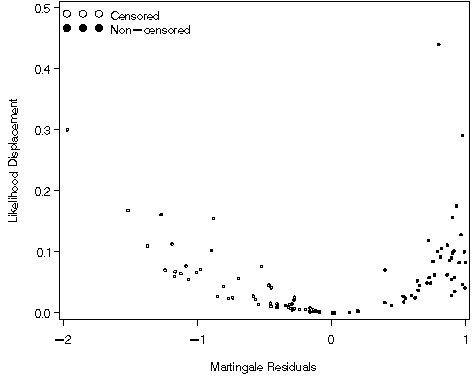
Table 8.3, page 256. We first identify the observations that appear highlighted in Figures 8.1 and 8.2 and then generate the table.
data t83; set fig81_b;
keep id;
if (gender= 1 & dbgender <-.5) or
	(Age > 80 & dbage < -.003) or
	(Age > 80 & dbage > .004) or
	(Age < 50 & dbga > .004) or
	(bmi > 35 & dbbmi < -.01) or
	(ld > .2);
run;

proc print data = t83 noobs;
run;

ID
30
52
58
61
93
97

proc format;
value gdr 0 = "Male" 1 = "Female";
run;
proc print data = fig81_b noobs;
var id gender age bmi ;
format bmi f4.1;
where id in(30, 52, 58, 61, 93, 97);
run;
ID    GENDER    AGE     BMI

30       1       85    36.7
52       1       43    25.3
58       0       92    24.4
61       0       90    24.8
93       1       80    20.6
97       1       32    39.9
Figure 8.3, page 258
proc lifereg data = whas100;
model time*folstatus(0) = gender age ga bmi / distribution = exponential;
output out = fig83 xbeta = xb cres = cr;
run;

proc lifetest data = fig83 outsurv = surv ;
time cr*folstatus(0);
run;
data surv1;
  set surv;
  hkm = -log(survival);
run;
goptions reset = all;
symbol1 v = none i=join line = 1 c=black;
symbol2 v = none i = join line = 33 c=black;
axis1 order=(0 to 2.5 by .5) label=(a=90 'Kaplan-Meier Estimated Cumulative Hazard') minor=none;
axis2 order=(0 to 2.5 by .5) label=('Exponential Regression Model Cumulative Hazard') minor=none;
proc gplot data = surv1;
plot (cr Hkm)*cr / overlay vaxis = axis1 haxis = axis2;
run;
quit;
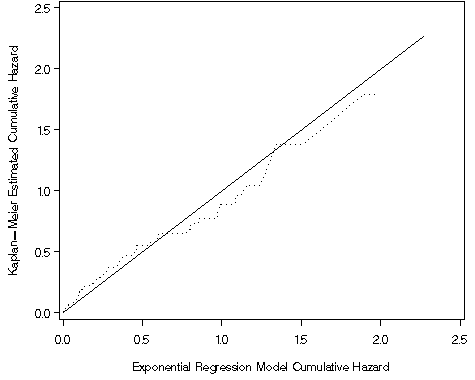
Table 8.4, page 259
NOTE: This output does not match the text, but does match the output from Stata.
proc lifereg data = whas100;
model time*folstatus(0) = gender age ga bmi / distribution = exponential;
output out = t84 xbeta = xb cres = cr;
run;

proc sort data = t84 out=t84s;
by xb;
run;

data t84a;
set t84s;
if _n_ <= 50 then dec = 1;
if _n_ > 50 then dec = 2;
run;

proc freq data = t84a;
table folstatus*dec;
run;

proc sql;
  create table t84b as
  select dec, max(xb) as cut_point, count(dec) as count,
         sum(folstatus) as observed, sum(cr) as expected
  from t84a
  group by dec;
quit;

data t84c;
  set t84b;
  z = (observed-expected)/sqrt(expected);
  p = 2*(1-PROBNORM(abs(z)));
run;

proc print data = t84c noobs label;
var dec observed expected z p;
label dec = 'Risk Group' observed = 'Observed Number of Events' expected = 'Estimated Number of Events' p = 'p-value';
format expected z p f8.2;
sum expected observed;
run;
          Observed    Estimated
 Risk    Number of    Number of
Group      Events      Events             z     p-value

  1          33          37.27        -0.70        0.48
  2          18          13.73         1.15        0.25
         =========    =========
             51          51.00
Table 8.5, page 264
ods select ParameterEstimates;
proc lifereg data = whas100;
model time*folstatus(0) = gender age ga bmi / distribution = weibull;
run;
The LIFEREG Procedure

                    Analysis of Parameter Estimates

                          Standard   95% Confidence     Chi-
Parameter     DF Estimate    Error       Limits       Square Pr > ChiSq

Intercept      1   3.9721   2.0470  -0.0400   7.9841    3.77     0.0523
GENDER         1  -4.6894   2.2848  -9.1676  -0.2113    4.21     0.0401
AGE            1  -0.0639   0.0206  -0.1044  -0.0235    9.61     0.0019
ga             1   0.0592   0.0304  -0.0005   0.1188    3.78     0.0518
BMI            1   0.1055   0.0465   0.0144   0.1966    5.15     0.0232
Scale          1   1.2529   0.1556   0.9821   1.5982
Weibull Shape  1   0.7982   0.0991   0.6257   1.0182
Figure 8.4, page 266
ods output covb = covf84;
ods output parameterestimates=parms;
proc lifereg data = whas100;
model time*folstatus(0) = gender age ga bmi / distribution = weibull covb;
output out = fig84 xbeta = xb;
run;
data _null_;
  set parms;
  if Parameter="Scale" then call symput('sigma', estimate);
data fig84_a;
set fig84;
* creating score residuals;
  zhat = (log(time) - xb)/σ
  mgale = folstatus - exp(zhat);
  lint = -mgale/σ
  lgender = -gender*mgale/σ
  lage    = -age*mgale/σ
  lga    = -ga*mgale/σ
  lbmi    = -bmi*mgale/σ
  lscale = folstatus + zhat*mgale; /* for the log scale term*/
run;
* scaling the score residuals;
proc iml;
  use fig84_a ;
  read all variables {lint lgender lage lga lbmi lscale} into L;
  read all variables {id folstatus time gender age ga bmi mgale} into X;
  use covf84;
  read all  var _num_ into V;
  H = I(6);
  H[6,6]=-1/σ
  V1 = H*V*H;
  dbeta = L*V1;
  ld = j(100, 1, 0);
  do i = 1 to 100;
   ld[i] = L[i,]*V1*t(L[i,]);
  end;
  W = X || dbeta ||ld;
  create fig84_b var {id folstatus time gender age ga bmi mgale dbint dbgender dbage dbga dbbmi dbscale ld};
  append from W;
quit;
***EMPTY GRAPHICS CATALOG;
proc greplay nofs igout=gseg;
delete _all_;
run;
quit;

goptions reset=all htext = 2 htitle = 3;
symbol v = dot;
axis1 order=(-1 to .5 by .5) label=(a=90 'Scaled Score Residuals for Gender') minor=none;
axis2 offset=(4 cm, 4 cm) value=('Male' 'Female') order=(0 1) label=('Gender') minor=none;
title 'Figure 8.4a';
proc gplot data = fig84_b;
plot dbgender*gender / vaxis = axis1 haxis = axis2 name = "f84a" noframe;
run;
quit;

goptions reset=all htext = 2 htitle = 3;
symbol v = dot;
axis1 order=(-.004 to .006 by .002) label=(a=90 'Scaled Score Residuals for Age') minor=none;
axis2 order=(20 to 100 by 20) label=('Age (Years)') minor=none;
title 'Figure 8.4b';
proc gplot data = fig84_b;
plot dbage*age / vaxis = axis1 haxis = axis2 name = "f84b" noframe;
run;
quit;

goptions reset=all htext = 2 htitle = 3;
symbol v = dot;
axis1 order=(-.005 to .015 by .005) label=(a=90 'Scaled Score Residuals for Age Interaction') minor=none;
axis2 order=(20 to 100 by 20) label=('Age (Years)') minor=none;
title 'Figure 8.4c';
proc gplot data = fig84_b;
plot dbga*age / vaxis = axis1 haxis = axis2 name = "f84c" noframe;
where gender = 1;
run;
quit;

goptions reset=all htext = 2 htitle = 3;
symbol v = dot;
axis1 order=(-.02 to .01 by .01) label=(a=90 'Scaled Score Residuals for BMI') minor=none;
axis2 order=(15 to 40 by 5) label=('Body Mass Index (kg/m**2)') minor=none;
title 'Figure 8.4d';
proc gplot data = fig84_b;
plot dbbmi*bmi / vaxis = axis1 haxis = axis2 name = "f84d" noframe;
run;
quit;
title;

goptions reset=all;
proc greplay igout=work.gseg tc=sashelp.templt template=l2r2 nofs;
treplay 1:f84a 2:f84c 3:f84b 4:f84d;
run;
quit;
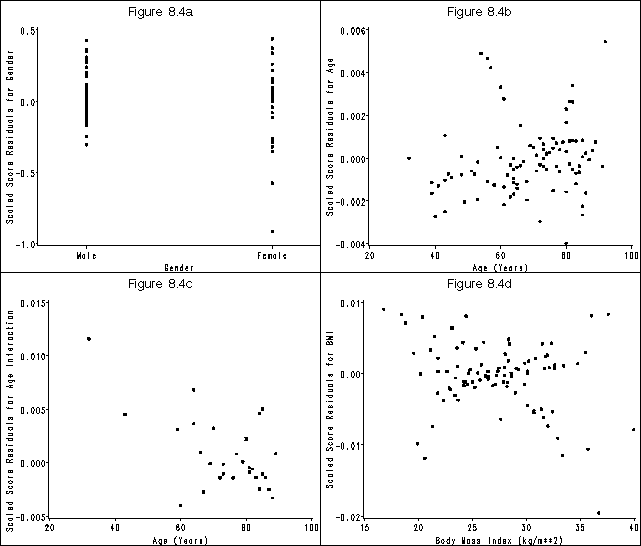
Figure 8.5, page 267
data fig84_b;
  set fig84_b;
  a = 1;
run;

goptions reset=all;
proc boxplot data= fig84_b;
plot dbscale*a;
run;
quit;
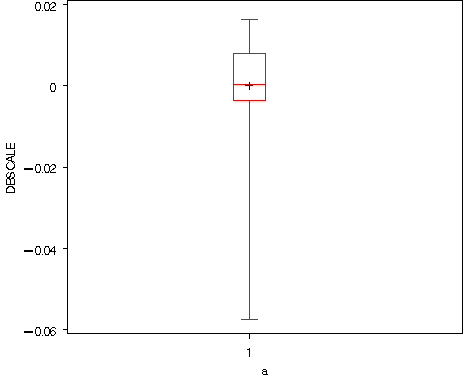
Table 8.6, page 267. We first identify the observations that appear highlighted in Figures 8.4, 8.5 and 8.6 and then generate the table.
data t86; set fig84_b;
keep id;
if (gender = 1 & dbgender < -.9) or
	(age > 80 & dbage > .005) or
	(age > 80 & dbage < -.004) or
	(age < 50 & dbga > .004) or
	(bmi > 35 & dbbmi < -.015) or
	(dbscale < -.05) or
	(mgale < -1 & ld > .2) or
	(mgale > .5 & ld > .3);
run;

proc print data = t86 noobs;
run;

 ID
  1
 30
 31
 52
 58
 61
 93
 97

proc format;
value gdr 0 = "Male" 1 = "Female";
run;
proc print data = fig84_b noobs;
var id gender age bmi ;
format bmi f4.1;
where id in(1, 30, 31, 52, 58, 61, 93, 97);
format gender gdr.;
run;
ID    GENDER    AGE     BMI

 1    Male       65    31.4
30    Female     85    36.7
31    Male       72    28.0
52    Female     43    25.3
58    Male       92    24.4
61    Male       90    24.8
93    Female     80    20.6
97    Female     32    39.9
Figure 8.6, page 268
goptions reset=all;
symbol1 v = circle c=black;
symbol2 v = dot c=black;
legend1 label=none value=(tick=2 justify=l 'Non-censored' tick=1 justify = l 'Censored')
       position=(top left inside) mode=share down=2 ;
axis1 order=(0 to .5 by .1) label=(a=90 'Likelihood Displacement') minor=none;
axis2 order=(2 to 1 by 1) label=('Martingale Residuals') minor=none;
proc gplot data = fig84_b;
plot ld*mgale=folstatus / vaxis = axis1 haxis = axis2 legend=legend1;
run;
quit;
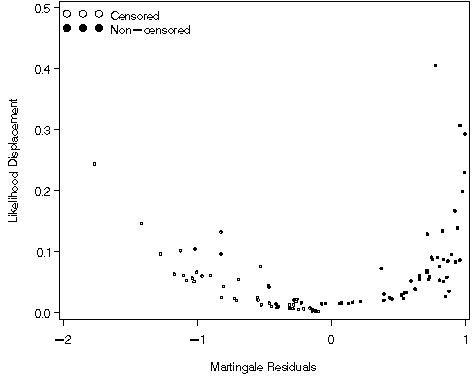
Figure 8.7, page 269
proc lifereg data = whas100;
model time*folstatus(0) = gender age ga bmi / distribution = weibull;
output out = fig87 xbeta = xb cres = cr;
run;

proc lifetest data = fig87 outsurv = surv87;
time cr*folstatus(0);
run;
data surv87_1;
set surv87;
hkm = -log(survival);
run;
goptions reset = all;
symbol1 v = none i=join line = 1 c=black;
symbol2 v = none i = join line = 33 c=black;
axis1 order=(0 to 2.5 by .5) label=(a=90 'Kaplan-Meier Estimated Cumulative Hazard') minor=none;
axis2 order=(0 to 2 by .5) label=('Exponential Regression Model Cumulative Hazard') minor=none;
proc gplot data = surv87_1;
plot (cr Hkm)*cr / overlay vaxis = axis1 haxis = axis2;
run;
quit;
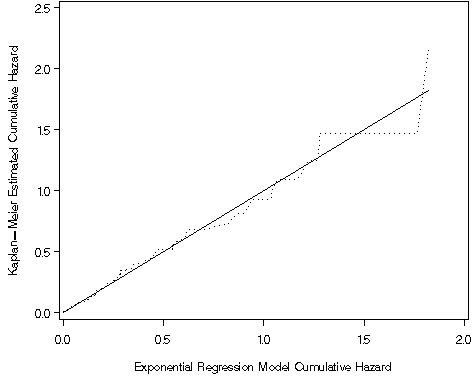
Table 8.7, page 270
proc lifereg data = whas100;
model time*folstatus(0) = gender age ga bmi / distribution = weibull;
output out = t87 xbeta = xb cres = cr;
run;

proc sort data = t87 out=t87s;
by xb;
run;

data t87a;
set t87s;
if _n_ <= 50 then dec = 1;
if _n_ > 50 then dec = 2;
run;

proc freq data = t87a;
table folstatus*dec;
run;

proc sql;
  create table t87b as
  select dec, max(xb) as cut_point, count(dec) as count,
         sum(folstatus) as observed, sum(cr) as expected
  from t87a
  group by dec;
quit;

data t87c;
  set t87b;
  z = (observed-expected)/sqrt(expected);
  p = 2*(1-PROBNORM(abs(z)));
run;

proc print data = t87c noobs label;
var dec observed expected z p;
label dec = 'Risk Group' observed = 'Observed Number of Events' expected = 'Estimated Number of Events' p = 'p-value';
format expected z p f8.2;
sum expected observed;
run;
         Observed    Estimated
 Risk    Number of    Number of
Group      Events      Events             z     p-value

  1          33          36.97        -0.65        0.51
  2          18          14.03         1.06        0.29
         =========    =========
             51          51.00
Figure 8.8, page 271
data f88;
set whas100;
cage = age - 70;
cbmi = bmi - 27;
gca = gender*cage;
run;

proc lifereg data = f88;
model time*folstatus(0) = gender cage gca cbmi / distribution = exponential;
run;
proc lifereg data = f88;
model time*folstatus(0) = gender cage gca cbmi / distribution = weibull;
run;

data f88a;
set f88;
h_exp = exp(-2.1899);
h_weibull = (1/1.2529)*exp(-2.3451/1.2529)*time**(1/1.2529-1);
run;

proc sort data = f88a;
by time h_weibull;
run;

goptions reset = all;
symbol1 v = none i= join line = 1 c=black;
symbol2 v = none i = join line = 33 c=black;
axis1 order=(.05 to .3 by .05) label=(a=90 'Estimated Hazard Function') minor=none;
axis2 order=(0 to 8 by 2) label=('Follow Up Time (Years)') minor=none;
legend1 label=none value=('Exponential Hazard' 'Weibull Hazard')
       position=(top center inside) mode=share down=2 ;
proc gplot data = f88a;
plot (h_exp h_weibull)*time / overlay vaxis = axis1 haxis = axis2 legend = legend1;
run;
quit;
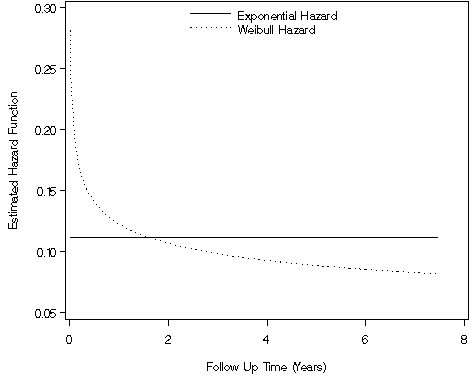
Figure 8.9, page 272
proc lifereg data = f88;
model time*folstatus(0) = gender cage gca cbmi / distribution = weibull;
run;

data f89;
set f88;
rm = 2.3451;
rf =  2.3451 -0.5487;
s_male = exp(-time**(1/1.2529)*exp(-rm/1.2529));
s_female = exp(-time**(1/1.2529)*exp(-rf/1.2529));
run;

proc sort data = f89;
by time;
run;

goptions reset = all;
symbol1 v = none i= stepjll line = 1 c=black;
symbol2 v = none i = stepjll line = 33 c=black;
axis1 order=(0 to 1 by .2) label=(a=90 'Estimated Survial Function') minor=none;
axis2 order=(0 to 8 by 2) label=('Follow Up Time (Years)') minor=none;
legend1 label=none value=('Males' 'Females')
       position=(bottom left inside) mode=share down=2 ;
proc gplot data = f89;
plot (s_male s_female)*time / overlay vaxis = axis1 haxis = axis2 legend = legend1;
run;
quit;
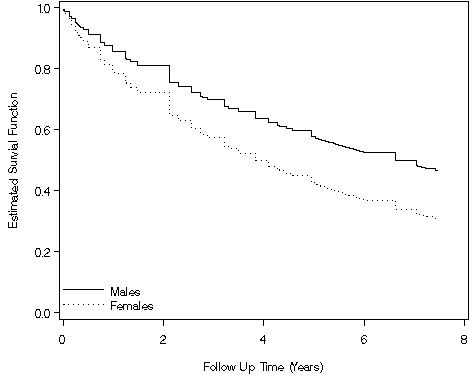
Table 8.8, page 277
ods select ParameterEstimates;
proc lifereg data = whas100;
model time*folstatus(0) = gender age ga bmi / distribution = llogistic;
run;
The LIFEREG Procedure

                    Analysis of Parameter Estimates

                          Standard   95% Confidence     Chi-
Parameter     DF Estimate    Error       Limits       Square Pr > ChiSq

Intercept      1   3.4679   2.0260  -0.5031   7.4388    2.93     0.0870
GENDER         1  -4.6949   2.2915  -9.1862  -0.2035    4.20     0.0405
AGE            1  -0.0651   0.0210  -0.1062  -0.0239    9.60     0.0019
ga             1   0.0587   0.0313  -0.0026   0.1200    3.52     0.0606
BMI            1   0.1100   0.0458   0.0203   0.1997    5.77     0.0163
Scale          1   1.0420   0.1261   0.8220   1.3210
Figure 8.10, page 278
proc lifereg data = f88;
model time*folstatus(0) = gender cage gca cbmi / distribution = loglogistic;
run;
* intercept = 1.883391 and scale = 1.042045;
data f810;
set whas100;
t_model=(1/1.042045)* exp(-1.883391/1.042045)*(time**((1/1.042045)-1))/(1+exp(-1.883391/1.042045)*(time**(1/1.042045)));
t_125=(1/1.25)* exp(-1.883391/1.25)*(time**((1/1.25)-1))/(1+exp(-1.883391/1.25)*(time**(1/1.25)));
t_5=(1/0.5)* exp(-1.883391/0.5)*(time**((1/0.5)-1))/(1+exp(-1.883391/0.5)*(time**(1/0.5)));
t_25=(1/0.25)* exp(-1.883391/0.25)*(time**((1/0.25)-1))/(1+exp(-1.883391/0.25)*(time**(1/0.25)));
run;

proc sort data = f810;
by time;
run;

goptions reset = all;
symbol1 v = none i= join line = 1 c=black;
symbol2 v = none i = join line = 3 c=black;
symbol3 v = none i = join line = 14 c=black;
symbol4 v = none i = join line = 33 c=black;
axis1 order=(0 to .4 by .1) label=(a=90 'Log Logistic Hazard') minor=none;
axis2 order=(0 to 8 by 2) label=('Survival Up Time (Years)') minor=none;
legend1 label=none value=('Fitted Model' 'Sigma = 1.25' 'Sigma = 0.5' 'Sigma = 0.25')
       position=(top center inside) mode=share down=4;
proc gplot data = f810;
plot (t_model t_125 t_5 t_25)*time / overlay vaxis = axis1 haxis = axis2 legend = legend1;
run;
quit;
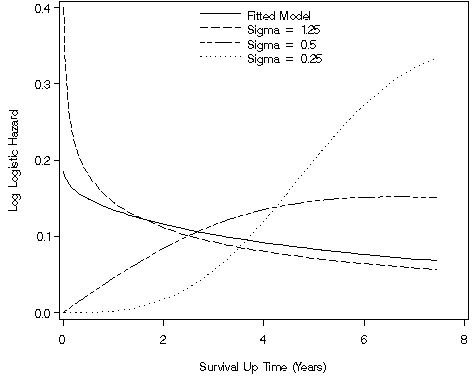
Figure 8.11, page 279
ods output CovB=covb_811;
ods output ParameterEstimates=parms;
proc lifereg data = whas100;
  model time*folstatus(0) = gender age ga bmi /dist=llogistic covb;
  output out = fig8_11 xbeta=xbeta;
run;
data _null_;
set parms;
if Parameter="Scale" then call symput('sigma', estimate);
run;
* the order is: intercept, variables, scale;
data fig8_11a;
  set fig8_11;
  zhat = (log(time) - xbeta)/σ
  mgale = folstatus - log(1+exp(zhat));
  cpart = folstatus - (1+folstatus)*exp(zhat)/(1+exp(zhat));
  lcons = cpart/σ  /*for the intercept term*/
  lgender = gender*cpart/σ
  lage    = age*cpart/σ
  lga    = ga*cpart/σ
  lbmi    = bmi*cpart/σ
  lbcon1 =  folstatus + zhat*cpart; /* for the scale term*/
run;
proc iml;
  use fig8_11a;
  read all variables {lcons lgender lage lga lbmi lbcon1} into L;
  read all variables {id folstatus gender age ga bmi mgale} into X;
  use covb_811;
  read all  var _num_ into V;
   H = I(6);
  H[6,6]=1/σ
  V1 = H*V*H;
  dbeta = L*V1;
  ld = j(100, 1, 0);
  do i = 1 to 100;
   ld[i] = L[i,]*V1*t(L[i,]);
  end;
  create ssr_fig811 var
   {id folstatus gender age ga bmi mgale
   ss_cons ss_gender ss_age ss_ga ss_bmi ss_bcon1 ld};
  W = X || dbeta ||ld;
  append from W;
quit;
***EMPTY GRAPHICS CATALOG;
proc greplay nofs igout=gseg;
delete _all_;
run;
quit;

goptions reset=all htext = 2 htitle = 3;
symbol v = dot;
axis1 order=(-1 to 1 by .5) label=(a=90 'Scaled Score Residuals') minor=none;
axis2 offset=(4 cm, 4 cm) value=('Male' 'Female') order=(0 1) label=('Gender') minor=none;
title 'Figure 8.11a';
proc gplot data = ssr_fig811;
plot ss_gender*gender / vaxis = axis1 haxis = axis2 name = "f811a" noframe;
run;
quit;

goptions reset=all htext = 2 htitle = 3;
symbol v = dot;
axis1 order=(-.01 to .005 by .005) label=(a=90 'Scaled Score Residuals') minor=none;
axis2 order=(20 to 100 by 20) label=('Age (Years)') minor=none;
title 'Figure 8.11b';
proc gplot data = ssr_fig811;
plot ss_age*age / vaxis = axis1 haxis = axis2 name = "f811b" noframe;
run;
quit;

goptions reset=all htext = 2 htitle = 3;
symbol v = dot;
axis1 order=(-.015 to .01 by .005) label=(a=90 'Scaled Score Residuals') minor=none;
axis2 order=(20 to 100 by 20) label=('Age (Years)') minor=none;
title 'Figure 8.11c';
proc gplot data = ssr_fig811;
plot ss_ga*age / vaxis = axis1 haxis = axis2 name = "f811c" noframe;
where gender = 1;
run;
quit;

goptions reset=all htext = 2 htitle = 3;
symbol v = dot;
axis1 order=(-.01 to .03 by .01) label=(a=90 'Scaled Score Residuals') minor=none;
axis2 order=(15 to 40 by 5) label=('Body Mass Index (kg/m**2)') minor=none;
title 'Figure 8.11d';
proc gplot data = ssr_fig811;
plot ss_bmi*bmi / vaxis = axis1 haxis = axis2 name = "f811d" noframe;
run;
quit;
title;

goptions reset=all;
proc greplay igout=work.gseg tc=sashelp.templt template=l2r2 nofs;
treplay 1:f811a 2:f811c 3:f811b 4:f811d;
run;
quit;
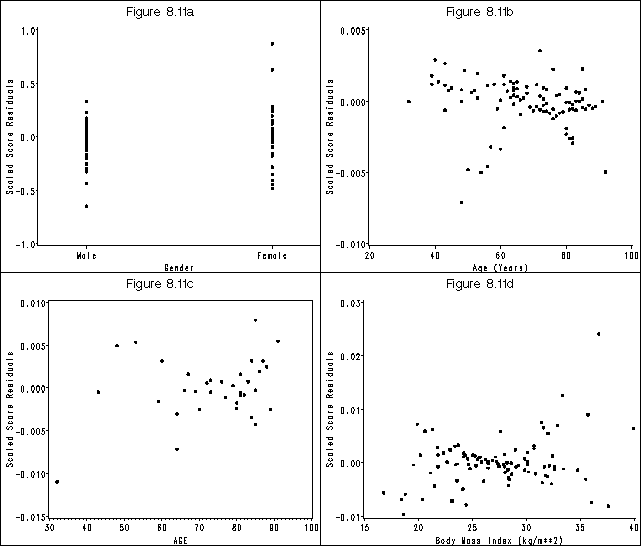
Figure 8.12, page 280
data fig812;
set ssr_fig811;
a = 1;
run;
goptions reset=all;
proc boxplot data= fig812;
plot ss_bcon1*a;
run;
quit;
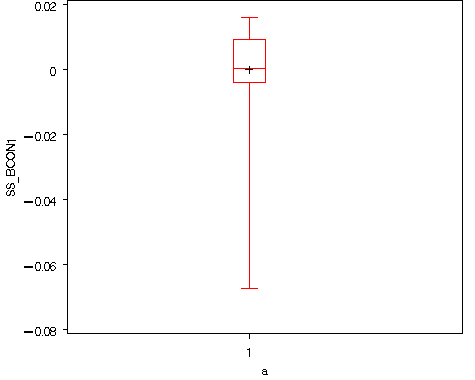
Table 8.9, page 280. We first identify the observations that appear highlighted in Figures 8.11, 8.12 and 8.13 and then generate the table.
data t89; set  ssr_fig811;
keep id;
if (gender = 0 & ss_gender < -.5) or
	(gender = 1 & ss_gender > .5) or
	(ss_age < -.006) or
	(ss_ga < -.01) or
	(ss_bmi > .02) or
	(ss_bcon1 < -.06) or
	(mgale < .8 & ld > .3) or
	(mgale > .9 & ld > .45);
run;

proc print data = t89 noobs;
run;

  ID
   1
  30
  31
  56
  67
  97

proc print data = fig84_b noobs;
var id gender age bmi ;
format bmi f4.1;
where id in(1, 30, 31, 56, 67, 97);
format gender gdr.;
run;
ID    GENDER    AGE     BMI

 1    Male       65    31.4
30    Female     85    36.7
31    Male       72    28.0
56    Female     64    24.4
67    Male       48    31.6
97    Female     32    39.9
Figure 8.13, page 281
goptions reset=all;
symbol1 v = circle c=black;
symbol2 v = dot c=black;
legend1 label=none value=(tick=2 justify=l 'Non-censored' tick=1 justify = l 'Censored')
       position=(top left inside) mode=share down=2 ;
axis1 order=(0 to .5 by .1) label=(a=90 'Likelihood Displacement') minor=none;
axis2 order=(-1 to 1 by .5) label=('Martingale Residuals') minor=none;
proc gplot data = ssr_fig811;
plot ld*mgale=folstatus / vaxis = axis1 haxis = axis2 legend = legend1;
run;
quit;
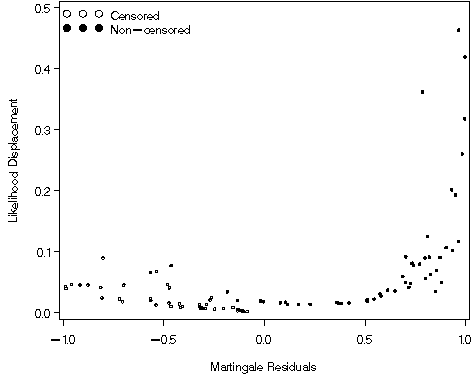
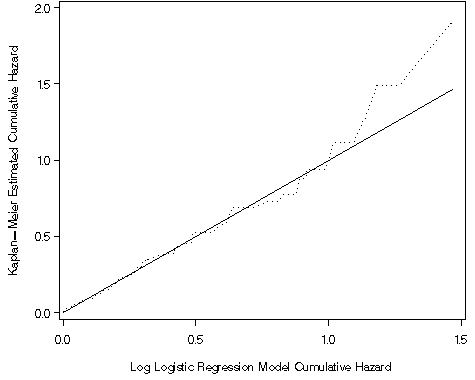
Figure 8.14, page 282
proc lifereg data = whas100;
model time*folstatus(0) = gender age ga bmi / distribution = loglogistic;
output out = fig814 xbeta = xb cres = cr;
run;

proc lifetest data = fig814 outsurv = surv814;
time cr*folstatus(0);
run;

data surv814_1;
set surv814;
hkm = -log(survival);
run;

goptions reset = all;
symbol1 v = none i=join line = 1 c=black;
symbol2 v = none i = join line = 33 c=black;
axis1 order=(0 to 2 by .5) label=(a=90 'Kaplan-Meier Estimated Cumulative Hazard') minor=none;
axis2 order=(0 to 1.5 by .5) label=('Log Logistic Regression Model Cumulative Hazard') minor=none;
proc gplot data = surv814_1;
plot (cr Hkm)*cr / overlay vaxis = axis1 haxis = axis2;
run;
quit;
