Page 380 Table 14.2 Principal components analysis for standardized CESD scale items (depression data set)
NOTE: The n = 5 option on the proc princomp statement tells SAS that we only want the first five factors.
data depress;
set "c:\cama4\depress";
run;
proc princomp data = depress n = 5;
var c1-c20;
run;
<some output omitted>
The PRINCOMP Procedure

                              Eigenvectors

            Prin1         Prin2         Prin3         Prin4         Prin5

C1       0.277438      -.144979      -.057702      0.002724      -.088268
C2       0.313183      0.027136      -.031630      -.247811      -.024397
C3       0.267798      -.154720      -.034590      -.247247      0.218305
C4       0.243554      -.319404      -.176943      0.071551      0.172925
C5       0.286784      -.049717      -.138388      -.279353      0.041111
C6       0.220570      0.053395      -.224213      -.182286      0.339874
C7       0.284370      -.164359      0.018960      0.076061      0.086999
C8       0.108096      -.304519      -.110325      0.556703      0.097606
C9       0.175781      -.168999      0.396225      0.014631      -.535478
C10      0.276625      -.045423      0.083456      -.008415      -.365054
C11      0.243270      -.104819      0.131395      -.041382      -.241930
C12      0.179019      0.229984      -.163432      -.145063      -.036843
C13      0.125906      0.212631      -.264529      0.540020      -.095286
C14      0.180253      0.401483      0.101409      0.246105      0.084712
C15      0.200363      0.209780      -.270323      -.031213      -.083408
C16      0.192430      0.417446      0.185012      0.046739      0.039931
C17      0.209684      0.390480      0.086023      0.068401      0.049913
C18      0.171712      0.015325      -.201930      0.062862      -.275225
C19      0.131489      0.056866      0.632607      0.023179      0.334922
C20      0.235700      -.228260      0.193254      0.240427      0.290938
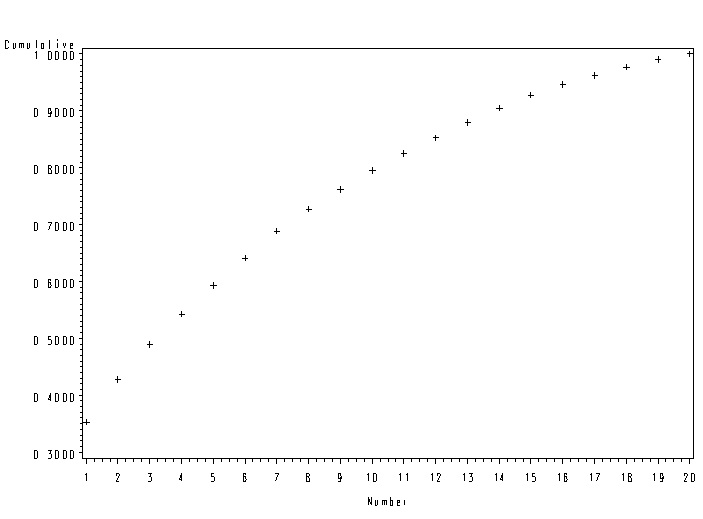
Page 381 Figure 14.5 Eigenvalues and cumulative percentages of total variance for depression data
Panel A:
NOTE: You need use the ODS trace to find out which table contains the information that you need to make this plot. In this example, it was the table called eigenvalues. This table was outputted to a data set called figure145a and then used in the proc gplot to create the graph. The variables cumulative and number are part of the outputted data set, not the original (depress) data set.
ods output eigenvalues = figure145a;
proc princomp data = depress;
var c1-c20;
run;

proc gplot data = figure145a;
plot cumulative*number;
run;
quit;
Panel B:
NOTE: You need to use proc factor to get the scree plot, as it is not available in proc princomp.
proc factor data = depress scree;
var c1 - c20;
run;
The FACTOR Procedure
Initial Factor Method: Principal Components

Scree Plot of Eigenvalues
  7 +         1
    |
    |
    |
    |
    |
  6 +
    |
    |
    |
    |
    |
  5 +
    |
    |
    |
E   |
i   |
g 4 +
e   |
n   |
v   |
a   |
l   |
u 3 +
e   |
s   |
    |
    |
    |
  2 +
    |
    |
    |             2
    |
    |                 3
  1 +                     4   5   6   7
    |                                     8
    |                                         9   0   1
    |                                                     2   3   4   5
    |                                                                     6   7   8   9
    |                                                                                     0
  0 +
    ------+-------+-------+-------+-------+-------+-------+-------+-------+-------+-------+-----
          0       2       4       6       8      10      12      14      16      18      20