This page shows how to obtain the results from Chatterjee, Hadi and Price’s Chapter 2 using SAS.
Use data in file p025a. Note the semicolon on the line following after the data indicates the end of the data.
options nocenter;

data p025a;
input y x;
datalines;
 1      -7
14      -6
25      -5
34      -4
41      -3
46      -2
49      -1
50       0
49       1
46       2
41       3
34       4
25       5
14       6
 1       7
;
run;
Table 2.3, page 25.
proc print data=p025a;
run;

Obs     y     x
  1     1    -7
  2    14    -6
  3    25    -5
  4    34    -4
  5    41    -3
  6    46    -2
  7    49    -1
  8    50     0
  9    49     1
 10    46     2
 11    41     3
 12    34     4
 13    25     5
 14    14     6
 15     1     7
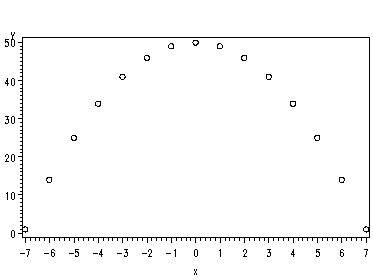
Figure 2.2, page 25.
Note: The symbol statement before proc gplot sets the plotting symbol for the scatter plot to a circle.
symbol1 v=circle;
proc gplot data=p025a;
  plot y*x;
run;
Use data in file p025b.
data p025b;
input y1 x1 y2 x2 y3 x3 y4 x4;
datalines;
8.04    10      9.14    10      7.46    10      6.58    8
6.95    8       8.14    8       6.77    8       5.76    8
7.58    13      8.74    13      12.74   13      7.71    8
8.81    9       8.77    9       7.11    9       8.84    8
8.33    11      9.26    11      7.81    11      8.47    8
9.96    14      8.1     14      8.84    14      7.04    8
7.24    6       6.13    6       6.08    6       5.25    8
4.26    4       3.1     4       5.39    4       12.5    19
10.84   12      9.13    12      8.15    12      5.56    8
4.82    7       7.26    7       6.42    7       7.91    8
5.68    5       4.74    5       5.73    5       6.89    8
;
run;
Part of Table 2.4, page 25.
proc print data=p025b;
run;

Obs      y1     x1     y2     x2      y3     x3      y4     x4
  1     8.04    10    9.14    10     7.46    10     6.58     8
  2     6.95     8    8.14     8     6.77     8     5.76     8
  3     7.58    13    8.74    13    12.74    13     7.71     8
  4     8.81     9    8.77     9     7.11     9     8.84     8
  5     8.33    11    9.26    11     7.81    11     8.47     8
  6     9.96    14    8.10    14     8.84    14     7.04     8
  7     7.24     6    6.13     6     6.08     6     5.25     8
  8     4.26     4    3.10     4     5.39     4    12.50    19
  9    10.84    12    9.13    12     8.15    12     5.56     8
 10     4.82     7    7.26     7     6.42     7     7.91     8
 11     5.68     5    4.74     5     5.73     5     6.89     8
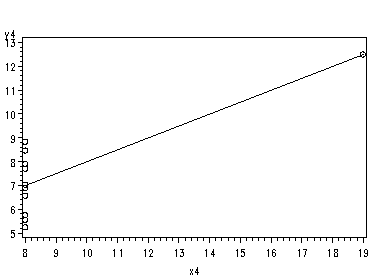
Fig. 2.3(a), page 26.
Note: The i=r in the symbol statement includes the regression line in the scatter plot.
symbol1 v=circle i=r;

proc gplot data=p025b;
  plot y1*x1;
  plot y2*x2;
  plot y3*x3
  plot y4*x4;
run;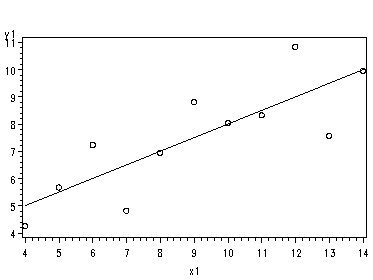
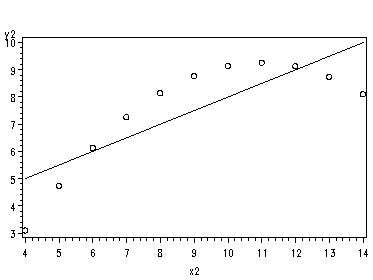
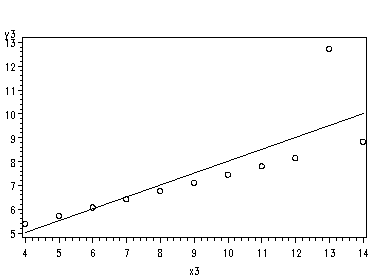
Use data in file p027.
data p027;
input y x;
datalines;
23      1
29      2
49      3
64      4
74      4
87      5
96      6
97      6
109     7
119     8
149     9
145     9
154     10
166     10
;
run;
Commands to create Table 2.6,page 28.
Note: New variables are created in the datastep. The set statement starts the data step with the observations in the SAS dataset p027.
proc means data=p027;
run;

The MEANS Procedure

Variable     N            Mean         Std Dev         Minimum         Maximum
------------------------------------------------------------------------------
y           14      97.2142857      46.2171772      23.0000000     166.0000000
x           14       6.0000000       2.9612887       1.0000000      10.0000000
------------------------------------------------------------------------------

data p027a;
  set p027;
  dy = y - 97.21;
  dx = x - 6;
  dy2 = dy**2;
  dx2 = dx**2;
  dxy = dx*dy;
run;
Table 2.6, page 28.
proc print data=p027a;
run;

Obs     y      x        dy    dx        dy2    dx2       dxy
  1     23     1    -74.21    -5    5507.12     25    371.05
  2     29     2    -68.21    -4    4652.60     16    272.84
  3     49     3    -48.21    -3    2324.20      9    144.63
  4     64     4    -33.21    -2    1102.90      4     66.42
  5     74     4    -23.21    -2     538.70      4     46.42
  6     87     5    -10.21    -1     104.24      1     10.21
  7     96     6     -1.21     0       1.46      0      0.00
  8     97     6     -0.21     0       0.04      0      0.00
  9    109     7     11.79     1     139.00      1     11.79
 10    119     8     21.79     2     474.80      4     43.58
 11    149     9     51.79     3    2682.20      9    155.37
 12    145     9     47.79     3    2283.88      9    143.37
 13    154    10     56.79     4    3225.10     16    227.16
 14    166    10     68.79     4    4732.06     16    275.16
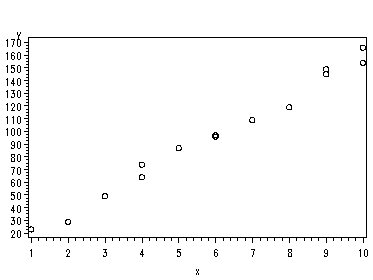
Fig 2.4, page 28.
Note: The i=none turns off the regression line option.
symbol1 v=circle i=none;

proc gplot data=p027;
  plot y*x;
run;
Table 2.9, page 36.
Note: In this example, the output option adds the predicted values, residuals and two standard errors to the original observations in a new SAS dataset named p027b.
proc reg data=p027;
  model y = x;
  output out=p027b predicted=yhat residual=e stdi=seyhat stdp=semu;
run;

The REG Procedure
Model: MODEL1
Dependent Variable: y

                             Analysis of Variance

                                    Sum of           Mean
Source                   DF        Squares         Square    F Value    Pr > F
Model                     1          27420          27420     943.20    <.0001
Error                    12      348.84837       29.07070
Corrected Total          13          27768


Root MSE              5.39172    R-Square     0.9874
Dependent Mean       97.21429    Adj R-Sq     0.9864
Coeff Var             5.54623

                        Parameter Estimates

                     Parameter       Standard
Variable     DF       Estimate          Error    t Value    Pr > |t|
Intercept     1        4.16165        3.35510       1.24      0.2385
x             1       15.50877        0.50498      30.71      <.0001
Table 2.7, page 32.
proc print data=p027b;
  var yhat e;
run;

Obs      yhat         e
  1     19.670     3.32957
  2     35.179    -6.17920
  3     50.688    -1.68797
  4     66.197    -2.19674
  5     66.197     7.80326
  6     81.706     5.29449
  7     97.214    -1.21429
  8     97.214    -0.21429
  9    112.723    -3.72306
 10    128.232    -9.23183
 11    143.741     5.25940
 12    143.741     1.25940
 13    159.249    -5.24937
 14    159.249     6.75063
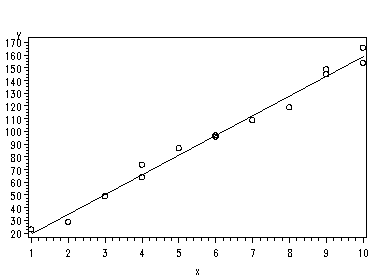
Fig. 2.5, page 32.
symbol1 v=circle i=r;

proc gplot data=p027;
  plot y*x;
run;
Standard error for a predicted score, page 39.
proc print data=p027b;
  var seyhat;
run;

Obs     seyhat
  1    6.12555
  2    5.93526
  3    5.78293
  4    5.67161
  5    5.67161
  6    5.60376
  7    5.58097
  8    5.58097
  9    5.60376
 10    5.67161
 11    5.78293
 12    5.78293
 13    5.93526
 14    5.93526
Standard error for mean prediction, page 39.
proc print data=p027b;
  var y x semu;
run;

Obs     y      x      semu
  1     23     1    2.90717
  2     29     2    2.48124
  3     49     3    2.09082
  4     64     4    1.75969
  5     74     4    1.75969
  6     87     5    1.52692
  7     96     6    1.44100
  8     97     6    1.44100
  9    109     7    1.52692
 10    119     8    1.75969
 11    149     9    2.09082
 12    145     9    2.09082
 13    154    10    2.48124
 14    166    10    2.48124
Correlations, page 43.
proc corr data=p027b;
  var y x yhat;
run;

The CORR Procedure

          Pearson Correlation Coefficients, N = 14
                  Prob > |r| under H0: Rho=0

                                 y             x          yhat
y                          1.00000       0.99370       0.99370
                                          <.0001        <.0001

x                          0.99370       1.00000       1.00000
                            <.0001                      <.0001

yhat                       0.99370       1.00000       1.00000
Predicted Value of y        <.0001        <.0001

