Consumer Expenditure and Money Stock data, table 8.1, p. 203
data p203;
  input Year Quarter Expend Stock ;
cards;
1952 1 214.6 159.3
1952 2 217.7 161.2
1952 3 219.6 162.8
1952 4 227.2 164.6
1953 1 230.9 165.9
1953 2 233.3 167.9
1953 3 234.1 168.3
1953 4 232.3 169.7
1954 1 233.7 170.5
1954 2 236.5 171.6
1954 3 238.7 173.9
1954 4 243.2 176.1
1955 1 249.4 178.0
1955 2 254.3 179.1
1955 3 260.9 180.2
1955 4 263.3 181.2
1956 1 265.6 181.6
1956 2 268.2 182.5
1956 3 270.4 183.3
1956 4 275.6 184.3
;
run;
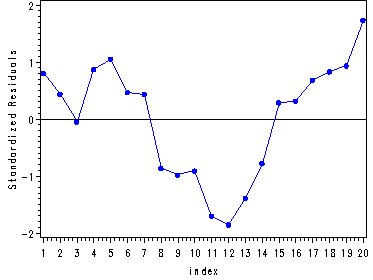
Table 8.2 and fig. 8.1, p. 203.
goptions reset = all;

symbol v=dot h=.8 c=blue;
proc reg data = p203;
  model expend = stock;
  output out=temp student.=student;
run;
data temp;
  set temp;
  id = _n_;
run;
symbol v=dot h=.8 i=join c=blue;
axis1 label=(angel=90 'Standardized Residuals');
proc gplot data = temp;
  plot student*id / vaxis=axis1 vref=0;
run;
quit;
The REG Procedure Model: MODEL1 Dependent Variable: ExpendAnalysis of Variance
Sum of Mean Source DF Squares Square F Value Pr > F
Model 1 6395.76657 6395.76657 403.22 <.0001 Error 18 285.51093 15.86172 Corrected Total 19 6681.27750
Root MSE 3.98268 R-Square 0.9573 Dependent Mean 243.47500 Adj R-Sq 0.9549 Coeff Var 1.63576
Parameter Estimates
Parameter Standard Variable DF Estimate Error t Value Pr > |t|
Intercept 1 -154.71916 19.85003 -7.79 <.0001 Stock 1 2.30037 0.11456 20.08 <.0001

Code for calculating the Durbin-Watson statistic for autocorrelation, p. 205.
proc autoreg data = p203; model expend = stock/ dw = 2 dwprob; run; quit;The AUTOREG Procedure Dependent Variable Expend Ordinary Least Squares Estimates SSE 285.510934 DFE 18 MSE 15.86172 Root MSE 3.98268 SBC 115.919967 AIC 113.928502 Regress R-Square 0.9573 Total R-Square 0.9573 Durbin-Watson StatisticsOrder DW Pr < DW Pr > DW 1 0.3282 <.0001 1.0000 2 0.7356 0.0007 0.9993 NOTE: Pr<DW is the p-value for testing positive autocorrelation, and Pr>DW is the p-value for testing negative autocorrelation. Standard Approx Variable DF Estimate Error t Value Pr > |t| Intercept 1 -154.7192 19.8500 -7.79 <.0001 Stock 1 2.3004 0.1146 20.08 <.0001
Since Pr < DW was less than 0.05 the conclusion is that positive autocorrelation is present. One solution is to use the Cochrane-Orcutt procedure which can be done by utilizing the cocr macro.
%cocr(temp, expendit, stock index)Housing Starts data, table 8.4, p. 211.
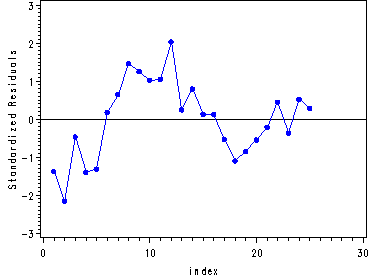
data p211; input H P D ; label H = 'Housing Starts' P = 'Population' D = 'Mortgage Money Index'; cards; 0.09090 2.200 0.03635 0.08942 2.222 0.03345 0.09755 2.244 0.03870 0.09550 2.267 0.03745 0.09678 2.280 0.04063 0.10327 2.289 0.04237 0.10513 2.289 0.04715 0.10840 2.290 0.04883 0.10822 2.299 0.04836 0.10741 2.300 0.05160 0.10751 2.300 0.04879 0.11429 2.340 0.05523 0.11048 2.386 0.04770 0.11604 2.433 0.05282 0.11688 2.482 0.05473 0.12044 2.532 0.05531 0.12125 2.580 0.05898 0.12080 2.605 0.06267 0.12368 2.631 0.05462 0.12679 2.658 0.05672 0.12996 2.684 0.06674 0.13445 2.711 0.06451 0.13325 2.738 0.06313 0.13863 2.766 0.06573 0.13964 2.793 0.07229 ; run;Table 8.5 and Fig. 8.3, p. 212.
proc autoreg data = p211; model H = p/dw=1 dwprob; run; symbol v=dot h=.8 c=blue; proc reg data = p211 noprint; model h = p d; output out=temp student.=student; run; data temp; set temp; id = _n_; run; symbol v=dot h=.8 i=join c=blue; axis1 label=(angel=90 'Standardized Residuals'); proc gplot data = temp; plot student*id / vaxis=axis1 vref=0; run; quit;The AUTOREG Procedure Dependent Variable H Housing Starts Ordinary Least Squares Estimates SSE 0.00038291 DFE 23 MSE 0.0000166 Root MSE 0.00408 SBC -199.77982 AIC -202.21757 Regress R-Square 0.9252 Total R-Square 0.9252 Durbin-Watson 0.6208 Pr < DW <.0001 Pr > DW 1.0000 NOTE: Pr<DW is the p-value for testing positive autocorrelation, and Pr>DW is the p-value for testing negative autocorrelation. Standard Approx Variable Variable DF Estimate Error t Value Pr > |t| Label Intercept 1 -0.0609 0.0104 -5.85 <.0001 P 1 0.0714 0.004234 16.87 <.0001 Population

Table 8.6, p. 213.
proc autoreg data = p211; model h = p d/dw=1 dwprob; run;The AUTOREG Procedure Dependent Variable H Housing Starts Ordinary Least Squares Estimates SSE 0.00013783 DFE 22 MSE 6.26511E-6 Root MSE 0.00250 SBC -222.10513 AIC -225.76175 Regress R-Square 0.9731 Total R-Square 0.9731 Durbin-Watson 1.8524 Pr < DW 0.2316 Pr > DW 0.7684 NOTE: Pr<DW is the p-value for testing positive autocorrelation, and Pr>DW is the p-value for testing negative autocorrelation. Standard Approx Variable DF Estimate Error t Value Pr > |t| Variable Label Intercept 1 -0.0104 0.0103 -1.01 0.3220 P 1 0.0347 0.006425 5.39 <.0001 Population D 1 0.7605 0.1216 6.25 <.0001 Mortgage Money IndexFig. 8.4, p. 213.
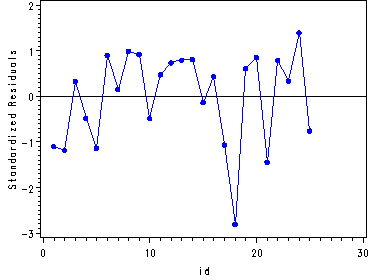
proc reg data = p211 noprint; model h = p d; output out=temp student.=student; run; data temp; set temp; id = _n_; run; symbol v=dot h=.8 i=join c=blue; axis1 label=(angel=90 'Standardized Residuals'); proc gplot data = temp; plot student*id / vaxis=axis1 vref=0; run; quit;

Creating the standardized variables, p. 214.
proc sql; create table p211std as select *, (h - mean(h))/std(h) as stdh, (p - mean(p))/std(p) as stdp, (d - mean(d))/std(d) as stdd from p211; quit;Regressing the standardized h on standardized p and standardized d. Formula at the top of p. 214.
proc reg data = p211std; model stdh = stdp stdd; run; quit;The REG Procedure Model: MODEL1 Dependent Variable: stdhAnalysis of Variance
Sum of Mean Source DF Squares Square F Value Pr > F Model 2 23.35385 11.67693 397.58 <.0001 Error 22 0.64615 0.02937 Corrected Total 24 24.00000
Root MSE 0.17138 R-Square 0.9731 Dependent Mean -1.954E-16 Adj R-Sq 0.9706 Coeff Var -8.77065E16 Parameter Estimates
Parameter Standard Variable DF Estimate Error t Value Pr > |t| Intercept 1 7.80117E-17 0.03428 0.00 1.0000 stdp 1 0.46681 0.08654 5.39 <.0001 stdd 1 0.54126 0.08654 6.25 <.0001
The Ski Sales data, table 8.8, p. 217.
data p217; length quarter $ 5; input Quarter Sales PDI Season ; cards; Q1/64 37.0 109 1 Q2/64 33.5 115 0 Q3/64 30.8 113 0 Q4/64 37.9 116 1 Q1/65 37.4 118 1 Q2/65 31.6 120 0 Q3/65 34.0 122 0 Q4/65 38.1 124 1 Q1/66 40.0 126 1 Q2/66 35.0 128 0 Q3/66 34.9 130 0 Q4/66 40.2 132 1 Q1/67 41.9 133 1 Q2/67 34.7 135 0 Q3/67 38.8 138 0 Q4/67 43.7 140 1 Q1/68 44.2 143 1 Q2/68 40.4 147 0 Q3/68 38.4 148 0 Q4/68 45.4 151 1 Q1/69 44.9 153 1 Q2/69 41.6 156 0 Q3/69 44.0 160 0 Q4/69 48.1 163 1 Q1/70 49.7 166 1 Q2/70 43.9 171 0 Q3/70 41.6 174 0 Q4/70 51.0 175 1 Q1/71 52.0 180 1 Q2/71 46.2 184 0 Q3/71 47.1 187 0 Q4/71 52.7 189 1 Q1/72 52.2 191 1 Q2/72 47.0 193 0 Q3/72 47.8 194 0 Q4/72 52.8 196 1 Q1/73 54.1 199 1 Q2/73 49.5 201 0 Q3/73 49.5 202 0 Q4/73 54.3 204 1 ; run;Table 8.7, p. 215.
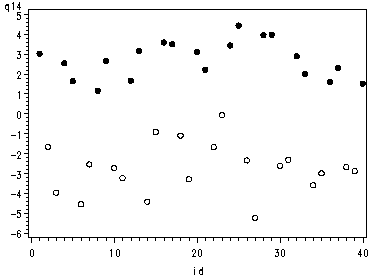
proc autoreg data = p217; model sales = pdi/dw = 1; output out = resid r= resid; run; quit;The AUTOREG Procedure Dependent Variable Sales Ordinary Least Squares Estimates SSE 346.433289 DFE 38 MSE 9.11667 Root MSE 3.01938 SBC 207.245274 AIC 203.867515 Regress R-Square 0.8006 Total R-Square 0.8006 Durbin-Watson 1.9684 Standard Approx Variable DF Estimate Error t Value Pr > |t| Intercept 1 12.3921 2.5394 4.88 <.0001 PDI 1 0.1979 0.0160 12.35 <.0001Fig. 8.5, p. 215. Plotting the residual versus the index with different symbols:
Black Dots = Quarter 1 and 4
Circle = Quarter 2 and 3data resid; set resid; id + 1; season1 = substr(Quarter, 1, 2); q14 = .; if season1 = 'Q1' then q14 = resid; if season1 = 'Q4' then q14 = resid; q23 = .; if season1 = 'Q2' then q23 = resid; if season1 = 'Q3' then q23 = resid; run; symbol1 v=dot h=.8 c=blue; proc gplot data = resid; plot q14*id='dot' q23*id='circle' / overlay; run; quit;

