/* Education Expenditure data, table 7.3, p. 189 */
data p189;
  length state $ 2 ;
  input State Y X1 X2 X3 Region ;
  label x1 = 'Income'
        x2 = 'Residents under 18'
        x3 = 'Residents in Urban Areas'
         y = 'Expenditure';
cards;
ME 235 3944 325 508 1
NH 231 4578 323 564 1
VT 270 4011 328 322 1
MA 261 5233 305 846 1
RI 300 4780 303 871 1
CT 317 5889 307 774 1
NY 387 5663 301 856 1
NJ 285 5759 310 889 1
PA 300 4894 300 715 1
OH 221 5012 324 753 2
IN 264 4908 329 649 2
IL 308 5753 320 830 2
MI 379 5439 337 738 2
WI 342 4634 328 659 2
MN 378 4921 330 664 2
IA 232 4869 318 572 2
MO 231 4672 309 701 2
ND 246 4782 333 443 2
SD 230 4296 330 446 2
NB 268 4827 318 615 2
KS 337 5057 304 661 2
DE 344 5540 328 722 3
MD 330 5331 323 766 3
VA 261 4715 317 631 3
WV 214 3828 310 390 3
NC 245 4120 321 450 3
SC 233 3817 342 476 3
GA 250 4243 339 603 3
FL 243 4647 287 805 3
KY 216 3967 325 523 3
TN 212 3946 315 588 3
AL 208 3724 332 584 3
MS 215 3448 358 445 3
AR 221 3680 320 500 3
LA 244 3825 355 661 3
OK 234 4189 306 680 3
TX 269 4336 335 797 3
MT 302 4418 335 534 4
ID 268 4323 344 541 4
WY 323 4813 331 605 4
CO 304 5046 324 785 4
NM 317 3764 366 698 4
AZ 332 4504 340 796 4
UT 315 4005 378 804 4
NV 291 5560 330 809 4
WA 312 4989 313 726 4
OR 316 4697 305 671 4
CA 332 5438 307 909 4
AK 546 5613 386 484 4
HI 311 5309 333 831 4
;
run;

/* Table 7.4, fig. 7.3-7.7, p. 191-192 */
goptions reset = all;

symbol v=dot h=.8 c=blue;
proc reg data = p189;
  var region;
  model y = x1 x2 x3;
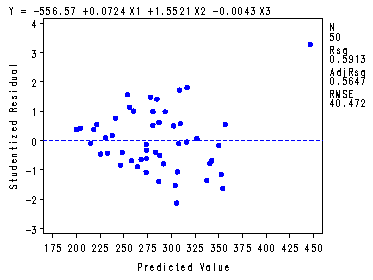
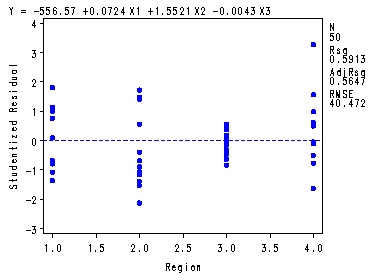
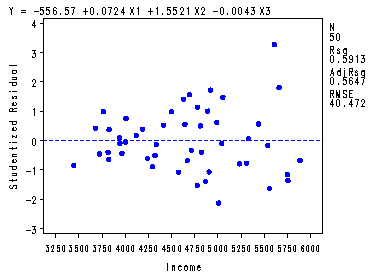
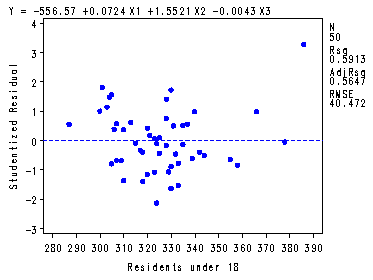
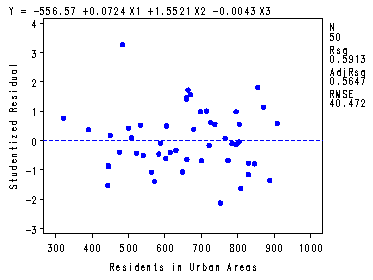
  plot student.*p. student.*region student.*x1 student.*x2 student.*x3;
run;
quit;

The REG Procedure
Model: MODEL1
Dependent Variable: Y Expenditure

                             Analysis of Variance

                                    Sum of           Mean
Source                   DF        Squares         Square    F Value    Pr > F
Model                     3         109020          36340      22.19    <.0001
Error                    46          75348     1637.99091
Corrected Total          49         184368

Root MSE             40.47210    R-Square     0.5913
Dependent Mean      284.60000    Adj R-Sq     0.5647
Coeff Var            14.22070
                                      Parameter Estimates

                                                 Parameter       Standard
Variable     Label                       DF       Estimate          Error    t Value    Pr > |t|
Intercept    Intercept                    1     -556.56804      123.19525      -4.52      <.0001
X1           Income                       1        0.07239        0.01160       6.24      <.0001
X2           Residents under 18           1        1.55205        0.31467       4.93      <.0001
X3           Residents in Urban Areas     1       -0.00427
  0.05139      -0.08      0.9342
/* Table 7.5 and fig. 7.8-7.9, p. 193-194. The where statement
  omits Alaska from the analysis. */

symbol v=dot h=.8 c=blue;
proc reg data = p189;
  where State ~= 'AK';
  var region;
  model y = x1 x2 x3;
  output out=outr r=resid ;
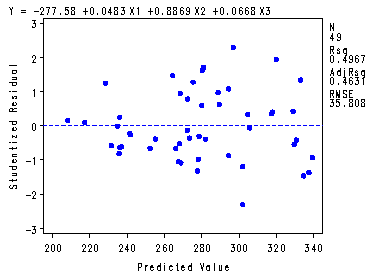
  plot student.*p. student.*region;
run;
quit;

The REG Procedure
Model: MODEL1
Dependent Variable: Y Expenditure

                             Analysis of Variance

                                    Sum of           Mean
Source                   DF        Squares         Square    F Value    Pr > F
Model                     3          56944          18981      14.80    <.0001
Error                    45          57700     1282.21687
Corrected Total          48         114644

Root MSE             35.80806    R-Square     0.4967
Dependent Mean      279.26531    Adj R-Sq     0.4631
Coeff Var            12.82224
                                      Parameter Estimates

                                                 Parameter       Standard
Variable     Label                       DF       Estimate          Error    t Value    Pr > |t|
Intercept    Intercept                    1     -277.57731      132.42286      -2.10      0.0417
X1           Income                       1        0.04829        0.01215       3.98      0.0003
X2           Residents under 18           1        0.88693        0.33114       2.68      0.0103
X3           Residents in Urban Areas     1        0.06679        0.04934       1.35      0.1826
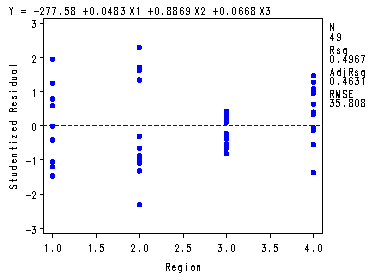
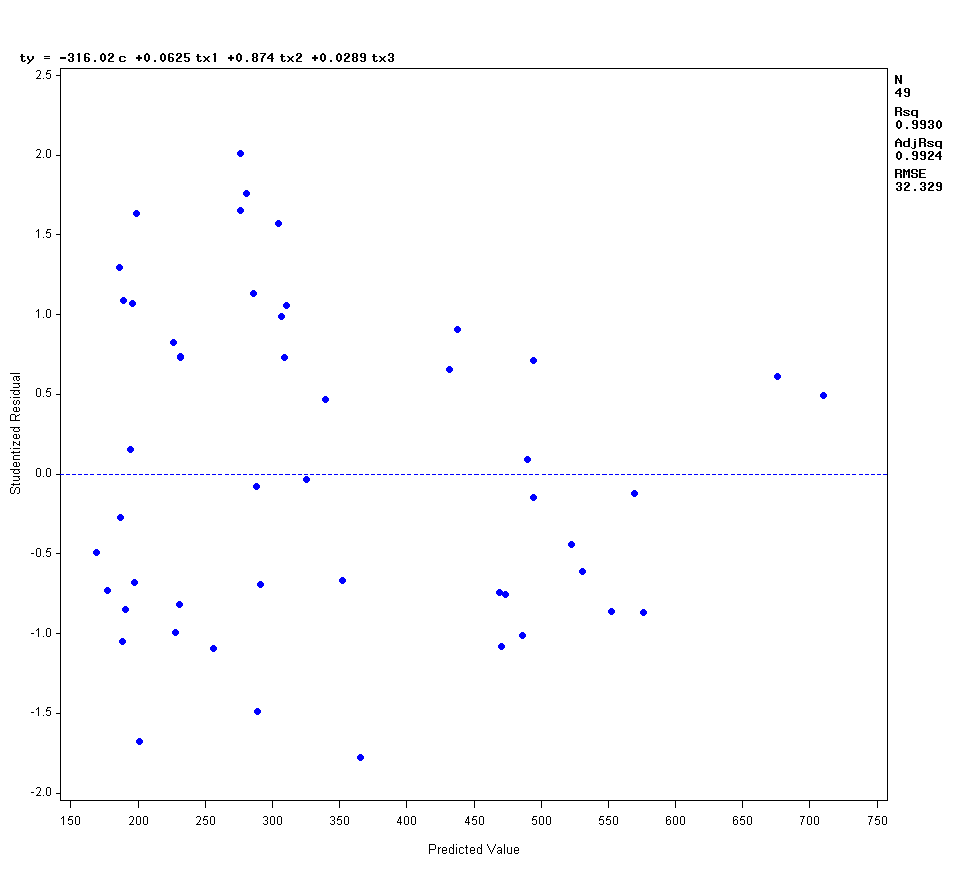
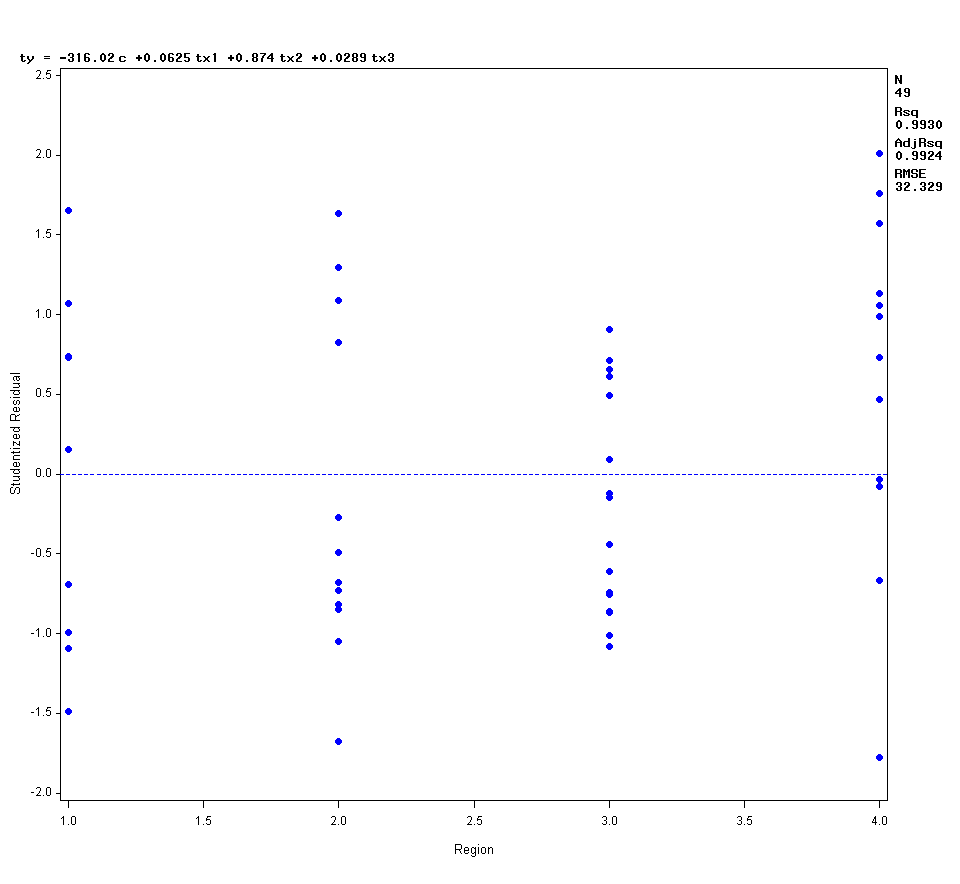
/* By looking at the plot of standardized residuals against region we can observe that the variance for each region is different (the points for each category of region have a different range). In order to fix this problem we create by the appropriate weights and run the regression model again the resulting residuals should have the same variance. */ /* Generating the weights to be used in the WLS, p. 190. */ proc sql; create table outresid as select *, sum(resid*resid)/(count(region) - 1) as ratio from outr group by region; quit; proc sql; create table outresid1 as select *, 1/sqrt(ratio/mean(resid*resid)) as c from outresid; quit; proc sql; create table weighted as select *, y*c as ty, x1*c as tx1, c*x2 as tx2, c*x3 as tx3 from outresid1; quit; /* Table 7.6, p. 195 */ proc sql; select distinct region, count(region) as n, ratio as sigma2, 1/c as cj from weighted group by region; quit;Region n sigma2 cj ------------------------------------ 1 9 1632.502 1.177438 2 12 2658.521 1.502557 3 16 266.0621 0.475338 4 12 1036.825 0.938348/* The WLS part of table 7.7, p. 195 and fig. 7.8-7.9, p. 196 */ symbol v=dot h=.8 c=blue; proc reg data = weighted; var region; model ty = c tx1 tx2 tx3/ noint; plot student.*p. student.*region; run; quit;The REG Procedure Model: MODEL1 Dependent Variable: ty Number of Observations Read 49 Number of Observations Used 49 NOTE: No intercept in model. R-Square is redefined. Analysis of Variance Sum of Mean Source DF Squares Square F Value Pr > F Model 4 6668300 1667075 1595.08 <.0001 Error 45 47031 1045.13869 Uncorrected Total 49 6715332 Root MSE 32.32860 R-Square 0.9930 Dependent Mean 341.57976 Adj R-Sq 0.9924 Coeff Var 9.46444 Parameter Estimates Parameter Standard Variable DF Estimate Error t Value Pr > |t| c 1 -316.02374 77.41893 -4.08 0.0002 tx1 1 0.06246 0.00780 8.00 <.0001 tx2 1 0.87399 0.19840 4.41 <.0001 tx3 1 0.02892 0.03399 0.85 0.3994
