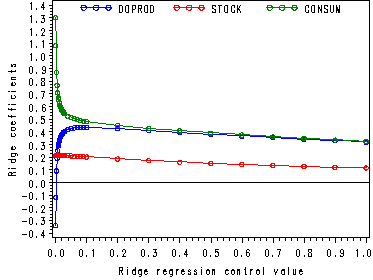
Inputting the French Economy data, p. 233.
data p233;
  input YEAR IMPORT DOPROD STOCK CONSUM;
cards;
49 15.9 149.3 4.2 108.1
50 16.4 161.2 4.1 114.8
51 19 171.5 3.1 123.2
52 19.1 175.5 3.1 126.9
53 18.8 180.8 1.1 132.1
54 20.4 190.7 2.2 137.7
55 22.7 202.1 2.1 146
56 26.5 212.4 5.6 154.1
57 28.1 226.1 5 162.3
58 27.6 231.9 5.1 164.3
59 26.3 239 0.7 167.6
60 31.1 258 5.6 176.8
61 33.3 269.8 3.9 186.6
62 37 288.4 3.1 199.7
63 43.3 304.5 4.6 213.9
64 49 323.4 7 223.8
65 50.3 336.8 1.2 232
66 56.6 353.9 4.5 242.9
;
run;
Creating the standardized variables for the subset of the dataset where year <= 59, p. 264.
data temp;
  set p233;
  if year LE 59;
run;
proc sql;
  create table temp1 as
  select *, (import - mean(import))/std(import)  as importstd,
            (doprod - mean(doprod))/std(doprod) as doprodstd,
	    (consum - mean(consum))/std(consum) as consumstd,
	    (stock - mean(stock))/std(stock) as stockstd
  from temp;
quit;
Table 10.1, p. 265.
proc reg data = temp1;
  model importstd = doprodstd  stockstd consumstd/ noint;
run;
quit;
The REG Procedure
Model: MODEL1
Dependent Variable: importstd
NOTE: No intercept in model. R-Square is redefined.
                             Analysis of Variance
                                    Sum of           Mean
Source                   DF        Squares         Square    F Value    Pr > F
Model                     3        9.91897        3.30632     326.41    <.0001
Error                     8        0.08103        0.01013
Uncorrected Total        11       10.00000
Root MSE              0.10064    R-Square     0.9919
Dependent Mean    7.06506E-17    Adj R-Sq     0.9889
Coeff Var         1.424539E17
                        Parameter Estimates
                     Parameter       Standard
Variable     DF       Estimate          Error    t Value    Pr > |t|
doprodstd     1       -0.33934        0.43405      -0.78      0.4568
stockstd      1        0.21305        0.03213       6.63      0.0002
consumstd     1        1.30268        0.43418       3.00      0.0171
Generating the principal components for the predictor variables, p. 265.
ods listing close;
proc princomp data = p233 out = temp;
 where year <= 59;
 var doprod stock consum;
 ods output EigenVectors=eig;
run;
ods listing;
proc print data = eig;
run;
Obs Variable Prin1 Prin2 Prin31 DOPROD 0.706330 -.035689 0.706982 2 STOCK 0.043501 0.999029 0.006971 3 CONSUM 0.706544 -.025830 -.707197
Standardizing the dependent variable and multiplying the third principal component by -1 in order to have the same results as in the book.
proc sql;
 create table tempstd as
 select *, (import - mean(import))/std(import) as zimport, -1*prin3 as nprin3
 from temp;
quit;
Table 10.2, p. 265.
proc reg data = tempstd;
  model zimport = prin1 prin2 nprin3/noint;
run;
quit;
The REG Procedure
Model: MODEL1
Dependent Variable: zimport
NOTE: No intercept in model. R-Square is redefined.
                             Analysis of Variance
                                    Sum of           Mean
Source                   DF        Squares         Square    F Value    Pr > F
Model                     3        9.91897        3.30632     326.41    <.0001
Error                     8        0.08103        0.01013
Uncorrected Total        11       10.00000
Root MSE              0.10064    R-Square     0.9919
Dependent Mean    7.06506E-17    Adj R-Sq     0.9889
Coeff Var         1.424539E17
                        Parameter Estimates
                     Parameter       Standard
Variable     DF       Estimate          Error    t Value    Pr > |t|
Prin1         1        0.68998        0.02251      30.65      <.0001
Prin2         1        0.19130        0.03186       6.01      0.0003
nprin3        1        1.15968        0.61354       1.89      0.0954
Inputting the data on p. 270.
data p270;
  input u c1 c2 c3 c4;
cards;
   .955      1.467      1.903       -.53      .0389
  -.746      2.136       .238       -.29       -.03
 -2.323      -1.13       .184       -.01      -.094
   -.82        .66      1.577       .179      -.033
   .471      -.359       .484       -.74       .019
  -.299      -.967        .17       .086      -.012
    .21      -.931     -2.135      -.173       .008
   .558      2.232      -.692        .46       .023
 -1.119       .352     -1.432      -.032      -.045
   .496     -1.663      1.828       .851        .02
   .781      1.641     -1.295       .494       .031
   .918     -1.693      -.392       -.02       .037
   .918     -1.746      -.438      -.275       .037
run;
Table 10.5-10.6, p. 270.
proc reg data = p270;
  model u = C1-C4/ noint;
  model u = C1-C3/ noint;
run;
quit;
The REG Procedure
Model: MODEL1
Dependent Variable: u
NOTE: No intercept in model. R-Square is redefined
                             Analysis of Variance
                                    Sum of           Mean
Source                   DF        Squares         Square    F Value    Pr > F
Model                     4       11.99718        2.99930    71530.6    <.0001
Error                     9     0.00037737     0.00004193
Uncorrected Total        13       11.99756
Root MSE              0.00648    R-Square     1.0000
Dependent Mean    5.12411E-17    Adj R-Sq     1.0000
Coeff Var         1.263705E16
                        Parameter Estimates
                     Parameter       Standard
Variable     DF       Estimate          Error    t Value    Pr > |t|
c1            1       -0.00180        0.00125      -1.44      0.1837
c2            1       -0.00255        0.00149      -1.71      0.1206
c3            1        0.00165        0.00433       0.38      0.7122
c4            1       24.76590        0.04630     534.90      <.0001
The REG Procedure
Model: MODEL2
Dependent Variable: u
NOTE: No intercept in model. R-Square is redefined.
                             Analysis of Variance
                                    Sum of           Mean
Source                   DF        Squares         Square    F Value    Pr > F
Model                     3     0.00005463     0.00001821       0.00    1.0000
Error                    10       11.99751        1.19975
Uncorrected Total        13       11.99756
Root MSE              1.09533    R-Square     0.0000
Dependent Mean    5.12411E-17    Adj R-Sq    -0.3000
Coeff Var         2.137605E18
                        Parameter Estimates
                     Parameter       Standard
Variable     DF       Estimate          Error    t Value    Pr > |t|
c1            1       -0.00122        0.21144      -0.01      0.9955
c2            1    -0.00012426        0.25186      -0.00      0.9996
c3            1        0.00252        0.73202       0.00      0.9973
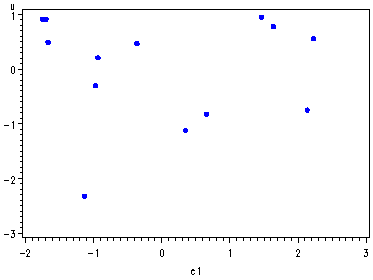
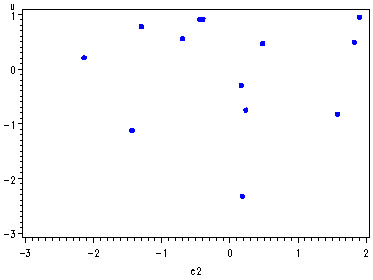
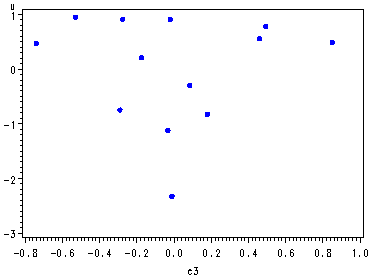
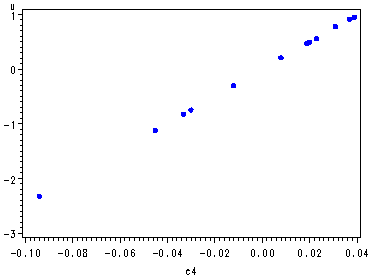
Fig. 10.1, p. 271.
symbol v=dot h=.8 c=blue;
proc gplot data = p270;
  plot u*C1 u*C2 u*C3 u*C4;
run;
quit;
Creating the data to be used in fig. 10.2, p. 273 and tables 10.7-10.8 on p.274 and p. 277.
proc reg data = p233 outest = temp outstb noprint;
  where year <= 59;
  model import = doprod stock consum/
         ridge = (0.00 0.001 to .009 by .002 0.010 to 0.03 by 0.002 0.03 to 0.09 by 0.01 0.1 to 1.0 by 0.1)
         outvif ;
run;
quit;
Fig. 10.2, p. 273.
Note: Usually this graph can be supplied by SAS by adding a plot statement with a ridgeplot option in the proc reg that is doing the ridge regression. However, for this particular dataset we were unable to get the proc reg to reproduce the graph whereas using a proc gplot we were able to reproduce the graph in the book.
symbol1 i=join v=circle h =.8 c=blue;
symbol2 i=join v=circle h =.8 c=red;
symbol3 i=join v=circle h =.8 c=green;
legend1 label=none position=(top center inside)
        mode=share;
axis1 label=(angle=90 'Ridge coefficients');
proc gplot data = temp;
  where _type_ = 'RIDGESTB';
  plot (doprod stock consum)*_ridge_/ overlay legend=legend1 vaxis=axis1 vref=0;
run;
quit;
Table 10.7, p. 274.
proc print data = temp;
 where _type_ = 'RIDGESTB';
 var _ridge_ doprod stock consum;
run;
Obs _RIDGE_ DOPROD STOCK CONSUM4 0.000 -0.33934 0.21305 1.30268 7 0.001 -0.11745 0.21503 1.08024 10 0.003 0.09215 0.21669 0.86963 13 0.005 0.19249 0.21728 0.76831 16 0.007 0.25122 0.21745 0.70862 19 0.009 0.28970 0.21743 0.66919 22 0.010 0.30433 0.21737 0.65408 25 0.012 0.32753 0.21720 0.62993 28 0.014 0.34505 0.21698 0.61146 31 0.016 0.35873 0.21671 0.59684 34 0.018 0.36967 0.21643 0.58496 37 0.020 0.37861 0.21612 0.57509 40 0.022 0.38602 0.21580 0.56674 43 0.024 0.39225 0.21547 0.55958 46 0.026 0.39755 0.21514 0.55335 49 0.028 0.40210 0.21479 0.54787 52 0.030 0.40604 0.21445 0.54300 55 0.030 0.40604 0.21445 0.54300 58 0.040 0.41955 0.21267 0.52488 61 0.050 0.42709 0.21087 0.51279 64 0.060 0.43152 0.20907 0.50384 67 0.070 0.43414 0.20729 0.49675 70 0.080 0.43560 0.20553 0.49086 73 0.090 0.43630 0.20380 0.48578 76 0.100 0.43645 0.20209 0.48128 79 0.200 0.42646 0.18639 0.44994 82 0.300 0.41123 0.17298 0.42738 85 0.400 0.39575 0.16140 0.40818 88 0.500 0.38091 0.15130 0.39107 91 0.600 0.36693 0.14242 0.37554 94 0.700 0.35381 0.13454 0.36131 97 0.800 0.34153 0.12750 0.34818 100 0.900 0.33003 0.12117 0.33601 103 1.000 0.31925 0.11546 0.32469
Table 10.8, p. 277.
proc print data = temp;
 where _type_ = 'RIDGEVIF';
 var _ridge_ doprod stock consum;
run;
Obs _RIDGE_ DOPROD STOCK CONSUM2 0.000 185.997 1.01891 186.110 5 0.001 98.981 1.00845 99.041 8 0.003 41.779 0.99890 41.804 11 0.005 22.988 0.99311 23.001 14 0.007 14.570 0.98836 14.579 17 0.009 10.089 0.98401 10.095 20 0.010 8.599 0.98192 8.604 23 0.012 6.480 0.97783 6.483 26 0.014 5.075 0.97384 5.078 29 0.016 4.097 0.96991 4.099 32 0.018 3.388 0.96603 3.389 35 0.020 2.858 0.96219 2.859 38 0.022 2.452 0.95838 2.452 41 0.024 2.133 0.95461 2.134 44 0.026 1.878 0.95086 1.879 47 0.028 1.672 0.94714 1.672 50 0.030 1.502 0.94345 1.502 53 0.030 1.502 0.94345 1.502 56 0.040 0.979 0.92532 0.979 59 0.050 0.723 0.90773 0.723 62 0.060 0.579 0.89065 0.578 65 0.070 0.489 0.87405 0.488 68 0.080 0.429 0.85792 0.428 71 0.090 0.386 0.84222 0.386 74 0.100 0.355 0.82696 0.355 77 0.200 0.240 0.69474 0.240 80 0.300 0.204 0.59187 0.204 83 0.400 0.182 0.51027 0.182 86 0.500 0.166 0.44446 0.165 89 0.600 0.152 0.39061 0.152 92 0.700 0.140 0.34598 0.140 95 0.800 0.130 0.30859 0.130 98 0.900 0.121 0.27695 0.121 101 1.000 0.113 0.24994 0.112
Table 10.9, p. 277.
Note: The intercept = 0 indicates that the row contains the standardized coefficients.
proc reg data = p233 outest = temp outstb noprint;
  where year <= 59;
  model import = doprod stock consum/  ridge =  (0.00, 0.04) ;
run;
quit;
proc print data = temp;
 where _ridge_ ~=.;
 by _ridge_;
 var _ridge_  intercept doprod stock consum;
run;
Ridge regression control value=0 Obs _RIDGE_ Intercept DOPROD STOCK CONSUM2 0 -10.1280 -0.05140 0.58695 0.28685 3 0 0.0000 -0.33934 0.21305 1.30268
Ridge regression control value=0.04 Obs _RIDGE_ Intercept DOPROD STOCK CONSUM
4 0.04 -8.55832 0.06354 0.58591 0.11558 5 0.04 0.00000 0.41955 0.21267 0.52488

