Inputting the Hamilton data, table 4.1, p. 9
data p095;
  input Y X1 X2;
cards;
12.37 2.23 9.66
12.66 2.57 8.94
12    3.87 4.4
11.93 3.1  6.64
11.06 3.39 4.91
13.03 2.83 8.52
13.13 3.02 8.04
11.44 2.14 9.05
12.86 3.04 7.71
10.84 3.26 5.11
11.2  3.39 5.05
11.56 2.35 8.51
10.83 2.76 6.59
12.63 3.9  4.9
12.46 3.16 6.96
;
run;
Correlations and scatter matrix, p. 94
Invoking a macro in order to create a scatter plot matrix.
proc corr data = p095;
  var y x1 x2;
run;
%scatter(data=p095, y x1 x2);
The CORR Procedure
   3  Variables:    Y        X1       X2
                                    Simple Statistics
Variable           N          Mean       Std Dev           Sum       Minimum       Maximum
Y                 15      12.00000       0.80217     180.00000      10.83000      13.13000
X1                15       3.00067       0.53470      45.01000       2.14000       3.90000
X2                15       6.99933       1.78145     104.99000       4.40000       9.66000
 Pearson Correlation Coefficients, N = 15
         Prob > |r| under H0: Rho=0
               Y            X1            X2
Y        1.00000       0.00250       0.43407
                        0.9930        0.1060
X1       0.00250       1.00000      -0.89978
          0.9930                      <.0001
X2       0.43407      -0.89978       1.00000
          0.1060        <.0001
Fitted Equations, p. 95.
proc reg data = p095;
 model y = x1;
 model y = x2;
 model y=x1 x2;
run;
quit;
The REG Procedure Model: MODEL1 Dependent Variable: YAnalysis of Variance
Sum of Mean Source DF Squares Square F Value Pr > F Model 1 0.00005621 0.00005621 0.00 0.9930 Error 13 9.00854 0.69296 Corrected Total 14 9.00860
Root MSE 0.83245 R-Square 0.0000 Dependent Mean 12.00000 Adj R-Sq -0.0769 Coeff Var 6.93704 Parameter Estimates
Parameter Standard Variable DF Estimate Error t Value Pr > |t| Intercept 1 11.98876 1.26689 9.46 <.0001 X1 1 0.00375 0.41608 0.01 0.9930
The REG Procedure Model: MODEL2 Dependent Variable: Y
Analysis of Variance
Sum of Mean Source DF Squares Square F Value Pr > F Model 1 1.69736 1.69736 3.02 0.1060 Error 13 7.31124 0.56240 Corrected Total 14 9.00860
Root MSE 0.74994 R-Square 0.1884 Dependent Mean 12.00000 Adj R-Sq 0.1260 Coeff Var 6.24946
Parameter Estimates
Parameter Standard Variable DF Estimate Error t Value Pr > |t| Intercept 1 10.63194 0.81094 13.11 <.0001 X2 1 0.19546 0.11251 1.74 0.1060
The REG Procedure Model: MODEL3 Dependent Variable: Y
Analysis of Variance
Sum of Mean Source DF Squares Square F Value Pr > F Model 2 9.00722 4.50361 39222.3 <.0001 Error 12 0.00138 0.00011482 Corrected Total 14 9.00860
Root MSE 0.01072 R-Square 0.9998 Dependent Mean 12.00000 Adj R-Sq 0.9998 Coeff Var 0.08930
Parameter Estimates
Parameter Standard Variable DF Estimate Error t Value Pr > |t| Intercept 1 -4.51541 0.06114 -73.85 <.0001 X1 1 3.09701 0.01227 252.31 <.0001 X2 1 1.03186 0.00368 280.08 <.0001
Inputting the New York Rivers data, p. 10.
data p010;
  length river $ 20 ;
  input river x1 x2 x3 x4 y;
  label x1 = 'Agriculture'
        x2 = 'Forest'
	x3 = 'Residential'
        x4 = 'Commercial/Industrial'
	y = 'Nitrogen';
cards;
Olean 26 63 1.2 0.29 1.1
Cassadaga 29 57 0.7 0.09 1.01
Oatka 54 26 1.8 0.58 1.9
Neversink 2 84 1.9 1.98 1
Hackensack 3 27 29.4 3.11 1.99
Wappinger 19 61 3.4 0.56 1.42
Fishkill 16 60 5.6 1.11 2.04
Honeoye  40 43 1.3 0.24 1.65
Susquehanna 28 62 1.1 0.15 1.01
Chenango 26 60 0.9 0.23 1.21
Tioughnioga 26 53 0.9 0.18 1.33
West_Canada 15 75 0.7 0.16 0.75
East_Canada 6 84 0.5 0.12 0.73
Saranac 3 81 0.8 0.35 0.8
Ausable 2 89 0.7 0.35 0.76
Black 6 82 0.5 0.15 0.87
Schoharie 22 70 0.9 0.22 0.8
Raquette 4 75 0.4 0.18 0.87
Oswegatchie 21 56 0.5 0.13 0.66
Cohocton 40 49 1.1 0.13 1.25
;
run;
Table 4.2, p. 99
proc reg data = p010;
  model y = x1-x4;
run;
quit;
The REG Procedure Model: MODEL1 Dependent Variable: y NitrogenAnalysis of Variance
Sum of Mean Source DF Squares Square F Value Pr > F Model 4 2.56985 0.64246 9.15 0.0006 Error 15 1.05273 0.07018 Corrected Total 19 3.62257
Root MSE 0.26492 R-Square 0.7094 Dependent Mean 1.15750 Adj R-Sq 0.6319 Coeff Var 22.88715 Parameter Estimates
Parameter Standard Variable Label DF Estimate Error t Value Pr > |t| Intercept Intercept 1 1.72221 1.23408 1.40 0.1832 x1 Agriculture 1 0.00581 0.01503 0.39 0.7046 x2 Forest 1 -0.01297 0.01393 -0.93 0.3667 x3 Residential 1 -0.00723 0.03383 -0.21 0.8337 x4 Commercial/Industrial 1 0.30503 0.16382 1.86 0.0823
Excluding the observation where River = Neversink.
proc reg data = p010;
  model y = x1-x4;
  where river ~= 'Neversink';
run;
quit;
The REG Procedure Model: MODEL1 Dependent Variable: y NitrogenAnalysis of Variance
Sum of Mean Source DF Squares Square F Value Pr > F Model 4 3.07765 0.76941 20.76 <.0001 Error 14 0.51881 0.03706 Corrected Total 18 3.59646
Root MSE 0.19250 R-Square 0.8557 Dependent Mean 1.16579 Adj R-Sq 0.8145 Coeff Var 16.51280 Parameter Estimates
Parameter Standard Variable Label DF Estimate Error t Value Pr > |t| Intercept Intercept 1 1.09947 0.91164 1.21 0.2478 x1 Agriculture 1 0.01014 0.01098 0.92 0.3717 x2 Forest 1 -0.00759 0.01022 -0.74 0.4701 x3 Residential 1 -0.12379 0.03934 -3.15 0.0071 x4 Commercial/Industrial 1 1.52896 0.34372 4.45 0.0006
Excluding the observation where River = Hackensack.
proc reg data = p010;
  model y = x1-x4;
  where river ~= 'Hackensack';
run;
quit;
The REG Procedure Model: MODEL1 Dependent Variable: y NitrogenAnalysis of Variance
Sum of Mean Source DF Squares Square F Value Pr > F Model 4 2.49968 0.62492 22.24 <.0001 Error 14 0.39336 0.02810 Corrected Total 18 2.89304
Root MSE 0.16762 R-Square 0.8640 Dependent Mean 1.11368 Adj R-Sq 0.8252 Coeff Var 15.05109
Parameter Estimates
Parameter Standard Variable Label DF Estimate Error t Value Pr > |t| Intercept Intercept 1 1.62601 0.78109 2.08 0.0562 x1 Agriculture 1 0.00235 0.00954 0.25 0.8088 x2 Forest 1 -0.01276 0.00881 -1.45 0.1698 x3 Residential 1 0.18116 0.04439 4.08 0.0011 x4 Commercial/Industrial 1 0.07562 0.11396 0.66 0.5177
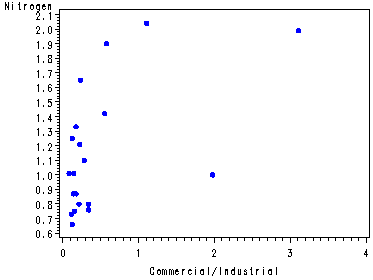
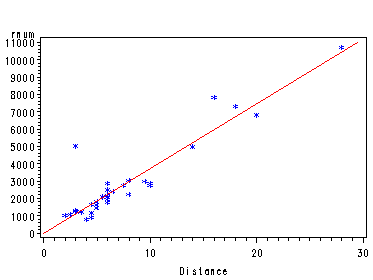
Fig. 4.5, p. 102.
symbol v=dot h=.8 c=blue;
proc gplot data = p010;
  plot y*x4;
run;
quit;
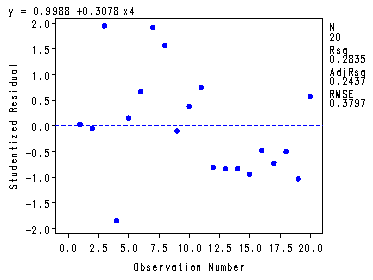
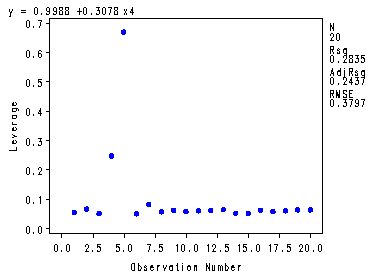
Fig. 4.6, p. 102-103.
proc reg data = p010 noprint;
  model y=x4;
  plot student.*obs. h.*obs.;
  output out=resid student=stdresid H=leverage;
run;
quit;
Table 4.3, p. 103. The standardized residuals and the leverage values.
proc print data = resid;
 var stdresid leverage;
run;
Obs stdresid leverage1 0.03228 0.05469 2 -0.04502 0.06670 3 1.95292 0.05038 4 -1.84723 0.24787 5 0.15529 0.67101 6 0.67231 0.05018 7 1.92326 0.08261 8 1.56562 0.05700 9 -0.09515 0.06232 10 0.38082 0.05752 11 0.74924 0.06038 12 -0.81033 0.06166 13 -0.83246 0.06443 14 -0.82939 0.05253 15 -0.93761 0.05253 16 -0.47590 0.06232 17 -0.72323 0.05806 18 -0.50049 0.06038 19 -1.03103 0.06371 20 0.57473 0.06371
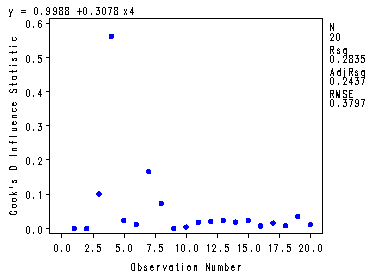
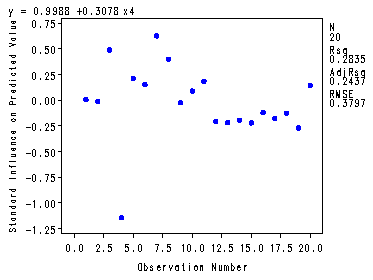
Fig. 4.7(a) and 4.7(b), p. 107.
Plotting the Cook’s Distance and the DFFits.
symbol v=dot h=.8 c=blue;
proc reg data = p010 noprint;
  model y = x4;
  plot cookd.*obs. dffits.*obs.;
  output out=resid r=r H=h cookd=CookD dffits=dffits ;
run;
quit;
Creating the values for the Hadi influence measure.
ods listing close;
proc reg data = p010;
  model y = x4;
  ods output anova=temp;
run;
quit;
ods listing;
data temp;
  set temp;
  if source = 'Error' then call symput ('sse', ss);
  if source = 'Model' then call symput ('p', df );
run;
%put &sse &p ; /* To make the numbers sse and p appear in the log file. */
data resid2;
   set resid;
   id = _N_;
   newid + 1;
   d = .;
   d = r/sqrt(&sse);
   hadi = h/(1-h) + (&p + 1)*d**2/((1-h)*(1-d**2));
   keep hadi d id  dffits cookd h;
run;
Table 4.4, p. 106.
proc print data = resid2;
  var CookD dffits hadi;
run;
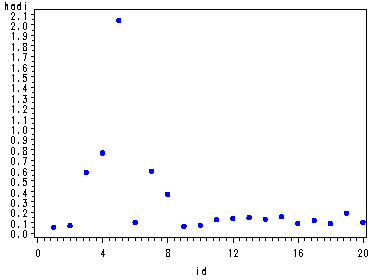
Obs CookD dffits hadi1 0.00003 0.00755 0.05797 2 0.00007 -0.01170 0.07170 3 0.10118 0.49244 0.58357 4 0.56225 -1.14475 0.77174 5 0.02459 0.21567 2.04228 6 0.01194 0.15210 0.10428 7 0.16653 0.62923 0.59652 8 0.07408 0.40249 0.37293 9 0.00030 -0.02385 0.06747 10 0.00443 0.09180 0.07727 11 0.01804 0.18753 0.12852 12 0.02157 -0.20566 0.14126 13 0.02386 -0.21651 0.14874 14 0.01907 -0.19351 0.13474 15 0.02437 -0.21998 0.15786 16 0.00753 -0.11999 0.09193 17 0.01612 -0.17708 0.12139 18 0.00805 -0.12417 0.09247 19 0.03617 -0.26945 0.19307 20 0.01124 0.14705 0.10539
Fig. 4.7(c), p. 107. Plotting the Hadi influence measure.
symbol v=dot h=.8 c=blue;
axis2 order=(0 to 20 by 4);

proc gplot data = resid2;
  plot hadi*id / haxis=axis2;
run;
quit;
>
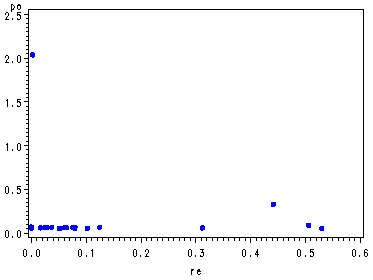
Creating the potential and residuals.
data resid3;
  set resid2;
  po = h/(1-h);
  re = (1+1)*d**2/( (1-h)*(1-d**2) );
run;
Fig 4.8, p. 108. The Potential-Residual Plot.
symbol v=dot h=.8 c=blue;
axis2 order=(0 to 2.5 by .5);

proc gplot data = resid3;
  plot po*re/ vaxis=axis2;
run;
quit;
Inputting the Scottish Hills Race data, table 4.5, p. 112
data p112;
  length Race $ 30;
  input Race Time  Distance  Climb;
cards;
Greenmantle_New_Year_Dash  	965  	2.5  	650
Carnethy  		 	2901  	6  	2500
Craig_Dunain  			2019  	6  	900
Ben_Rha  		 	2736  	7.5  	800
Ben_Lomond  			3736  	8  	3070
Goatfell  			4393  	8  	2866
Bens_of_Jura  		  	12277  	16  	7500
Cairnpapple  			2182  	6  	800
Scolty  			1785  	5  	800
Traprain_Law  			2385  	6  	650
Lairig_Ghru  			11560  	28  	2100
Dollar  			2583  	5  	2000
Lomonds_of_Fife  		3900  	9.5  	2200
Cairn_Table  			2648  	6  	500
Eildon_Two  			1616  	4.5  	1500
Cairngorm  			4335  	10  	3000
Seven_Hills_of_Edinburgh  	5905  	14  	2200
Knock_Hill  			4719  	3  	350
Black_Hill  			1045  	4.5  	1000
Creag_Beag  			1954  	5.5  	600
Kildoon  			957  	3  	300
Meall_Ant_Suiche  		1674  	3.5	1500
Half_Ben_Nevis  		2859  	6  	2200
Cow_Hill  			1076  	2  	900
North_Berwick_Law  		1121  	3  	600
Creag_Dubh  			1573  	4  	2000
Burnswark  			2066  	6  	800
Largo  	        		1714  	5  	950
Criffel  			3030  	6.5  	1750
Achmony  			1257  	5  	500
Ben_Nevis  			5135  	10  	4400
Knockfarrel  			1943  	6  	600
Two_Breweries_Fell  		10215  	18  	5200
Cockleroi  			1686  	4.5  	850
Moffat_Chase  			9590  	20  	5000
;
run;
Fig. 4.11(a) and 4.11(b), p. 114. The added-variable plots and generating the output necessary for the residual plus component plots.
proc reg data = p112;
  model time = distance climb/partial;
  output out=resid H=h r=r ;
  ods output anova=temp;
run;
quit;
The REG Procedure Model: MODEL1 Dependent Variable: TimeAnalysis of Variance
Sum of Mean Source DF Squares Square F Value Pr > F
Model 2 202712289 101356144 147.51 <.0001 Error 27 18552505 687130 Corrected Total 29 221264794
Root MSE 828.93294 R-Square 0.9162 Dependent Mean 3341.26667 Adj R-Sq 0.9099 Coeff Var 24.80894
Parameter Estimates
Parameter Standard Variable DF Estimate Error t Value Pr > |t|
Intercept 1 -304.14317 263.96279 -1.15 0.2593 Distance 1 395.48217 35.81177 11.04 <.0001 Climb 1 0.40133 0.14962 2.68 0.0123
The REG Procedure Model: MODEL1 Partial Regression Residual Plot
–+—-+—-+—-+—-+—-+—-+—-+—-+—-+—-+—-+—-+—-+—-+—-+—-+—-+– Time | | | | | | | | 4000 + + | | | | | | | 1 | | | | | 3000 + + | | | | | | | | | | | | 2000 + + | | | | | 1 | | | | | | | 1000 + + | | | | | | | | | 1 1 | | 1 1 | 0 + 1 1 1 + | 1 1 1 1 1 | | 11 1 1 | | 1 1 2 1 | | 1 11 1 | | 1 | | 1 | -1000 + 1 + | | | | | | –+—-+—-+—-+—-+—-+—-+—-+—-+—-+—-+—-+—-+—-+—-+—-+—-+—-+– -0.9 -0.8 -0.7 -0.6 -0.5 -0.4 -0.3 -0.2 -0.1 0.0 0.1 0.2 0.3 0.4 0.5 0.6 0.7 0.8
Intercept The REG Procedure Model: MODEL1 Partial Regression Residual Plot
—–+—–+—–+—–+—–+—–+—–+—–+—–+—–+—–+—–+—–+—–+—— 8000 + + | 1 | | | | | | | | | | | 6000 + + | | | | | | | | | | | | 4000 + + | | | 1 | Time | | | | | | | | 2000 + + | 1 1 | | 1 | | 1 | | | | 1 | | 11 | 0 + 2 + | 1 2 1 3 | | 1 | | 11 1 | | 21 | | 1 1 | | 1 | -2000 + + | 1 1 | | | | | | | | | | | -4000 + + —–+—–+—–+—–+—–+—–+—–+—–+—–+—–+—–+—–+—–+—–+—— -6 -4 -2 0 2 4 6 8 10 12 14 16 18 20
Distance The REG Procedure Model: MODEL1 Partial Regression Residual Plot
——+——+——+——+——+——+——+——+——+——+——+——+—— 4000 + + | | | | | | | 1 | | | | | 3000 + + | | | | | | | | | | | | 2000 + 1 + | | | | Time | | | | | | | | 1000 + + | 1 | | 1 | | 1 | | 1 | | 1 | | 1 1 1 | 0 + 1 + | 1 1 11 | | 1 1 1 11 | | 1 1 2 | | 11 | | 1 | | 1 | -1000 + 1 + | 1 | | | | | | | | | | | -2000 + + ——+——+——+——+——+——+——+——+——+——+——+——+—— -3000 -2500 -2000 -1500 -1000 -500 0 500 1000 1500 2000 2500
Climb
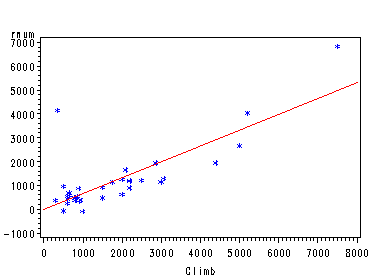
Fig. 4.12, the partial residual plot for each predictor.
Note: Invoking the par_resid_plot macro which will generate only one plot at a time.
%par_resid_plot(p112, time, climb distance, distance)
%par_resid_plot(p112, time, climb distance, climb)
Generating the variables to be used in the Potential-Residual plot.
data temp;
  set temp;
  if source = 'Error' then call symput ('sse', ss);
run;
data resid2;
  set resid;
  d = .;
  d = r/sqrt(&sse);
  po = h/(1-h);
  re = 3*d**2/( (1-h)*(1-d**2) );
run;
It is 3 times d squared since d squared is multiplied by the number of predictors in the model + 1, i.e., p + 1 (which in this case is 2+1 = 3). The Potential-Residual Plot, fig. 4.13, p. 114.
symbol v=dot h=.8 c=blue;
proc gplot data = resid2;
  plot po*re ;
run;
quit;

