Inputting Salary Survey data, table 5.1, p. 124.
data p124;
  input S X E M;
cards;
13876 1 1 1
11608 1 3 0
18701 1 3 1
11283 1 2 0
11767 1 3 0
20872 2 2 1
11772 2 2 0
10535 2 1 0
12195 2 3 0
12313 3 2 0
14975 3 1 1
21371 3 2 1
19800 3 3 1
11417 4 1 0
20263 4 3 1
13231 4 3 0
12884 4 2 0
13245 5 2 0
13677 5 3 0
15965 5 1 1
12336 6 1 0
21352 6 3 1
13839 6 2 0
22884 6 2 1
16978 7 1 1
14803 8 2 0
17404 8 1 1
22184 8 3 1
13548 8 1 0
14467 10 1 0
15942 10 2 0
23174 10 3 1
23780 10 2 1
25410 11 2 1
14861 11 1 0
16882 12 2 0
24170 12 3 1
15990 13 1 0
26330 13 2 1
17949 14 2 0
25685 15 3 1
27837 16 2 1
18838 16 2 0
17483 16 1 0
19207 17 2 0
19346 20 1 0
;
run;
Creating the dummy coding for the variable e.
data p124;
  set p124;
  e1 = .;
  if e = 1 then e1 = 1;
  else e1 = 0;
  e2 = .;
  if e = 2 then e2 = 1;
  else e2 = 0;
run;
proc freq data = p124;
  tables e e1 e2;
run;
The FREQ Procedure
                              Cumulative    Cumulative
E    Frequency     Percent     Frequency      Percent
—————————————————–
1          14       30.43            14        30.43
2          19       41.30            33        71.74
3          13       28.26            46       100.00
                               Cumulative    Cumulative
e1    Frequency     Percent     Frequency      Percent
——————————————————-
 0          32       69.57            32        69.57
 1          14       30.43            46       100.00
                               Cumulative    Cumulative
e2    Frequency     Percent     Frequency      Percent
——————————————————-
 0          27       58.70            27        58.70
 1          19       41.30            46       100.00
Creating the category variables used in table 5.2, p. 126.
data p124;
  set p124;
  category = .;
  if e = 1 and m = 0 then category = 1;
  if e = 1 and m = 1 then category = 2;
  if e = 2 and m = 0 then category = 3;
  if e = 2 and m = 1 then category = 4;
  if e = 3 and m = 0 then category = 5;
  if e = 3 and m = 1 then category = 6;
run;
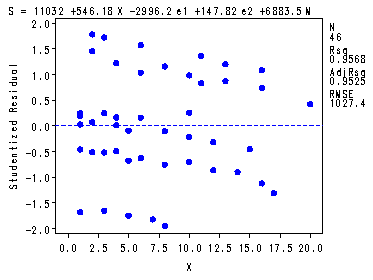
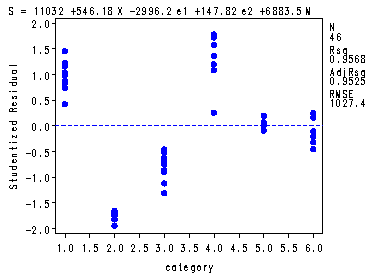
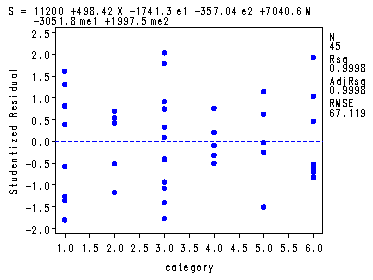
Table 5.3, p. 126, fig. 5.1, p. 127 and fig. 5.2, p. 128.
proc reg data = p124;
  var category;
  model s = x e1 e2 m;
  plot student.*x student.*category;
run;
quit;
The REG Procedure Model: MODEL1 Dependent Variable: SAnalysis of Variance
Sum of Mean Source DF Squares Square F Value Pr > F Model 4 957816858 239454214 226.84 <.0001 Error 41 43280719 1055627 Corrected Total 45 1001097577
Root MSE 1027.43725 R-Square 0.9568 Dependent Mean 17270 Adj R-Sq 0.9525 Coeff Var 5.94919
Parameter Estimates
Parameter Standard Variable DF Estimate Error t Value Pr > |t| Intercept 1 11032 383.21713 28.79 <.0001 X 1 546.18402 30.51919 17.90 <.0001 e1 1 -2996.21026 411.75271 -7.28 <.0001 e2 1 147.82495 387.65932 0.38 0.7049 M 1 6883.53101 313.91898 21.93 <.0001
Creating the interaction variables, p. 128.
data p124;
  set p124;
  me1= m*e1;
  me2 = m*e2;
run;
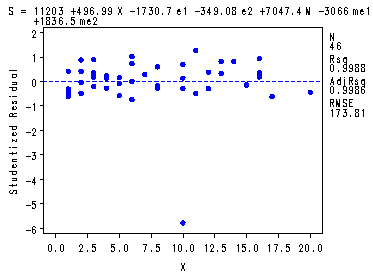
Table 5.4 and fig. 5.3, p. 129.
symbol v=dot h=.8 c=blue;
proc reg data = p124;
  model s = x e1 e2 m me1 me2;
  plot student.*x;
run;
quit;
The REG Procedure Model: MODEL1 Dependent Variable: SAnalysis of Variance
Sum of Mean Source DF Squares Square F Value Pr > F Model 6 999919409 166653235 5516.60 <.0001 Error 39 1178168 30209 Corrected Total 45 1001097577
Root MSE 173.80861 R-Square 0.9988 Dependent Mean 17270 Adj R-Sq 0.9986 Coeff Var 1.00641
Parameter Estimates
Parameter Standard Variable DF Estimate Error t Value Pr > |t| Intercept 1 11203 79.06545 141.70 <.0001 X 1 496.98701 5.56642 89.28 <.0001 e1 1 -1730.74832 105.33389 -16.43 <.0001 e2 1 -349.07769 97.56790 -3.58 0.0009 M 1 7047.41202 102.58919 68.70 <.0001 me1 1 -3066.03512 149.33044 -20.53 <.0001 me2 1 1836.48795 131.16736 14.00 <.0001
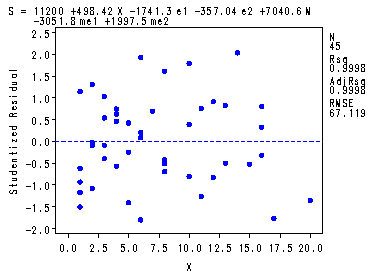
Deleting observation 33, repeating the regression with interactions, table 5.5 and fig. 5.4-5.5, p. 129-130.
data missing33;
  set p124;
  id = _N_; /* creates the id variable */
  if id = 33 then delete;
run;
symbol1 c=blue v=dot;
proc reg data = missing33;
  var category;
  model s = x e1 e2 m me1 me2;
  plot student.*x student.*category;
run;
quit;
The REG Procedure Model: MODEL1 Dependent Variable: SAnalysis of Variance
Sum of Mean Source DF Squares Square F Value Pr > F Model 6 957607113 159601186 35428.0 <.0001 Error 38 171188 4504.95052 Corrected Total 44 957778301
Root MSE 67.11893 R-Square 0.9998 Dependent Mean 17126 Adj R-Sq 0.9998 Coeff Var 0.39192
Parameter Estimates
Parameter Standard Variable DF Estimate Error t Value Pr > |t| Intercept 1 11200 30.53338 366.80 <.0001 X 1 498.41777 2.15169 231.64 <.0001 e1 1 -1741.33595 40.68250 -42.80 <.0001 e2 1 -357.04226 37.68114 -9.48 <.0001 M 1 7040.58014 39.61907 177.71 <.0001 me1 1 -3051.76329 57.67420 -52.91 <.0001 me2 1 1997.53060 51.78498 38.57 <.0001
Table 5.6, Estimates of the Base Salary, p. 131.
proc glm data = missing33;
  class e m ;
  model s = x e e*m;
  lsmean e*m/ at  x=0 stderr cl;
run;
quit;
The GLM ProcedureClass Level Information
Class Levels Values E 3 1 2 3 M 2 0 1
Number of observations 45
The GLM Procedure Dependent Variable: S
Sum of Source DF Squares Mean Square F Value Pr > F Model 6 957607113.1 159601185.5 35428.0 <.0001 Error 38 171188.1 4505.0 Corrected Total 44 957778301.2 R-Square Coeff Var Root MSE S Mean 0.999821 0.391923 67.11893 17125.53 Source DF Type I SS Mean Square F Value Pr > F X 1 276059254.3 276059254.3 61279.1 <.0001 E 2 153242718.2 76621359.1 17008.3 <.0001 E*M 3 528305140.6 176101713.5 39090.7 <.0001 Source DF Type III SS Mean Square F Value Pr > F X 1 241723277.6 241723277.6 53657.3 <.0001 E 2 119359886.9 59679943.4 13247.6 <.0001 E*M 3 528305140.6 176101713.5 39090.7 <.0001
The GLM Procedure Least Squares Means at X=0
Standard E M S LSMEAN Error Pr > |t| 1 0 9458.3778 31.0407 <.0001 1 1 13447.1947 31.7437 <.0001 2 0 10842.6715 26.1571 <.0001 2 1 19880.7823 32.9443 <.0001 3 0 11199.7138 30.5334 <.0001 3 1 18240.2939 28.5471 <.0001
E M S LSMEAN 95% Confidence Limits 1 0 9458.377848 9395.539200 9521.216497 1 1 13447 13383 13511 2 0 10843 10790 10896 2 1 19881 19814 19947 3 0 11200 11138 11262 3 1 18240 18183 18298
Table 5.7, the Pre-employment Testing Program data, p. 134.
data p134;
  input TEST RACE JPERF;
cards;
0.28 1 1.83
0.97 1 4.59
1.25 1 2.97
2.46 1 8.14
2.51 1 8.00
1.17 1 3.30
1.78 1 7.53
1.21 1 2.03
1.63 1 5.00
1.98 1 8.04
2.36 0 3.25
2.11 0 5.30
0.45 0 1.39
1.76 0 4.69
2.09 0 6.56
1.50 0 3.00
1.25 0 5.85
0.72 0 1.90
0.42 0 3.85
1.53 0 2.95
;
run;
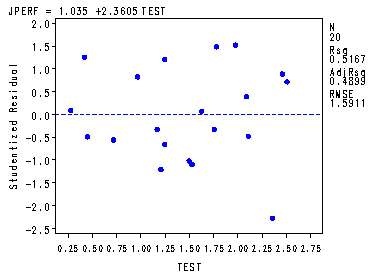
Table 5.8 and fig. 5.7, p. 135.
symbol v=dot h=.8 c=blue;
proc reg data = p134;
  model jperf = test;
  plot student.*test;
run;
quit;
The REG Procedure Model: MODEL1 Dependent Variable: JPERFAnalysis of Variance
Sum of Mean Source DF Squares Square F Value Pr > F Model 1 48.72296 48.72296 19.25 0.0004 Error 18 45.56830 2.53157 Corrected Total 19 94.29125
Root MSE 1.59109 R-Square 0.5167 Dependent Mean 4.50850 Adj R-Sq 0.4899 Coeff Var 35.29093
Parameter Estimates
Parameter Standard Variable DF Estimate Error t Value Pr > |t| Intercept 1 1.03497 0.86803 1.19 0.2486 TEST 1 2.36053 0.53807 4.39 0.0004
data temp; set p134; racetest = race*test; run;
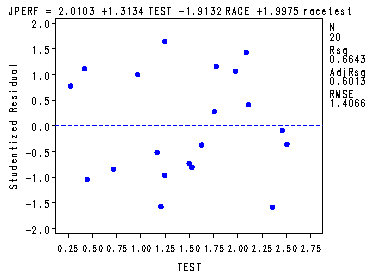
Table 5.9 and fig. 5.8, p. 135.
symbol v=dot h=.8 c=blue; proc reg data = temp; model jperf = test race racetest; plot student.*test; run; quit;
The REG Procedure Model: MODEL1 Dependent Variable: JPERFAnalysis of Variance
Sum of Mean Source DF Squares Square F Value Pr > F Model 3 62.63578 20.87859 10.55 0.0005 Error 16 31.65547 1.97847 Corrected Total 19 94.29125
Root MSE 1.40658 R-Square 0.6643 Dependent Mean 4.50850 Adj R-Sq 0.6013 Coeff Var 31.19840 Parameter Estimates
Parameter Standard Variable DF Estimate Error t Value Pr > |t| Intercept 1 2.01028 1.05011 1.91 0.0736 TEST 1 1.31340 0.67037 1.96 0.0677 RACE 1 -1.91317 1.54032 -1.24 0.2321 racetest 1 1.99755 0.95444 2.09 0.0527
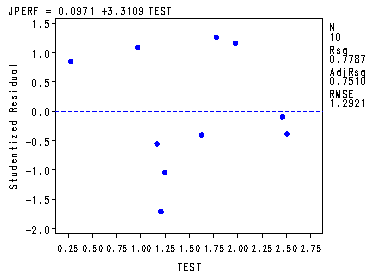
Table 5.10 and fig. 5.10-5.11, p. 136-137.
proc sort data = p134; by race; run; proc reg data = p134; by race; model jperf = test; plot student.*test; run; quit;RACE=0 The REG Procedure Model: MODEL1 Dependent Variable: JPERFAnalysis of Variance
Sum of Mean Source DF Squares Square F Value Pr > F Model 1 7.59441 7.59441 3.32 0.1059 Error 8 18.29863 2.28733 Corrected Total 9 25.89304
Root MSE 1.51239 R-Square 0.2933 Dependent Mean 3.87400 Adj R-Sq 0.2050 Coeff Var 39.03954 Parameter Estimates
Parameter Standard Variable DF Estimate Error t Value Pr > |t| Intercept 1 2.01028 1.12911 1.78 0.1129 TEST 1 1.31340 0.72080 1.82 0.1059 RACE=1
The REG Procedure Model: MODEL1 Dependent Variable: JPERF
Analysis of Variance
Sum of Mean Source DF Squares Square F Value Pr > F Model 1 46.98957 46.98957 28.14 0.0007 Error 8 13.35684 1.66960 Corrected Total 9 60.34641
Root MSE 1.29213 R-Square 0.7787 Dependent Mean 5.14300 Adj R-Sq 0.7510 Coeff Var 25.12409 Parameter Estimates
Parameter Standard Variable DF Estimate Error t Value Pr > |t| Intercept 1 0.09712 1.03519 0.09 0.9276 TEST 1 3.31095 0.62411 5.31 0.0007
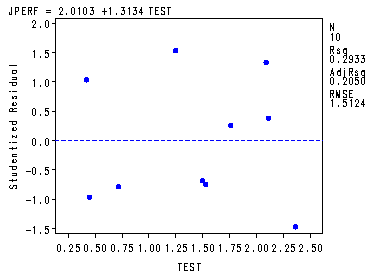
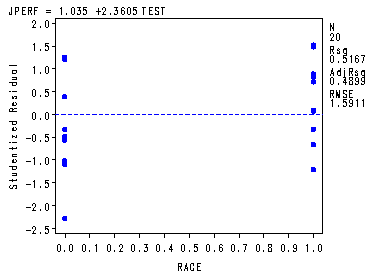
Fig. 5.9, p. 136.
proc reg data = p134 noprint; var race; model jperf = test; plot student.*race; run; quit;

