Table 6.2, p.15
data p157;
  input t N_t;
cards;
1 355
2 211
3 197
4 166
5 142
6 106
7 104
8 60
9 56
10 38
11 36
12 32
13 21
14 19
15 15
;
run;
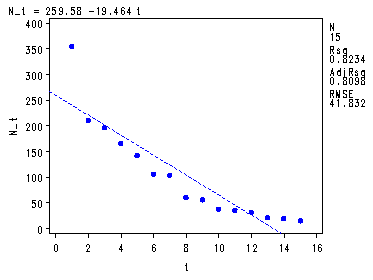
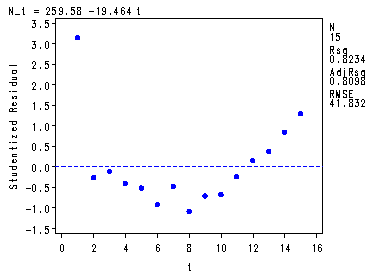
Table 6.3, fig. 6.5-6.6, p. 159.
symbol v=dot h=.8 c=blue;
proc reg data = p157;
  model N_t = t;
  plot N_t*t student.*t;
run;
quit;
The REG Procedure Model: MODEL1 Dependent Variable: N_tAnalysis of Variance
Sum of Mean Source DF Squares Square F Value Pr > F Model 1 106080 106080 60.62 <.0001 Error 13 22749 1749.95201 Corrected Total 14 128830
Root MSE 41.83243 R-Square 0.8234 Dependent Mean 103.86667 Adj R-Sq 0.8098 Coeff Var 40.27512 Parameter Estimates
Parameter Standard Variable DF Estimate Error t Value Pr > |t| Intercept 1 259.58095 22.72999 11.42 <.0001 t 1 -19.46429 2.49997 -7.79 <.0001
Creating the log(N_t) variable.
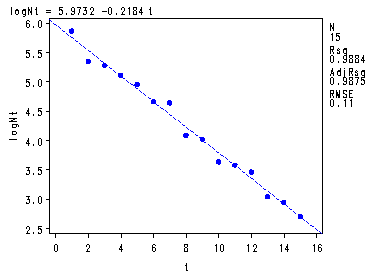
data p157; set p157; logNt = log(N_t); run;Table 6.4 and fig. 6.7-6.8, p.160-16
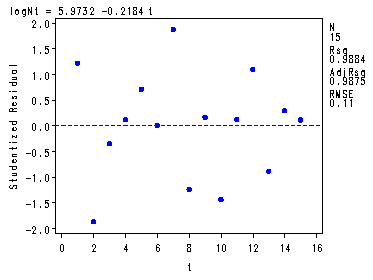
symbol v=dot h=.8 c=blue; proc reg data = p157; model logNt = t; plot logNt*t student.*t; run; quit;The REG Procedure Model: MODEL1 Dependent Variable: logNtAnalysis of Variance
Sum of Mean Source DF Squares Square F Value Pr > F Model 1 13.35869 13.35869 1103.70 <.0001 Error 13 0.15735 0.01210 Corrected Total 14 13.51603
Root MSE 0.11002 R-Square 0.9884 Dependent Mean 4.22576 Adj R-Sq 0.9875 Coeff Var 2.60346 Parameter Estimates
Parameter Standard Variable DF Estimate Error t Value Pr > |t| Intercept 1 5.97316 0.05978 99.92 <.0001 t 1 -0.21843 0.00657 -33.22 <.0001
The Injury data, table 6.6, p. 164.
data p163; input y n; cards; 11 .095 7 .192 7 .075 19 .2078 9 .1382 4 .054 3 .1292 1 .0503 3 .0629 ; run;Fig. 6.10, p. 164. Plotting Y versus N.
symbol v=dot h=.8 c=blue; proc gplot data = p163; plot y*n; run; quit;
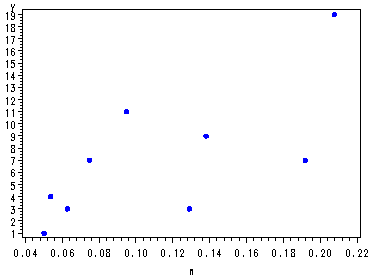
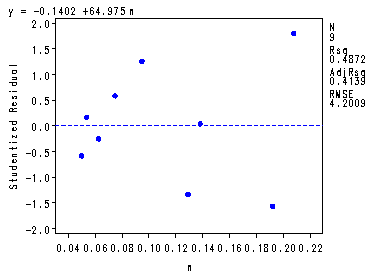
Table 6.7 and fig. 6.11, p. 165. Plotting standardize residual versus N.
proc reg data = p163; model y = n; plot student.*n; run; quit;The REG Procedure Model: MODEL1 Dependent Variable: yAnalysis of Variance
Sum of Mean Source DF Squares Square F Value Pr > F Model 1 117.35871 117.35871 6.65 0.0365 Error 7 123.53018 17.64717 Corrected Total 8 240.88889
Root MSE 4.20085 R-Square 0.4872 Dependent Mean 7.11111 Adj R-Sq 0.4139 Coeff Var 59.07450 Parameter Estimates
Parameter Standard Variable DF Estimate Error t Value Pr > |t| Intercept 1 -0.14015 3.14123 -0.04 0.9657 n 1 64.97548 25.19587 2.58 0.0365
Creating the square-root of Y.
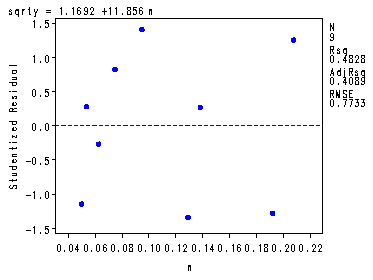
data p163; set p163; sqrty = sqrt(y); run;Table 6.8, p.165 and Fig. 6.12, p. 166.
symbol v=dot h=.8 c=blue; proc reg data = p163; model sqrty = n; plot student.*n; run; quit;The REG Procedure Model: MODEL1 Dependent Variable: sqrtyAnalysis of Variance
Sum of Mean Source DF Squares Square F Value Pr > F Model 1 3.90773 3.90773 6.53 0.0378 Error 7 4.18610 0.59801 Corrected Total 8 8.09383
Root MSE 0.77331 R-Square 0.4828 Dependent Mean 2.49235 Adj R-Sq 0.4089 Coeff Var 31.02754 Parameter Estimates
Parameter Standard Variable DF Estimate Error t Value Pr > |t| Intercept 1 1.16917 0.57825 2.02 0.0829 n 1 11.85643 4.63818 2.56 0.0378
The Industrial data, table 6.9, p. 167.
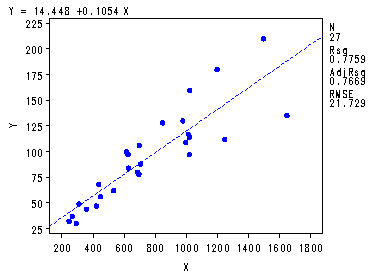
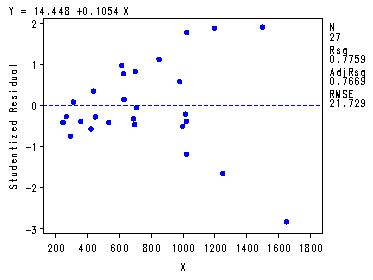
data p167; input X Y; cards; 294 30 247 32 267 37 358 44 423 47 311 49 450 56 534 62 438 68 697 78 688 80 630 84 709 88 627 97 615 100 999 109 1022 114 1015 117 700 106 850 128 980 130 1025 160 1021 97 1200 180 1250 112 1500 210 1650 135 ; run;Table 6.10 and fig. 6.13-6.14, p. 167-168.
symbol v=dot h=.8 c=blue; proc reg data = p167; model y = x; plot y*x student.*x; run; quit;The REG Procedure Model: MODEL1 Dependent Variable: YAnalysis of Variance
Sum of Mean Source DF Squares Square F Value Pr > F Model 1 40863 40863 86.54 <.0001 Error 25 11804 472.16256 Corrected Total 26 52667
Root MSE 21.72930 R-Square 0.7759 Dependent Mean 94.44444 Adj R-Sq 0.7669 Coeff Var 23.00750 Parameter Estimates
Parameter Standard Variable DF Estimate Error t Value Pr > |t| Intercept 1 14.44806 9.56201 1.51 0.1433 X 1 0.10536 0.01133 9.30 <.0001
Transforming the data by dividing by X, p. 168.
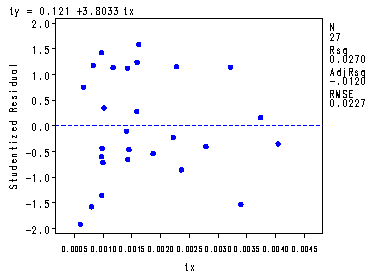
data p167; set p167; ty = y/x; tx = 1/x; run;Table 6.11 and fig. 6.15, p. 169.
proc reg data = p167; model ty = tx; plot student.*tx; run; quit;The REG Procedure Model: MODEL1 Dependent Variable: tyAnalysis of Variance
Sum of Mean Source DF Squares Square F Value Pr > F Model 1 0.00035583 0.00035583 0.69 0.4131 Error 25 0.01284 0.00051369 Corrected Total 26 0.01320
Root MSE 0.02266 R-Square 0.0270 Dependent Mean 0.12754 Adj R-Sq -0.0120 Coeff Var 17.77059 Parameter Estimates
Parameter Standard Variable DF Estimate Error t Value Pr > |t| Intercept 1 0.12099 0.00900 13.45 <.0001 tx 1 3.80330 4.56975 0.83 0.4131
Logarithmic transformation of the data, p. 171.
data p167; set p167; logy = log(y); x2 = x**2; run;Fig. 6.12, p. 171.
symbol v=dot h=.8 c=blue ; axis1 order=(3 to 5.5 by .5); proc gplot data = p167; plot logy*x / vaxis=axis1; run; quit;
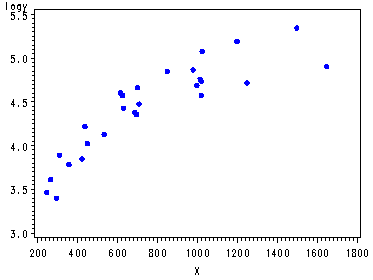
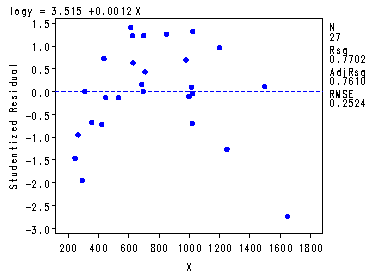
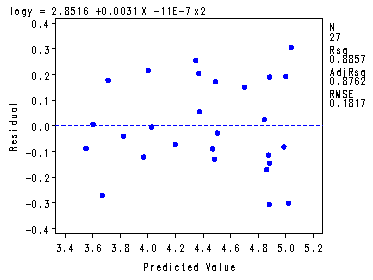
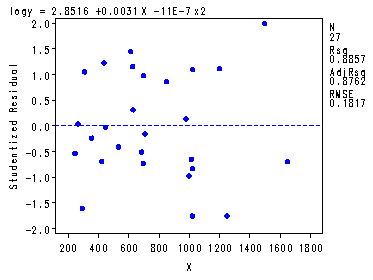
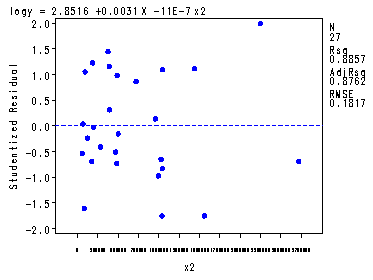
The first model and plot statements corresponds to table 6.12 and fig. 6.17, p. 171. The second model and plot statements corresponds to table 6.13 and fig. 6.18-6.20, p. 172-173. Proc reg is very flexible and this illustrates how you can do multiple models with diagnostic plots all at once.
symbol v=dot h=.8 c=blue; proc reg data = p167; model logy = x; plot student.*x; model logy = x x2; plot r.*p. student.*x student.*x2; run; quit;The REG Procedure Model: MODEL1 Dependent Variable: logyAnalysis of Variance
Sum of Mean Source DF Squares Square F Value Pr > F Model 1 5.33672 5.33672 83.77 <.0001 Error 25 1.59259 0.06370 Corrected Total 26 6.92931
Root MSE 0.25240 R-Square 0.7702 Dependent Mean 4.42923 Adj R-Sq 0.7610 Coeff Var 5.69841 Parameter Estimates
Parameter Standard Variable DF Estimate Error t Value Pr > |t| Intercept 1 3.51502 0.11107 31.65 <.0001 X 1 0.00120 0.00013155 9.15 <.0001
 The REG Procedure Model: MODEL1 Dependent Variable: logy
Analysis of Variance
Sum of Mean Source DF Squares Square F Value Pr > F Model 2 6.13724 3.06862 92.98 <.0001 Error 24 0.79207 0.03300 Corrected Total 26 6.92931
Root MSE 0.18167 R-Square 0.8857 Dependent Mean 4.42923 Adj R-Sq 0.8762 Coeff Var 4.10155 Parameter Estimates
Parameter Standard Variable DF Estimate Error t Value Pr > |t| Intercept 1 2.85160 0.15664 18.20 <.0001 X 1 0.00311 0.00039893 7.80 <.0001 x2 1 -0.00000110 2.238069E-7 -4.93 <.0001
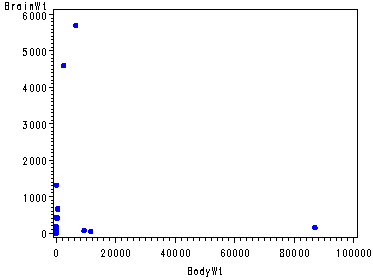
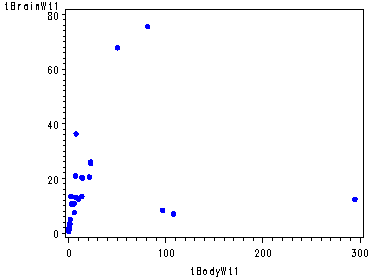
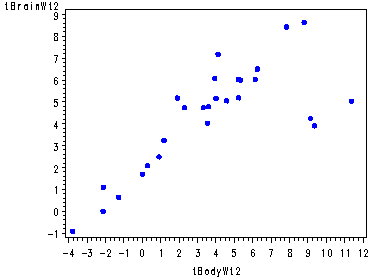
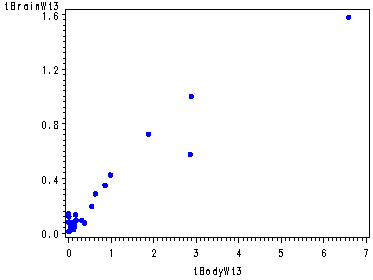
The Brain data, table 6.14, p. 175.
data p176; length name $ 20; input Name BrainWt BodyWt ; cards; Mountain_beaver 8.1 1.35 Cow 423 465 Graywolf 119.5 36.33 Goat 115 27.66 Guineapig 5.5 1.04 Diplodocus 50 11700 Asian_elephant 4603 2547 Donkey 419 187.1 Horse 655 521 Potar_monkey 115 10 Cat 25.6 3.3 Giraffe 680 529 Gorilla 406 207 Human 1320 62 African_elephant 5712 6654 Triceratops 70 9400 Rhesus_monkey 179 6.8 Kangaroo 56 35 Hamster 1 0.12 Mouse 0.4 0.023 Rabbit 12.1 2.5 Sheep 175 55.5 Jaguar 157 100 Chimpanzee 440 52.16 Brachiosaurus 154.5 87000 Rat 1.9 0.28 Mole 3 0.122 Pig 180 192 ; run;Transforming the dependent and independent variables by various powers of lambda, p. 174.
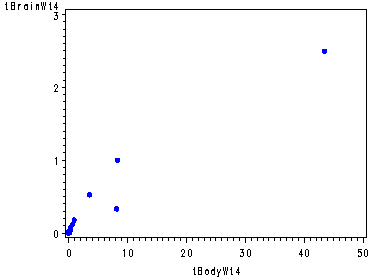
data p176; set p176; tBrainWt1 = BrainWt**.5; tBodyWt1 = BodyWt**.5; tBrainWt2 = log(BrainWt); tBodyWt2 = log(BodyWt); tBrainWt3 = BrainWt**-.5; tBodyWt3 = BodyWt**-.5; tBrainWt4 = 1/BrainWt; tBodyWt4 = 1/BodyWt; run; symbol v=dot h=.8 c=blue; axis1 order=(0 to 80 by 20); axis2 order=(0 to 1.6 by .4); proc gplot data = p176; plot BrainWt*BodyWt; plot tBrainWt1*tBodyWt1/ vaxis=axis1; plot tBrainWt2*tBodyWt2; plot tBrainWt3*tBodyWt3 / vaxis=axis2; plot tBrainWt4*tBodyWt4; run; quit;
