The Equal Education Opportunity data, table 9.1-9.2, p. 228-229.
data p228;
  input ACHV FAM PEER SCHOOL  ;
cards;
-0.43148  0.60814  0.03509  0.16607
0.79969  0.79369  0.47924  0.53356
-0.92467  -0.82630  -0.61951  -0.78635
-2.19081  -1.25310  -1.21675  -1.04076
-2.84818  0.17399  -0.18517  0.14229
-0.66233  0.20246  0.12764  0.27311
2.63674  0.24184  -0.09022  0.04967
2.35847  0.59421  0.21750  0.51876
-0.91305  -0.61561  -0.48971  -0.63219
0.59445  0.99391  0.62228  0.93368
1.21073  1.21721  1.00627  1.17381
1.87164  0.41436  0.71103  0.58978
-0.10178  0.83782  0.74281  0.72154
-2.87949  -0.75512  -0.64411  -0.56986
3.92590  -0.37407  -0.13787  -0.21770
4.35084  1.40353  1.14085  1.37147
1.57922  1.64194  1.29229  1.40269
3.95689  -0.31304  -0.07980  -0.21455
1.09275  1.28525  1.22441  1.20428
-0.62389  -1.51938  -1.27565  -1.36598
-0.63654  -0.38224  -0.05353  -0.35560
-2.02659  -0.19186  -0.42605  -0.53718
-1.46692  1.27649  0.81427  0.91967
3.15078  0.52310  0.30720  0.47231
-2.18938  -1.59810  -1.01572  -1.48315
1.91715  0.77914  0.87771  0.76496
-2.71428  -1.04745  -0.77536  -0.91397
-6.59852  -1.63217  -1.47709  -1.71347
0.65101  0.44328  0.60956  0.32833
-0.13772  -0.24972  0.07876  -0.17216
-2.43959  -0.33480  -0.39314  -0.37198
-3.27802  -0.20680  -0.13936  0.05626
-2.48058  -1.99375  -1.69587  -1.87838
1.88639  0.66475  0.79670  0.69865
5.06459  -0.27977  0.10817  -0.26450
1.96335  -0.43990  -0.66022  -0.58490
0.26274  -0.05334  -0.02396  -0.16795
-2.94593  -2.06699  -1.31832  -1.72082
-1.38628  -1.02560  -1.15858  -1.19420
-0.20797  0.45847  0.21555  0.31347
-1.07820  0.93979  0.63454  0.69907
-1.66386  -0.93238  -0.95216  -1.02725
0.58117  -0.35988  -0.30693  -0.46232
1.37447  -0.00518  0.35985  0.02485
-2.82687  -0.18892  -0.07959  0.01704
3.86363  0.87271  0.47644  0.57036
-2.64141  -2.06993  -1.82915  -2.16738
0.05387  0.32143  -0.25961  0.21632
0.50763  -1.42382  -0.77620  -1.07473
0.64347  -0.07852  -0.21347  -0.11750
2.49414  -0.14925  -0.03192  -0.36598
0.61955  0.52666  0.79149  0.71369
0.61745  -1.49102  -1.02073  -1.38103
-1.00743  -0.94757  -1.28991  -1.24799
-0.37469  0.24550  0.83794  0.59596
-2.52824  -0.41630  -0.60312  -0.34951
0.02372  1.38143  1.54542  1.59429
2.51077  1.03806  0.91637  0.97602
-4.22716  -0.88639  -0.47652  -0.77693
1.96847  1.08655  0.65700  0.89401
1.25668  -1.95142  -1.94199  -1.89645
-0.16848  2.83384  2.47398  2.79222
-0.34158  1.86753  1.55229  1.80057
-2.23973  -1.11172  -0.69732  -0.80197
3.62654  1.41958  1.11481  1.24558
0.97034  0.53940  0.16182  0.33477
3.16093  0.22491  0.74800  0.66182
-1.90801  1.48244  1.47079  1.54283
0.64598  2.05425  1.80369  1.90066
-1.75915  1.24058  0.64484  0.87372
;
run;
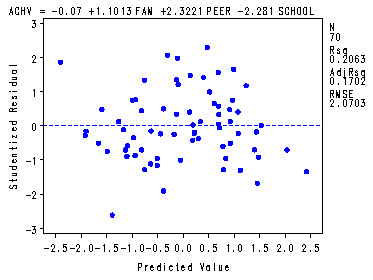
Table 9.3 and fig. 9.1, p. 229.
symbol v=dot h=.8 c=blue;
proc reg data = p228;
  model achv = fam peer school;
  plot student.*p.;
run;
quit;
The REG Procedure Model: MODEL1 Dependent Variable: ACHVAnalysis of Variance
Sum of Mean Source DF Squares Square F Value Pr > F Model 3 73.50623 24.50208 5.72 0.0015 Error 66 282.87323 4.28596 Corrected Total 69 356.37946
Root MSE 2.07026 R-Square 0.2063 Dependent Mean 0.01919 Adj R-Sq 0.1702 Coeff Var 10788 Parameter Estimates
Parameter Standard Variable DF Estimate Error t Value Pr > |t| Intercept 1 -0.06996 0.25064 -0.28 0.7810 FAM 1 1.10126 1.41056 0.78 0.4378 PEER 1 2.32206 1.48129 1.57 0.1218 SCHOOL 1 -2.28100 2.22045 -1.03 0.3080
The correlations displayed in fig. 9.2, p. 231.
proc corr data=p228;
 var fam peer school;
run;
The CORR Procedure
   3  Variables:    FAM      PEER     SCHOOL
                                    Simple Statistics
Variable           N          Mean       Std Dev           Sum       Minimum       Maximum
FAM               70       0.04938       1.08315       3.45683      -2.06993       2.83384
PEER              70       0.04631       0.92480       3.24199      -1.94199       2.47398
SCHOOL            70       0.03191       1.02354       2.23345      -2.16738       2.79222
   Pearson Correlation Coefficients, N = 70
           Prob > |r| under H0: Rho=0
                 FAM          PEER        SCHOOL
FAM          1.00000       0.96008       0.98568
                            <.0001        <.0001
PEER         0.96008       1.00000       0.98216
              <.0001                      <.0001
SCHOOL       0.98568       0.98216       1.00000
              <.0001        <.0001
Fig. 9.2, p. 231.
Note: Proc insight was not actually invoked here because it has to be terminated manually. If the quit statement is added it will not display the graph.
proc insight data = p228;
  scatter fam peer school * fam peer school;
run;
Import data, table 9.5, p. 233.
data p233;
  input YEAR IMPORT DOPROD STOCK CONSUM;
cards;
49 15.9 149.3 4.2 108.1
50 16.4 161.2 4.1 114.8
51 19 171.5 3.1 123.2
52 19.1 175.5 3.1 126.9
53 18.8 180.8 1.1 132.1
54 20.4 190.7 2.2 137.7
55 22.7 202.1 2.1 146
56 26.5 212.4 5.6 154.1
57 28.1 226.1 5 162.3
58 27.6 231.9 5.1 164.3
59 26.3 239 0.7 167.6
60 31.1 258 5.6 176.8
61 33.3 269.8 3.9 186.6
62 37 288.4 3.1 199.7
63 43.3 304.5 4.6 213.9
64 49 323.4 7 223.8
65 50.3 336.8 1.2 232
66 56.6 353.9 4.5 242.9
;
run;
Creating an index variable.
data p233;
  set p233;
  index = _n_;
run;
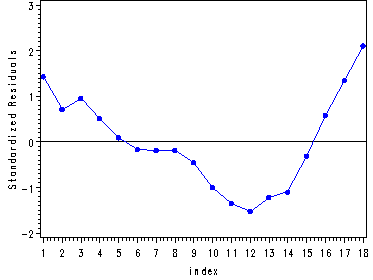
Table 9.6 and fig. 9.3, p. 233.
proc reg data = p233;
  model import = doprod stock consum;
  output out = resid student = stdresid;
run;
quit;
goptions reset = all;
symbol1 i=join color=blue value=dot h=.8;
axis1 label=(angle =90 'Standardized Residuals');
proc gplot data = resid;
  plot stdresid*index / vaxis=axis1 vref=0;
run;
quit;
The REG Procedure Model: MODEL1 Dependent Variable: IMPORTAnalysis of Variance
Sum of Mean Source DF Squares Square F Value Pr > F
Model 3 2576.92075 858.97358 168.45 <.0001 Error 14 71.39037 5.09931 Corrected Total 17 2648.31111
Root MSE 2.25817 R-Square 0.9730 Dependent Mean 30.07778 Adj R-Sq 0.9673 Coeff Var 7.50775
Parameter Estimates
Parameter Standard Variable DF Estimate Error t Value Pr > |t|
Intercept 1 -19.72511 4.12525 -4.78 0.0003 DOPROD 1 0.03220 0.18688 0.17 0.8656 STOCK 1 0.41420 0.32226 1.29 0.2195 CONSUM 1 0.24275 0.28536 0.85 0.4093
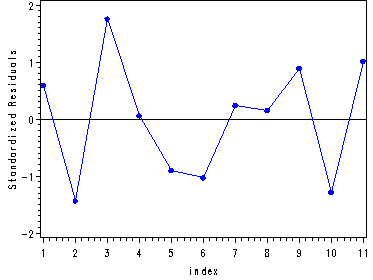
Table 9.7, p. 239 and fig. 9.4, p. 233.
proc reg data = p233;
   where year LE 59;
   model import = doprod stock consum;
   output out=resid student=stdresid;
run;
quit;
goptions reset = all;
symbol1 i=join color=blue value=dot h=.8;
axis1 label=(angle =90 'Standardized Residuals');
proc gplot data = resid;
  plot stdresid*index / vaxis=axis1 vref=0;
run;
quit;
The REG Procedure Model: MODEL1 Dependent Variable: IMPORTAnalysis of Variance
Sum of Mean Source DF Squares Square F Value Pr > F Model 3 204.77614 68.25871 285.61 <.0001 Error 7 1.67295 0.23899 Corrected Total 10 206.44909
Root MSE 0.48887 R-Square 0.9919 Dependent Mean 21.89091 Adj R-Sq 0.9884 Coeff Var 2.23321 Parameter Estimates
Parameter Standard Variable DF Estimate Error t Value Pr > |t|
Intercept 1 -10.12799 1.21216 -8.36 <.0001 DOPROD 1 -0.05140 0.07028 -0.73 0.4883 STOCK 1 0.58695 0.09462 6.20 0.0004 CONSUM 1 0.28685 0.10221 2.81 0.0263
Table 9.8, p. 237.
ods listing close;
proc reg data = p233;
  where year LE 59;
   model import = doprod;
   model import = stock;
   model import = consum;
   model import = doprod stock;
   model import = doprod consum;
   model import = stock consum;
   model import = doprod stock consum;
   ods output  ParameterEstimates=temp;
run;
quit;
ods output close;
ods listing;
data temp;
  set temp;
  keep model variable estimate;
run;
proc transpose data = temp out=wide1;
 by model;
 var variable estimate;
run;
proc print data = wide1;
  var model col1-col4;
run;
Obs Model COL1 COL2 COL3 COL41 MODEL1 Intercept DOPROD 2 MODEL1 -6.55810 0.14620 3 MODEL2 Intercept STOCK 4 MODEL2 19.61124 0.69081 5 MODEL3 Intercept CONSUM 6 MODEL3 -8.01325 0.21400 7 MODEL4 Intercept DOPROD STOCK 8 MODEL4 -8.44014 0.14531 0.62248 9 MODEL5 Intercept DOPROD CONSUM 10 MODEL5 -8.88431 -0.10875 0.37168 11 MODEL6 Intercept STOCK CONSUM 12 MODEL6 -9.74274 0.59605 0.21230 13 MODEL7 Intercept DOPROD STOCK CONSUM 14 MODEL7 -10.12799 -0.05140 0.58695 0.28685
Advertising data, table 9.9, p. 238. Creating the index variable.
data p238;
  input S_t A_t P_t E_t A_t_1 P_t_1 ;
cards;
20.11371 1.98786 1.0 0.30 2.01722 0.0
15.10439 1.94418 0.0 0.30 1.98786 1.0
18.68375 2.19954 0.8 0.35 1.94418 0.0
16.05173 2.00107 0.0 0.35 2.19954 0.8
21.30101 1.69292 1.3 0.30 2.00107 0.0
17.85004 1.74334 0.3 0.32 1.69292 1.3
18.87558 2.06907 1.0 0.31 1.74334 0.3
21.26599 1.01709 1.0 0.41 2.06907 1.0
20.48473 2.01906 0.9 0.45 1.01709 1.0
20.54032 1.06139 1.0 0.45 2.01906 0.9
26.18441 1.45999 1.5 0.50 1.06139 1.0
21.71606 1.87511 0.0 0.60 1.45999 1.5
28.69595 2.27109 0.8 0.65 1.87511 0.0
25.83720 1.11191 1.0 0.65 2.27109 0.8
29.31987 1.77407 1.2 0.65 1.11191 1.0
24.19041 0.95878 1.0 0.65 1.77407 1.2
26.58966 1.98930 1.0 0.62 0.95878 1.0
22.24466 1.97111 0.0 0.60 1.98930 1.0
24.79944 2.26603 0.7 0.60 1.97111 0.0
21.19105 1.98346 0.1 0.61 2.26603 0.7
26.03441 2.10054 1.0 0.60 1.98346 0.1
27.39304 1.06815 1.0 0.58 2.10054 1.0
;
run;
Creating the index variable.
data p238 ;
  set p238;
  index = _n_;
run;
Coefficients for equation on bottom of p. 238.
proc reg data = p238;
  model A_t = P_t P_t_1 A_t_1;
run;
quit;
The REG Procedure Model: MODEL1 Dependent Variable: A_tAnalysis of Variance
Sum of Mean Source DF Squares Square F Value Pr > F Model 3 3.85945 1.28648 213.62 <.0001 Error 18 0.10840 0.00602 Corrected Total 21 3.96786
Root MSE 0.07760 R-Square 0.9727 Dependent Mean 1.75296 Adj R-Sq 0.9681 Coeff Var 4.42706 Parameter Estimates
Parameter Standard Variable DF Estimate Error t Value Pr > |t| Intercept 1 4.63124 0.12937 35.80 <.0001 P_t 1 -0.86953 0.04333 -20.07 <.0001 P_t_1 1 -0.94689 0.04192 -22.59 <.0001 A_t_1 1 -0.86340 0.05024 -17.19 <.0001
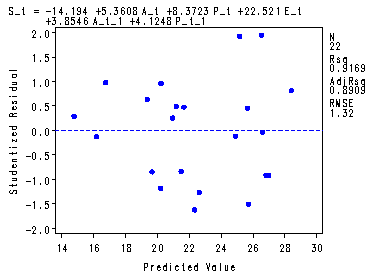
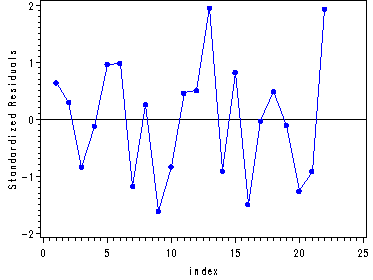
Table 9.10 and fig. 9.5-9.6, p. 239-240.
goptions reset = all;
symbol1 color=blue value=dot h=.8;
proc reg data = p238  ;
  model S_t = A_t P_t E_t A_t_1 P_t_1 ;
  plot student.*p.;
  output out=resid student=stdresid;
run;
quit;
The REG Procedure Model: MODEL1 Dependent Variable: S_tAnalysis of Variance
Sum of Mean Source DF Squares Square F Value Pr > F Model 5 307.57179 61.51436 35.30 <.0001 Error 16 27.87870 1.74242 Corrected Total 21 335.45049
Root MSE 1.32001 R-Square 0.9169 Dependent Mean 22.47579 Adj R-Sq 0.8909 Coeff Var 5.87302 Parameter Estimates
Parameter Standard Variable DF Estimate Error t Value Pr > |t| Intercept 1 -14.19366 18.71511 -0.76 0.4592 A_t 1 5.36075 4.02769 1.33 0.2019 P_t 1 8.37232 3.58641 2.33 0.0329 E_t 1 22.52103 2.14235 10.51 <.0001 A_t_1 1 3.85457 3.57772 1.08 0.2973 P_t_1 1 4.12479 3.89511 1.06 0.3053
goptions reset = all;
symbol1 i=join color=blue value=dot h=.8;
axis1 label=(angle =90 'Standardized Residuals');
axis2  order=(0 to 25 by 5);
proc gplot data = resid;
  plot stdresid*index / haxis=axis2 vaxis=axis1 vref=0;
run;
quit;
Table 9.11, p. 239.
proc corr data = p238;
var A_t P_t E_t A_t_1 P_t_1;
run;
The CORR Procedure
   5  Variables:    A_t      P_t      E_t      A_t_1    P_t_1
                                    Simple Statistics
Variable           N          Mean       Std Dev           Sum       Minimum       Maximum
A_t               22       1.75296       0.43468      38.56506       0.95878       2.27109
P_t               22       0.75455       0.46468      16.60000             0       1.50000
E_t               22       0.49318       0.13947      10.85000       0.30000       0.65000
A_t_1             22       1.79610       0.40987      39.51413       0.95878       2.27109
P_t_1             22       0.70909       0.48786      15.60000             0       1.50000
                 Pearson Correlation Coefficients, N = 22
                        Prob > |r| under H0: Rho=0
                A_t           P_t           E_t         A_t_1         P_t_1
A_t         1.00000      -0.35695      -0.12852      -0.13974      -0.49599
                           0.1029        0.5687        0.5351        0.0189
P_t        -0.35695       1.00000       0.06259      -0.31647      -0.29636
             0.1029                      0.7820        0.1513        0.1805
E_t        -0.12852       0.06259       1.00000      -0.16643       0.20811
             0.5687        0.7820                      0.4592        0.3527
A_t_1      -0.13974      -0.31647      -0.16643       1.00000      -0.35776
             0.5351        0.1513        0.4592                      0.1021
P_t_1      -0.49599      -0.29636       0.20811      -0.35776       1.00000
             0.0189        0.1805        0.3527        0.1021
Table 9.12, p. 242.
ods listing close;
proc reg data = p228 ;
  model achv = fam peer school / vif;
  ods output  ParameterEstimates=temp1;
run;
ods output close;
ods listing;
data temp1;
  set temp1;
  keep dataname variable varianceinflation ;
  dataname = 'EEO';
run;
ods listing close;
proc reg data = p233 ;
  model import = doprod stock consum / vif;
  ods output  ParameterEstimates=temp2;
run;
ods listing;
data temp2;
  set temp2;
  keep dataname variable varianceinflation ;
  dataname = 'Import';
run;
ods listing close;
proc reg data = p238;
   model S_t = A_t P_t E_t A_t_1 P_t_1  / vif;
  ods output  ParameterEstimates=temp3;
run;
ods listing;
data temp3;
  set temp3;
  keep dataname variable varianceinflation ;
  dataname = 'Advertising';
run;
data mtemp;
  set temp1 temp2 temp3;
run;
proc print data= mtemp;
  var dataname variable varianceinflation;
run;
Variance Obs dataname Variable Inflation1 EEO Intercept 0 2 EEO FAM 37.58064 3 EEO PEER 30.21166 4 EEO SCHOOL 83.15544 5 Imp Intercept 0 6 Imp DOPROD 469.74214 7 Imp STOCK 1.04988 8 Imp CONSUM 469.37134 9 Adv Intercept 0 10 Adv A_t 36.94151 11 Adv P_t 33.47351 12 Adv E_t 1.07596 13 Adv A_t_1 25.91565 14 Adv P_t_1 43.52097
Covariance matrix and correlation matrix on p. 244.
proc corr data = p233 cov;
where year <= 59;
var doprod  stock consum;
run;
The CORR Procedure
   3  Variables:    DOPROD   STOCK    CONSUM
                 Covariance Matrix, DF = 10
                  DOPROD             STOCK            CONSUM
DOPROD       899.9709091         1.2790000       617.3263636
STOCK          1.2790000         2.7200000         1.2140000
CONSUM       617.3263636         1.2140000       425.7785455
                                    Simple Statistics
Variable           N          Mean       Std Dev           Sum       Minimum       Maximum
DOPROD            11     194.59091      29.99952          2141     149.30000     239.00000
STOCK             11       3.30000       1.64924      36.30000       0.70000       5.60000
CONSUM            11     139.73636      20.63440          1537     108.10000     167.60000
   Pearson Correlation Coefficients, N = 11
           Prob > |r| under H0: Rho=0
              DOPROD         STOCK        CONSUM
DOPROD       1.00000       0.02585       0.99726
                            0.9399        <.0001
STOCK        0.02585       1.00000       0.03567
              0.9399                      0.9171
CONSUM       0.99726       0.03567       1.00000
              <.0001        0.9171
The Eigenvalues and Eigenvectors on bottom of p. 246 and principal components in table 9.13, p. 247.
Note: Some of the eigenvectors are the additive inverse of those in the book which is due to the fact that eigenvectors are unique up to a multiple of -1.
ods listing close;
proc princomp  data = p233 out=temp ;
 where year <= 59;
 var doprod stock consum;
 ods output  Eigenvectors=temp1;
run;
ods listing;
proc print data = temp1;
run;
proc print data = temp;
  var prin1-prin3;
run;
Obs Variable Prin1 Prin2 Prin31 DOPROD 0.706330 -.035689 0.706982 2 STOCK 0.043501 0.999029 0.006971 3 CONSUM 0.706544 -.025830 -.707197 Obs Prin1 Prin2 Prin3
1 -2.12589 0.63866 0.020722 2 -1.61893 0.55554 0.071113 3 -1.11517 -0.07298 0.021730 4 -0.89430 -0.08237 -0.010813 5 -0.64421 -1.30669 -0.072582 6 -0.19035 -0.65915 -0.026553 7 0.35962 -0.74367 -0.042781 8 0.97180 1.35406 -0.062863 9 1.55932 0.96405 -0.023574 10 1.76700 1.01522 0.044988 11 1.93110 -1.66266 0.080613
Creating newvar, p. 250.
data p233;
  set p233;
  newvar = doprod + consum;
run;
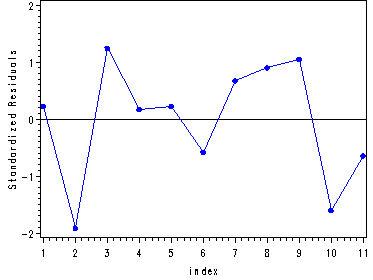
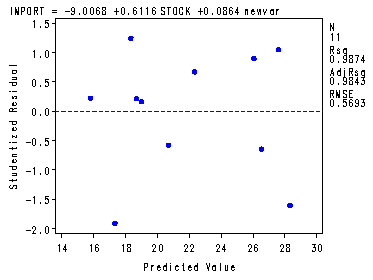
Table 9.14 and fig. 9.7-9.8, p. 250-251.
symbol1 c=blue v=dot h=.8;
proc reg data = p233;
  where year <= 59;
  model import = stock newvar;
  plot student.*p.;
  output out=resid student=stdresid;
run;
quit;

symbol1 c=blue v=dot h=.8;
symbol1 i=join color=blue value=dot h=.8;
axis1 label=(angle =90 'Standardized Residuals');
axis2  order=(0 to 25 by 5);
proc gplot data = resid;
  plot stdresid*index / vaxis=axis1 vref=0;
run;
quit;
The REG Procedure Model: MODEL1 Dependent Variable: IMPORTAnalysis of Variance
Sum of Mean Source DF Squares Square F Value Pr > F Model 2 203.85592 101.92796 314.45 <.0001 Error 8 2.59317 0.32415 Corrected Total 10 206.44909
Root MSE 0.56934 R-Square 0.9874 Dependent Mean 21.89091 Adj R-Sq 0.9843 Coeff Var 2.60080 Parameter Estimates
Parameter Standard Variable DF Estimate Error t Value Pr > |t| Intercept 1 -9.00680 1.24502 -7.23 <.0001 STOCK 1 0.61164 0.10921 5.60 0.0005 newvar 1 0.08638 0.00356 24.27 <.0001
Beware of all the typos on p. 250, please refer to the Errata web page. The correlation, eigenvalues and eigenvectors of stock and newvar, p. 250.
proc princomp data = p233;
  where year <= 59;
  var stock newvar;
run;
The PRINCOMP Procedure
Observations          11
Variables              2
           Simple Statistics
                 STOCK            newvar
Mean       3.300000000       334.3272727
StD        1.649242250        50.6004168
      Correlation Matrix
             STOCK      newvar
STOCK       1.0000      0.0299
newvar      0.0299      1.0000
            Eigenvalues of the Correlation Matrix
        Eigenvalue    Difference    Proportion    Cumulative
   1    1.02987334    0.05974667        0.5149        0.5149
   2    0.97012666                      0.4851        1.0000
           Eigenvectors
               Prin1         Prin2
STOCK       0.707107      0.707107
newvar      0.707107      -.707107
Table 9.15, p. 253.
proc reg data = p233;
  where year <= 59;
  model import = doprod stock ;
run;
quit;
The REG Procedure Model: MODEL1 Dependent Variable: IMPORTAnalysis of Variance
Sum of Mean Source DF Squares Square F Value Pr > F Model 2 202.89371 101.44685 228.27 <.0001 Error 8 3.55538 0.44442 Corrected Total 10 206.44909
Root MSE 0.66665 R-Square 0.9828 Dependent Mean 21.89091 Adj R-Sq 0.9785 Coeff Var 3.04533 Parameter Estimates
Parameter Standard Variable DF Estimate Error t Value Pr > |t| Intercept 1 -8.44014 1.43518 -5.88 0.0004 DOPROD 1 0.14531 0.00703 20.67 <.0001 STOCK 1 0.62248 0.12787 4.87 0.0012
The PC coefficients for equations in 9.27, p. 253.
Note: The eigenvectors are unique up to a multiple of -1.
proc princomp data = p238 out = temp;
  var A_t P_t E_t A_t_1 P_t_1;
run;
The PRINCOMP Procedure
Observations          22
Variables              5
                                      Simple Statistics
                   A_t               P_t               E_t             A_t_1             P_t_1
Mean       1.752957273      0.7545454545      0.4931818182       1.796096818      0.7090909091
StD        0.434678765      0.4646834793      0.1394679128       0.409865806      0.4878613102
                       Correlation Matrix
              A_t         P_t         E_t       A_t_1       P_t_1
A_t        1.0000      -.3570      -.1285      -.1397      -.4960
P_t        -.3570      1.0000      0.0626      -.3165      -.2964
E_t        -.1285      0.0626      1.0000      -.1664      0.2081
A_t_1      -.1397      -.3165      -.1664      1.0000      -.3578
P_t_1      -.4960      -.2964      0.2081      -.3578      1.0000
            Eigenvalues of the Correlation Matrix
        Eigenvalue    Difference    Proportion    Cumulative
   1    1.70095474    0.41274783        0.3402        0.3402
   2    1.28820691    0.14355527        0.2576        0.5978
   3    1.14465164    0.28573629        0.2289        0.8268
   4    0.85891534    0.85164396        0.1718        0.9985
   5    0.00727138                      0.0015        1.0000
                               Eigenvectors
              Prin1         Prin2         Prin3         Prin4         Prin5
A_t        -.532445      -.023790      0.667740      0.074417      0.514316
P_t        0.232452      0.824945      -.157793      -.037107      0.489036
E_t        0.389086      -.022080      0.217210      0.894902      -.009710
A_t_1      -.395228      -.259638      -.691911      0.338018      0.428236
P_t_1      0.595714      -.501000      0.057474      -.279247      0.559323
The PC’s found by SAS were the additive inverses of those in the book. For a quick fix to get them to be exactly the same just transform them by -1.
proc print data = temp (obs = 10);
  var prin1-prin5;
run;
data temp1;
  set temp;
  prin1 = -1*prin1;
  prin3 = -1*prin3;
  prin5 = -1*prin5;
run;
proc print data = temp1 (obs = 10);
  var prin1-prin5;
run;
Obs Prin1 Prin2 Prin3 Prin4 Prin51 -1.78296 1.04159 -0.48019 -0.63071 -0.03222 2 -0.98031 -1.73963 -0.04034 -1.15494 -0.02050 3 -1.93238 0.71330 0.11408 -0.31791 -0.07203 4 -1.35884 -1.67937 -0.25599 -0.53532 0.03520 5 -1.25604 1.60055 -1.00787 -0.71848 -0.08235 6 0.12229 -1.32047 0.11365 -1.49990 0.09198 7 -1.22412 0.90098 0.15783 -0.95023 0.12096 8 0.88410 0.01753 -1.76986 -0.62071 0.01215 9 0.73275 0.44523 1.64148 -1.05210 -0.00946 10 0.86754 0.14315 -1.56687 -0.34047 -0.10512
Obs Prin1 Prin2 Prin3 Prin4 Prin5
1 1.78296 1.04159 0.48019 -0.63071 0.03222 2 0.98031 -1.73963 0.04034 -1.15494 0.02050 3 1.93238 0.71330 -0.11408 -0.31791 0.07203 4 1.35884 -1.67937 0.25599 -0.53532 -0.03520 5 1.25604 1.60055 1.00787 -0.71848 0.08235 6 -0.12229 -1.32047 -0.11365 -1.49990 -0.09198 7 1.22412 0.90098 -0.15783 -0.95023 -0.12096 8 -0.88410 0.01753 1.76986 -0.62071 -0.01215 9 -0.73275 0.44523 -1.64148 -1.05210 0.00946 10 -0.86754 0.14315 1.56687 -0.34047 0.10512
Table 9.16, p. 256. The estimated coefficients in the table 9.16 correspond to the standardized estimates in the output.
proc reg data = p238;
  model S_t = A_t P_t E_t A_t_1 P_t_1/stb;
run;
quit;
The REG Procedure Model: MODEL1 Dependent Variable: S_tAnalysis of Variance
Sum of Mean Source DF Squares Square F Value Pr > F Model 5 307.57179 61.51436 35.30 <.0001 Error 16 27.87870 1.74242 Corrected Total 21 335.45049
Root MSE 1.32001 R-Square 0.9169 Dependent Mean 22.47579 Adj R-Sq 0.8909 Coeff Var 5.87302 Parameter Estimates
Parameter Standard Standardized Variable DF Estimate Error t Value Pr > |t| Estimate Intercept 1 -14.19366 18.71511 -0.76 0.4592 0 A_t 1 5.36075 4.02769 1.33 0.2019 0.58303 P_t 1 8.37232 3.58641 2.33 0.0329 0.97342 E_t 1 22.52103 2.14235 10.51 <.0001 0.78588 A_t_1 1 3.85457 3.57772 1.08 0.2973 0.39529 P_t_1 1 4.12479 3.89511 1.06 0.3053 0.50349
We thank Yusuf Ma for the following SAS code to replicate the values shown in Table 9.16.
proc reg data=p238;
model s_t = a_t p_t e_t A_t_1 p_t_1/stb;
ods output parameterestimates=temp1;
run;
quit;

data temp1;
set temp1;
label stderr_stb ='s.e.'
variable = 'variable';
if variable = 'Intercept' then delete;
stderr_stb = StandardizedEst/tvalue;
keep variable standardizedest stderr_stb tvalue probt; run;

*to put the variables in the order as the book;
data temp1;
retain variable standardizedest stderr_stb tvalue probt;
set temp1;
run;


proc print data=temp1 label;
Title 'Regression results obtained from fitting the model in (9.29)';
run;
title "";
Regression results obtained from fitting the model in (9.29)                                     3

                                      stderr_
Obs    variable    standardizedest      stb       tvalue     probt

 1      A_t              0.58303      0.43805       1.33    0.2019
 2      P_t              0.97342      0.41698       2.33    0.0329
 3      E_t              0.78588      0.07476      10.51    <.0001
 4      A_t_1            0.39529      0.36690       1.08    0.2973
 5      P_t_1            0.50349      0.47546       1.06    0.3053
Creating the standardized variable for S_t to be used in regression p. 257.
proc sql;
 create table tempstd as
 select *, (S_t - mean(S_t))/std(S_t) as zs_t
 from temp1;
quit;
Table 9.17, p. 257.
Note: The regression model has no intercept (the noint option in the model statement) because all the variables have been standardized.
proc reg data = tempstd;
  model zs_t = prin1-prin5/noint;
run;
quit;
The REG Procedure
Model: MODEL1
Dependent Variable: zs_t
NOTE: No intercept in model. R-Square is redefined
                             Analysis of Variance
                                    Sum of           Mean
Source                   DF        Squares         Square    F Value    Pr > F
Model                     5       19.25473        3.85095      37.51    <.0001
Error                    17        1.74527        0.10266
Uncorrected Total        22       21.00000
Root MSE              0.32041    R-Square     0.9169
Dependent Mean    -3.1288E-16    Adj R-Sq     0.8924
Coeff Var         -1.02407E17
                        Parameter Estimates
                     Parameter       Standard
Variable     DF       Estimate          Error    t Value    Pr > |t|
Prin1         1       -0.36533        0.05361      -6.81      <.0001
Prin2         1        0.41691        0.06160       6.77      <.0001
Prin3         1       -0.16185        0.06535      -2.48      0.0241
Prin4         1        0.70357        0.07544       9.33      <.0001
Prin5         1       -1.21916        0.81995      -1.49      0.1554

