Inputting Snoring and Heart Disease data, table 4.1, p. 75.
data glm;
input snoring disease total;
cards;
0 24 1379
2 35 638
4 21 213
5 30 254
;
run;
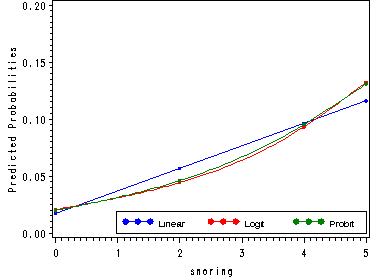
Three models are used to estimate the probability of heart disease using an identity, logit and probit link function. The results of the model using the identity link function is at the bottom of p. 75; the results of the model using a logit link function is on p. 78; the results of the model using a probit link function is on p. 79.
data glm;
  set glm;
  id = _n_;
run;
proc genmod data=glm;
 model disease/total = snoring / dist=bin link=identity ;
 output out=temp1 p=pid;
run;
proc genmod data=glm;
 model disease/total = snoring / dist=bin link=logit ;
 output out=temp2 p=plogit;
run;
proc genmod data=glm;
 model disease/total = snoring / dist=bin link=probit;
  output out=temp3 p=pprobit;
run;
The GENMOD ProcedureModel Information Data Set WORK.GLM Distribution Binomial Link Function Identity Response Variable (Events) disease Response Variable (Trials) total Observations Used 4 Number Of Events 110 Number Of Trials 2484 Criteria For Assessing Goodness Of Fit
Criterion DF Value Value/DF Deviance 2 0.0692 0.0346 Scaled Deviance 2 0.0692 0.0346 Pearson Chi-Square 2 0.0688 0.0344 Scaled Pearson X2 2 0.0688 0.0344 Log Likelihood -417.4960
Algorithm converged. Analysis Of Parameter Estimates
Standard Wald 95% Confidence Chi- Parameter DF Estimate Error Limits Square Pr > ChiSq Intercept 1 0.0172 0.0034 0.0105 0.0240 25.18 <.0001 snoring 1 0.0198 0.0028 0.0143 0.0253 49.97 <.0001 Scale 0 1.0000 0.0000 1.0000 1.0000 NOTE: The scale parameter was held fixed.
The GENMOD Procedure
Model Information Data Set WORK.GLM Distribution Binomial Link Function Logit Response Variable (Events) disease Response Variable (Trials) total Observations Used 4 Number Of Events 110 Number Of Trials 2484 Criteria For Assessing Goodness Of Fit
Criterion DF Value Value/DF Deviance 2 2.8089 1.4045 Scaled Deviance 2 2.8089 1.4045 Pearson Chi-Square 2 2.8743 1.4372 Scaled Pearson X2 2 2.8743 1.4372 Log Likelihood -418.8658
Algorithm converged. Analysis Of Parameter Estimates
Standard Wald 95% Confidence Chi- Parameter DF Estimate Error Limits Square Pr > ChiSq Intercept 1 -3.8662 0.1662 -4.1920 -3.5405 541.06 <.0001 snoring 1 0.3973 0.0500 0.2993 0.4954 63.12 <.0001 Scale 0 1.0000 0.0000 1.0000 1.0000 NOTE: The scale parameter was held fixed.
The GENMOD Procedure
Model Information Data Set WORK.GLM Distribution Binomial Link Function Probit Response Variable (Events) disease Response Variable (Trials) total Observations Used 4 Number Of Events 110 Number Of Trials 2484 Criteria For Assessing Goodness Of Fit
Criterion DF Value Value/DF Deviance 2 1.8716 0.9358 Scaled Deviance 2 1.8716 0.9358 Pearson Chi-Square 2 1.9101 0.9550 Scaled Pearson X2 2 1.9101 0.9550 Log Likelihood -418.3971
Algorithm converged. Analysis Of Parameter Estimates
Standard Wald 95% Confidence Chi- Parameter DF Estimate Error Limits Square Pr > ChiSq Intercept 1 -2.0606 0.0704 -2.1986 -1.9225 855.49 <.0001 snoring 1 0.1878 0.0236 0.1415 0.2341 63.14 <.0001 Scale 0 1.0000 0.0000 1.0000 1.0000 NOTE: The scale parameter was held fixed.
Table 4.1, p. 75.
data combo;
  merge temp1 temp2 temp3;
  by id;
  prop = disease/total;
  no = total - disease;
run;
proc print data = combo;
 var snoring disease no prop pid plogit pprobit;
run;
Obs snoring disease no prop pid plogit pprobit1 0 24 1355 0.01740 0.01725 0.02051 0.01967 2 2 35 603 0.05486 0.05680 0.04430 0.04599 3 4 21 192 0.09859 0.09636 0.09305 0.09519 4 5 30 224 0.11811 0.11614 0.13244 0.13100
Figure 4.1, p. 76.
symbol1 v=dot c=blue h=.4 i=join;
symbol2 v=dot c=red h=.4 i=spline;
symbol3 v=dot c=green h=.4 i=spline;
axis1 label=(angle=90 'Predicted Probabilities') order=(0 to .2 by .05);
legend label=none value=(h=1 font=swiss 'Linear' 'Logit' 'Probit')
       position=(bottom right inside) mode=share cborder=black;
proc gplot data = combo;
  plot (pid plogit pprobit)*snoring/overlay vaxis=axis1 legend=legend1;
run;
quit;
Inputting the Horseshoe Crab data, p. 82-83.
data crab;
 input color spine width satell weight;
 if satell>0 then y=1;
 if satell=0 then y=0;
 n=1;
 weight = weight/1000;
 color = color - 1;
 if color=4 then dark=0;
 if color < 4 then dark=1;
cards;
3  3  28.3  8  3050
4  3  22.5  0  1550
2  1  26.0  9  2300
4  3  24.8  0  2100
4  3  26.0  4  2600
3  3  23.8  0  2100
2  1  26.5  0  2350
4  2  24.7  0  1900
3  1  23.7  0  1950
4  3  25.6  0  2150
4  3  24.3  0  2150
3  3  25.8  0  2650
3  3  28.2  11 3050
5  2  21.0  0  1850
3  1  26.0  14 2300
2  1  27.1  8  2950
3  3  25.2  1  2000
3  3  29.0  1  3000
5  3  24.7  0  2200
3  3  27.4  5  2700
3  2  23.2  4  1950
2  2  25.0  3  2300
3  1  22.5  1  1600
4  3  26.7  2  2600
5  3  25.8  3  2000
5  3  26.2  0  1300
3  3  28.7  3  3150
3  1  26.8  5  2700
5  3  27.5  0  2600
3  3  24.9  0  2100
2  1  29.3  4  3200
2  3  25.8  0  2600
3  2  25.7  0  2000
3  1  25.7  8  2000
3  1  26.7  5  2700
5  3  23.7  0  1850
3  3  26.8  0  2650
3  3  27.5  6  3150
5  3  23.4  0  1900
3  3  27.9  6  2800
4  3  27.5  3  3100
2  1  26.1  5  2800
2  1  27.7  6  2500
3  1  30.0  5  3300
4  1  28.5  9  3250
4  3  28.9  4  2800
3  3  28.2  6  2600
3  3  25.0  4  2100
3  3  28.5  3  3000
3  1  30.3  3  3600
5  3  24.7  5  2100
3  3  27.7  5  2900
2  1  27.4  6  2700
3  3  22.9  4  1600
3  1  25.7  5  2000
3  3  28.3  15 3000
3  3  27.2  3  2700
4  3  26.2  3  2300
3  1  27.8  0  2750
5  3  25.5  0  2250
4  3  27.1  0  2550
4  3  24.5  5  2050
4  1  27.0  3  2450
3  3  26.0  5  2150
3  3  28.0  1  2800
3  3  30.0  8  3050
3  3  29.0  10 3200
3  3  26.2  0  2400
3  1  26.5  0  1300
3  3  26.2  3  2400
4  3  25.6  7  2800
4  3  23.0  1  1650
4  3  23.0  0  1800
3  3  25.4  6  2250
4  3  24.2  0  1900
3  2  22.9  0  1600
4  2  26.0  3  2200
3  3  25.4  4  2250
4  3  25.7  0  1200
3  3  25.1  5  2100
4  2  24.5  0  2250
5  3  27.5  0  2900
4  3  23.1  0  1650
4  1  25.9  4  2550
3  3  25.8  0  2300
5  3  27.0  3  2250
3  3  28.5  0  3050
5  1  25.5  0  2750
5  3  23.5  0  1900
3  2  24.0  0  1700
3  1  29.7  5  3850
3  1  26.8  0  2550
5  3  26.7  0  2450
3  1  28.7  0  3200
4  3  23.1  0  1550
3  1  29.0  1  2800
4  3  25.5  0  2250
4  3  26.5  1  1967
4  3  24.5  1  2200
4  3  28.5  1  3000
3  3  28.2  1  2867
3  3  24.5  1  1600
3  3  27.5  1  2550
3  2  24.7  4  2550
3  1  25.2  1  2000
4  3  27.3  1  2900
3  3  26.3  1  2400
3  3  29.0  1  3100
3  3  25.3  2  1900
3  3  26.5  4  2300
3  3  27.8  3  3250
3  3  27.0  6  2500
4  3  25.7  0  2100
3  3  25.0  2  2100
3  3  31.9  2  3325
5  3  23.7  0  1800
5  3  29.3  12 3225
4  3  22.0  0  1400
3  3  25.0  5  2400
4  3  27.0  6  2500
4  3  23.8  6  1800
2  1  30.2  2  3275
4  3  26.2  0  2225
3  3  24.2  2  1650
3  3  27.4  3  2900
3  2  25.4  0  2300
4  3  28.4  3  3200
5  3  22.5  4  1475
3  3  26.2  2  2025
3  1  24.9  6  2300
2  2  24.5  6  1950
3  3  25.1  0  1800
3  1  28.0  4  2900
5  3  25.8  10 2250
3  3  27.9  7  3050
3  3  24.9  0  2200
3  1  28.4  5  3100
4  3  27.2  5  2400
3  2  25.0  6  2250
3  3  27.5  6  2625
3  1  33.5  7  5200
3  3  30.5  3  3325
4  3  29.0  3  2925
3  1  24.3  0  2000
3  3  25.8  0  2400
5  3  25.0  8  2100
3  1  31.7  4  3725
3  3  29.5  4  3025
4  3  24.0  10 1900
3  3  30.0  9  3000
3  3  27.6  4  2850
3  3  26.2  0  2300
3  1  23.1  0  2000
3  1  22.9  0  1600
5  3  24.5  0  1900
3  3  24.7  4  1950
3  3  28.3  0  3200
3  3  23.9  2  1850
4  3  23.8  0  1800
4  2  29.8  4  3500
3  3  26.5  4  2350
3  3  26.0  3  2275
3  3  28.2  8  3050
5  3  25.7  0  2150
3  3  26.5  7  2750
3  3  25.8  0  2200
4  3  24.1  0  1800
4  3  26.2  2  2175
4  3  26.1  3  2750
4  3  29.0  4  3275
2  1  28.0  0  2625
5  3  27.0  0  2625
3  2  24.5  0  2000
;
run;
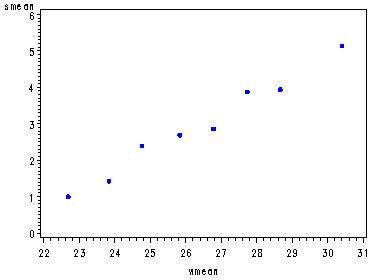
Fig. 4.4, p. 85.
data crab1;
  set crab;
  wcat=0;
  if width<=23.25 then wcat=1;
  if 23.25< width<=24.25 then wcat=2;
  if 24.25< width<=25.25 then wcat=3;
  if 25.25< width<=26.25 then wcat=4;
  if 26.25< width<=27.25 then wcat=5;
  if 27.25< width<=28.25 then wcat=6;
  if 28.25< width<=29.25 then wcat=7;
  if 29.25< width then wcat=8;
run;
proc sql;
  create table midpt as
  select *, mean(satell) as smean, mean(width) as wmean, std(satell)*std(satell) as varsatell,
            count(wcat) as number
  from crab1
  group by wcat;
quit;
proc sort data=midpt;
  by wcat;
run;
data midpt;
  set midpt;
  by wcat;
  if first.wcat;
run;
goptions reset=all;
symbol v=dot c=blue h=.7;
axis1 order=(0 to 6 by 1);
proc gplot data=midpt;
  plot smean*wmean/ vaxis=axis1;
run;
quit;
goptions reset=all;
The Poisson Regression for the Horseshoe Crab data, p. 81. Obtaining the fitted value at the mean width of x=26.3 by outputting the predicted values from the genmod procedure, p. 84.
proc genmod data=crab;
  model satell = width / dist=poi link=log;
  output out=temp1 p=pred1;
run;
proc print data = temp1;
  where width = 26.3;
  var width pred1;
run;
The GENMOD ProcedureModel Information Data Set WORK.CRAB Distribution Poisson Link Function Log Dependent Variable satell Observations Used 173
Criteria For Assessing Goodness Of Fit
Criterion DF Value Value/DF Deviance 171 567.8786 3.3209 Scaled Deviance 171 567.8786 3.3209 Pearson Chi-Square 171 544.1570 3.1822 Scaled Pearson X2 171 544.1570 3.1822 Log Likelihood 68.4463
Algorithm converged. Analysis Of Parameter Estimates
Standard Wald 95% Confidence Chi- Parameter DF Estimate Error Limits Square Pr > ChiSq Intercept 1 -3.3048 0.5422 -4.3675 -2.2420 37.14 <.0001 width 1 0.1640 0.0200 0.1249 0.2032 67.51 <.0001 Scale 0 1.0000 0.0000 1.0000 1.0000 NOTE: The scale parameter was held fixed. Obs width pred1
107 26.3 2.74458
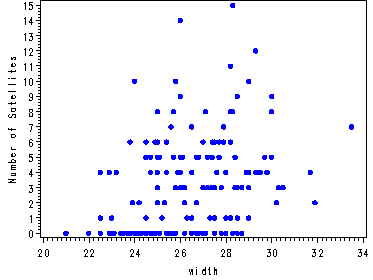
Fig. 4.3, p. 84.
goptions reset=all;
symbol v=dot c=blue h=.8;
axis1 label=(angle=90 'Number of Satellites') order=(0 to 15 by 1);
axis2 order=(20 to 34 by 2);
proc gplot data=crab;
 plot satell*width/vaxis=axis1 haxis=axis2;
run;
quit;
Fig. 4.4, p. 85 was not reproduced. *Or should it be produced as it was above???
The Poisson regression using the identity link function, p. 85.
proc genmod data=crab;
  model satell = width / dist=poi link=identity;
  output out=temp2 p=pred2;
run;
proc print data = temp2;
  where width = 26.3 or width=27.3;
  var width satell pred2;
run;
The GENMOD ProcedureModel Information Data Set WORK.CRAB Distribution Poisson Link Function Identity Dependent Variable satell Observations Used 173 Criteria For Assessing Goodness Of Fit
Criterion DF Value Value/DF Deviance 171 557.7083 3.2615 Scaled Deviance 171 557.7083 3.2615 Pearson Chi-Square 171 542.4854 3.1724 Scaled Pearson X2 171 542.4854 3.1724 Log Likelihood 73.5314
Algorithm converged. Analysis Of Parameter Estimates
Standard Wald 95% Confidence Chi- Parameter DF Estimate Error Limits Square Pr > ChiSq Intercept 1 -11.5321 1.5104 -14.4924 -8.5717 58.29 <.0001 width 1 0.5495 0.0593 0.4333 0.6657 85.89 <.0001 Scale 0 1.0000 0.0000 1.0000 1.0000 NOTE: The scale parameter was held fixed. Obs width satell pred2
106 27.3 1 3.46921 107 26.3 1 2.91971
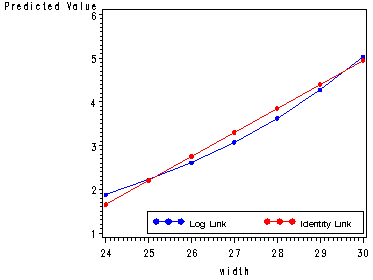
Fig. 4.5, p. 86.
data temp1;
  set temp1;
  id = _n_;
run;
data temp2;
  set temp2;
  id = _n_;
run;
data combo;
  merge temp1 temp2;
  by id;
run;
proc sort data = combo;
  by width;
run;
goptions reset=all;
symbol1 v=dot c=blue h=.6 i=join;
symbol2 v=dot c=red h=.6 i=join;
legend1 label=none value=(height=1 font=swiss 'Log Link' 'Identity Link' )
        position=(bottom right inside) mode=share cborder=black;
proc gplot data = combo;
  where width=24 or width=25 or width=26 or width=27 or width=28 or width=29 or
        width=30 or width=31 ;
  plot (pred1 pred2)*width/ overlay legend=legend1;
run;
quit;
goptions reset=all;
Table 4.3, p. 90.
Note: A new variable observation was added to the dataset in order to be able to merge it with the output from the genmod procedure.
data midpt1;
 input observation width cases satell;
 log_case = log(cases);
cards;
1 22.69  14  14
2 23.84  14  20
3 24.77  28  67
4 25.84  39 105
5 26.79  22  63
6 27.74  24  93
7 28.67  18  71
8 30.41  14  72
;
run;
proc genmod data = midpt1;
 model satell = width / dist=poi link=log offset=log_case obstats ;
 ods output ObStats=temp;
run;
data combo;
  merge temp midpt1;
  by observation;
run;
proc format;
  value width 22.69='<=23.25' 23.84='23.25-24.25' 24.77='24.25-25.25' 25.84='25.25-26.25'
             26.79='26.25-27.25' 27.74='27.25-28.25' 28.67='28.25-29.25' 30.41='>29.25';
run;
proc print data=combo;
  format width width.;
  var width cases pred reschi streschi;
run;
The GENMOD ProcedureModel Information Data Set WORK.MIDPT1 Distribution Poisson Link Function Log Dependent Variable satell Offset Variable log_case Observations Used 8 Criteria For Assessing Goodness Of Fit
Criterion DF Value Value/DF Deviance 6 6.5168 1.0861 Scaled Deviance 6 6.5168 1.0861 Pearson Chi-Square 6 6.2470 1.0412 Scaled Pearson X2 6 6.2470 1.0412 Log Likelihood 1652.1028
Algorithm converged. Analysis Of Parameter Estimates
Standard Wald 95% Confidence Chi- Parameter DF Estimate Error Limits Square Pr > ChiSq Intercept 1 -3.5355 0.5760 -4.6645 -2.4065 37.67 <.0001 width 1 0.1727 0.0212 0.1311 0.2143 66.18 <.0001 Scale 0 1.0000 0.0000 1.0000 1.0000 NOTE: The scale parameter was held fixed. Observation Statistics
Observation satell log_case width Pred Xbeta Std HessWgt Lower Upper Resraw Reschi Resdev StResdev StReschi Reslik 1 14 2.6390573 22.69 20.544353 3.0225861 0.1027001 20.544353 16.798637 25.12528 -6.544353 -1.443845 -1.532938 -1.732037 -1.631372 -1.710727 2 20 2.6390573 23.84 25.058503 3.2212132 0.0813848 25.058503 21.363886 29.392059 -5.058503 -1.010519 -1.047745 -1.14727 -1.106509 -1.140606 3 67 3.3322045 24.77 58.849849 4.0749893 0.0657446 58.849849 51.734881 66.943322 8.1501507 1.062412 1.039205 1.2034817 1.2303572 1.2103746
The GENMOD Procedure
Observation Statistics
Observation satell log_case width Pred Xbeta Std HessWgt Lower Upper Resraw Reschi Resdev StResdev StReschi Reslik 4 105 3.6635616 25.84 98.608352 4.591156 0.0513763 98.608352 89.162468 109.05493 6.3916476 0.6436592 0.636887 0.740506 0.74838 0.7425635 5 63 3.0910425 26.79 65.543892 4.18272 0.0448389 65.543892 60.029581 71.564747 -2.543892 -0.314219 -0.316285 -0.33944 -0.337223 -0.339149 6 93 3.1780538 27.74 84.252198 4.4338147 0.0468532 84.252198 76.859888 92.355494 8.7478019 0.9530338 0.9372168 1.0381222 1.0556422 1.0413848 7 71 2.8903718 28.67 74.1998 4.3067615 0.0562513 74.1998 66.454059 82.848368 -3.1998 -0.371468 -0.374187 -0.427757 -0.424648 -0.427029 8 72 2.6390573 30.41 77.943052 4.3559785 0.0840923 77.943052 66.099465 91.908752 -5.943052 -0.673164 -0.682002 -1.017999 -1.004806 -1.010749
Obs width cases Pred Reschi Streschi
1 <=23.25 14 20.544353 -1.443845 -1.631372 2 23.25-24.25 14 25.058503 -1.010519 -1.106509 3 24.25-25.25 28 58.849849 1.062412 1.2303572 4 25.25-26.25 39 98.608352 0.6436592 0.74838 5 26.25-27.25 22 65.543892 -0.314219 -0.337223 6 27.25-28.25 24 84.252198 0.9530338 1.0556422 7 28.25-29.25 18 74.1998 -0.371468 -0.424648 8 >29.25 14 77.943052 -0.673164 -1.004806
Table 4.4, p. 92. Using the dataset that was created for Fig. 4.4.
proc format;
  value wcat 1='<=23.25' 2='23.25-24.25' 3='24.25-25.25' 4='25.25-26.25'
             5='26.25-27.25' 6='27.25-28.25' 7='28.25-29.25' 8='>29.25';
run;
proc print data=midpt;
  format wcat wcat.;
  var  wcat number  smean varsatell;
run;
Obs wcat number smean varsatell1 <=23.25 14 1.00000 2.7692 2 23.25-24.25 14 1.42857 8.8791 3 24.25-25.25 28 2.39286 6.5437 4 25.25-26.25 39 2.69231 11.3765 5 26.25-27.25 22 2.86364 6.8853 6 27.25-28.25 24 3.87500 8.8098 7 28.25-29.25 18 3.94444 16.8791 8 >29.25 14 5.14286 8.2857


