Table 11.1 and Table 11.2 on page 194.
data table11_1;
  input Subject	Group $	week1-week8;
datalines;
1	A	45	45	45	45	80	80	80	90
2	A	20	25	25	25	30	35	30	50
3	A	50	50	55	70	70	75	90	90
4	A	25	25	35	40	60	60	70	80
5	A	100	100	100	100	100	100	100	100
6	A	20	20	30	50	50	60	85	95
7	A	30	35	35	40	50	60	75	85
8	A	30	35	45	50	55	65	65	70
9	B	40	55	60	70	80	85	90	90
10	B	65	65	70	70	80	80	80	80
11	B	30	30	40	45	65	85	85	85
12	B	25	35	35	35	40	45	45	45
13	B	45	45	80	80	80	80	80	80
14	B	15	15	10	10	10	20	20	20
15	B	35	35	35	45	45	45	50	50
16	B	40	40	40	55	55	55	60	65
17	C	20	20	30	30	30	30	30	30
18	C	35	35	35	40	40	40	40	40
19	C	35	35	35	40	40	40	45	45
20	C	45	65	65	65	80	85	95	100
21	C	45	65	70	90	90	95	95	100
22	C	25	30	30	35	40	40	40	40
23	C	25	25	30	30	30	30	35	40
24	C	15	35	35	35	40	50	65	65
;
run;
options linesize = 100;
proc corr data = table11_1 nosimple noprob;
  var week:;
run;
                          Pearson Correlation Coefficients, N = 24
           week1      week2      week3      week4      week5      week6      week7      week8
week1    1.00000    0.92804    0.88202    0.83065    0.79366    0.71256    0.61635    0.55442
week2    0.92804    1.00000    0.92256    0.87741    0.84668    0.78959    0.70415    0.64260
week3    0.88202    0.92256    1.00000    0.95309    0.90921    0.85426    0.76673    0.70079
week4    0.83065    0.87741    0.95309    1.00000    0.92152    0.87863    0.83134    0.77160
week5    0.79366    0.84668    0.90921    0.92152    1.00000    0.97343    0.91495    0.88196
week6    0.71256    0.78959    0.85426    0.87863    0.97343    1.00000    0.95693    0.92669
week7    0.61635    0.70415    0.76673    0.83134    0.91495    0.95693    1.00000    0.97761
week8    0.55442    0.64260    0.70079    0.77160    0.88196    0.92669    0.97761    1.00000
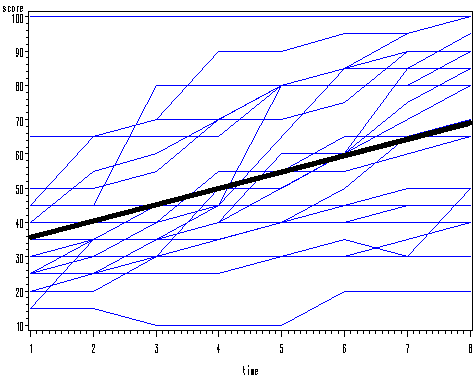
Figure 11.2 on page 195. In order to generate this plot, we need to reshape the data from wide to long format. This is done in a data step. The overall regression line is generated using the regression result in a data step. We merged the original data set and the data set with overall predicted values together before plotting them.
data table11_1long;
  set table11_1;
  array week(8) week1-week8;
  do time = 1 to 8;
  score = week(time);
  output;
  end;
  drop week1-week8;
run;
proc reg data = table11_1long ;
  model score = time;
run;
quit;
data pred;
  set table11_1long;
  subject= 100;
  score = 30.93006 +  4.76438*time;
run;
data all;
  set table11_1long pred;
run;
goptions reset = all;
symbol1 i = join v=none r=24 c= blue w=1.5;
symbol2 i = join v = none c = black w=4;
proc gplot data = all;
 plot score*time = subject / nolegend;
run;
quit;
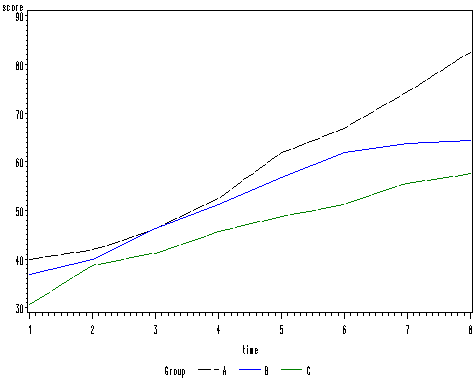
Figure 11.3 on page 195. We created a data set with averaged scores for each group over time using proc sql.
proc sql;
  create table ave as
  select distinct mean(score) as score, time as time, group as group
  from table11_1long
  group by group, time;
quit;
symbol1 i = join v= none c = black l = 4;
symbol2 i = join v = none c = blue l = 1;
symbol3 i = join v = none c = green l = 5;
proc gplot data = ave;
  plot score*time = group;
run;
quit;

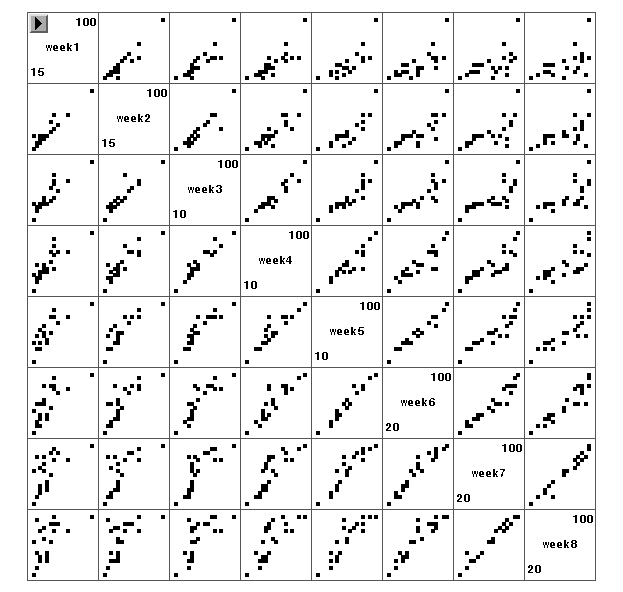
Figure 11.4 on page 196. Proc insight can be used to generate scatter plot matrix.
proc insight data = table11_1 nomenu noconfirm;
  scatter week1 week2 week3 week4 week5 week6 week7 week8* week1
		  week2 week3 week4 week5 week6 week7 week8 /markersize=5;
run;
quit;

Table 11.3 on page 197.
Model (11.1).
data table11_3a;
   set table11_1long;
	if group = 'B' then do ; a2 = 1; a3 = 0; end;
	if group = 'C' then do ; a2 = 0; a3 = 1; end;
	if group = 'A' then do ; a2 = 0; a3 = 0; end;
run;
proc reg data = table11_3a;
  model score = time  a2 a3 ;
run;
quit;
                        Parameter Estimates
                     Parameter       Standard
Variable     DF       Estimate          Error    t Value    Pr > |t|
Intercept     1       36.84152        3.97120       9.28      <.0001
time          1        4.76438        0.66187       7.20      <.0001
a2            1       -5.62500        3.71472      -1.51      0.1316
a3            1      -12.10937        3.71472      -3.26      0.0013
Model (11.2).
proc glm data = table11_3a;
  model score = time a2 a3 time*a2 time*a3 /solution ss3;
run;
quit;
                                  Standard
Parameter         Estimate           Error    t Value    Pr > |t|
Intercept      29.82142857      5.77401157       5.16      <.0001
time            6.32440476      1.14342467       5.53      <.0001
a2              3.34821429      8.16568547       0.41      0.6823
a3             -0.02232143      8.16568547      -0.00      0.9978
time*a2        -1.99404762      1.61704668      -1.23      0.2191
time*a3        -2.68601190      1.61704668      -1.66      0.0984
Table 11.4 on page 198.
proc reg data = table11_1long;
  by subject;
  model score = time;
  ods output parameterestimates = table11_4 (keep=subject variable estimate stderr) ;
run;
quit;
proc tabulate data=table11_4 ;
  class subject variable  /order=data;
  var estimate stderr;
  table subject='Subject'*sum='',
       variable=''*(estimate stderr )
	 / RTS=20 row=float;
run;
------------------------------------------------------------------------
|                  |        Intercept        |          time           |
|                  |-------------------------+-------------------------|
|                  |  Estimate  |   StdErr   |  Estimate  |   StdErr   |
|------------------+------------+------------+------------+------------|
|Subject           |            |            |            |            |
|------------------|            |            |            |            |
|1                 |       30.00|        7.29|        7.50|        1.44|
|------------------+------------+------------+------------+------------|
|2                 |       15.54|        4.10|        3.21|        0.81|
|------------------+------------+------------+------------+------------|
|3                 |       39.82|        3.21|        6.43|        0.64|
|------------------+------------+------------+------------+------------|
|4                 |       11.61|        3.39|        8.39|        0.67|
|------------------+------------+------------+------------+------------|
|5                 |      100.00|        0.00|        0.00|        0.00|
|------------------+------------+------------+------------+------------|
|6                 |        0.89|        5.30|       11.19|        1.05|
|------------------+------------+------------+------------+------------|
|7                 |       15.36|        4.67|        7.98|        0.92|
|------------------+------------+------------+------------+------------|
|8                 |       25.36|        1.97|        5.89|        0.39|
|------------------+------------+------------+------------+------------|
|9                 |       38.57|        3.52|        7.26|        0.70|
|------------------+------------+------------+------------+------------|
|10                |       61.96|        2.24|        2.62|        0.44|
|------------------+------------+------------+------------+------------|
|11                |       14.46|        5.89|        9.70|        1.17|
|------------------+------------+------------+------------+------------|
|12                |       26.07|        2.15|        2.68|        0.43|
|------------------+------------+------------+------------+------------|
|13                |       48.75|        8.93|        5.00|        1.77|
|------------------+------------+------------+------------+------------|
|14                |       10.18|        3.21|        1.07|        0.64|
|------------------+------------+------------+------------+------------|
|15                |       31.25|        1.95|        2.50|        0.39|
|------------------+------------+------------+------------+------------|
|16                |       34.11|        2.81|        3.81|        0.56|
|------------------+------------+------------+------------+------------|
|17                |       21.07|        2.55|        1.43|        0.51|
|------------------+------------+------------+------------+------------|
|18                |       34.11|        1.16|        0.89|        0.23|
|------------------+------------+------------+------------+------------|
|19                |       32.14|        1.16|        1.61|        0.23|
|------------------+------------+------------+------------+------------|
|20                |       42.32|        3.70|        7.26|        0.73|
|------------------+------------+------------+------------+------------|
|21                |       48.57|        6.14|        7.26|        1.22|
|------------------+------------+------------+------------+------------|
|22                |       24.82|        1.89|        2.26|        0.37|
|------------------+------------+------------+------------+------------|
|23                |       22.32|        1.71|        1.85|        0.34|
|------------------+------------+------------+------------+------------|
|24                |       13.04|        4.49|        6.55|        0.89|
------------------------------------------------------------------------
Table 11.5 on page 198 and table 11.6 on page 199.
proc sql;
  create table table11_5 as
  select distinct table11_4.*, x.a2 as a2, x.a3 as a3
  from table11_4, table11_3a as x
  where table11_4.subject = x.subject;
quit;
proc reg data = table11_5;
  where variable='Intercept';
  model estimate = a2 a3 ;
run;
quit;
                             Analysis of Variance
                                    Sum of           Mean
Source                   DF        Squares         Square    F Value    Pr >
Model                     2       60.19080       30.09540       0.07    0.9367
Error                    21     9632.53747      458.69226
Corrected Total          23     9692.72826

Root MSE             21.41710    R-Square     0.0062
Dependent Mean       30.93006    Adj R-Sq    -0.0884
Coeff Var            69.24365

                        Parameter Estimates
                     Parameter       Standard
Variable     DF       Estimate          Error    t Value    Pr > |t|
Intercept     1       29.82143        7.57209       3.94      0.0008
a2            1        3.34821       10.70855       0.31      0.7576
a3            1       -0.02232       10.70855      -0.00      0.9984
proc reg data = table11_5;
  where variable='time';
  model estimate = a2 a3 ;
run;
quit;
                             Analysis of Variance
                                    Sum of           Mean
Source                   DF        Squares         Square    F Value    Pr > F
Model                     2       31.11920       15.55960       1.67    0.2130
Error                    21      196.11634        9.33887
Corrected Total          23      227.23554

Root MSE              3.05596    R-Square     0.1369
Dependent Mean        4.76438    Adj R-Sq     0.0548
Coeff Var            64.14169

                        Parameter Estimates
                     Parameter       Standard
Variable     DF       Estimate          Error    t Value    Pr > |t|
Intercept     1        6.32440        1.08044       5.85      <.0001
a2            1       -1.99405        1.52798      -1.31      0.2060
a3            1       -2.68601        1.52798      -1.76      0.0933
Table 11.7 on page 207. Row 1 is model (11.2) shown in Table 11.3. Row 2 is Table 11.5 and Table 11.6 shown above. We will focus on GEE models using proc genmod.
GEE, independent:
proc genmod data = table11_3a;
  class  subject;
  model score = time a2 a3 time*a2 time*a3 ;
  repeated subject = subject /type=ind modelse;
run;
quit;
             Analysis Of GEE Parameter Estimates
             Model-Based Standard Error Estimates
                   Standard   95% Confidence
Parameter Estimate    Error       Limits            Z Pr > |Z|
Intercept  29.8214   5.7740  18.5046  41.1383    5.16   <.0001
time        6.3244   1.1434   4.0833   8.5655    5.53   <.0001
a2          3.3482   8.1657 -12.6562  19.3527    0.41   0.6818
a3         -0.0223   8.1657 -16.0268  15.9821   -0.00   0.9978
time*a2    -1.9940   1.6170  -5.1634   1.1753   -1.23   0.2175
time*a3    -2.6860   1.6170  -5.8554   0.4833   -1.66   0.0967
Scale      20.9593                                       .
GEE, equi-correlated:
proc genmod data = table11_3a;
  class  subject;
  model score = time a2 a3 time*a2 time*a3 ;
  repeated subject = subject /type=cs modelse;
run;
quit;
  Analysis Of GEE Parameter Estimates
             Model-Based Standard Error Estimates
                   Standard   95% Confidence
Parameter Estimate    Error       Limits            Z Pr > |Z|
Intercept  29.8214   7.1314  15.8442  43.7986    4.18   <.0001
time        6.3244   0.4958   5.3527   7.2961   12.76   <.0001
a2          3.3482  10.0853 -16.4185  23.1150    0.33   0.7399
a3         -0.0223  10.0853 -19.7891  19.7444   -0.00   0.9982
time*a2    -1.9940   0.7011  -3.3682  -0.6199   -2.84   0.0045
time*a3    -2.6860   0.7011  -4.0602  -1.3119   -3.83   0.0001
Scale      20.9593                                       .
GEE, AR(1)
proc genmod data = table11_3a;
  class  subject;
  model score = time a2 a3 time*a2 time*a3 ;
  repeated subject = subject /type=ar(1) modelse ;
run;
quit;
Analysis Of GEE Parameter Estimates
             Model-Based Standard Error Estimates
                   Standard   95% Confidence
Parameter Estimate    Error       Limits            Z Pr > |Z|
Intercept  33.5377   7.7190  18.4086  48.6667    4.34   <.0001
time        6.0732   0.7137   4.6744   7.4720    8.51   <.0001
a2         -0.3419  10.9164 -21.7376  21.0538   -0.03   0.9750
a3         -6.4735  10.9164 -27.8692  14.9222   -0.59   0.5532
time*a2    -2.1418   1.0093  -4.1200  -0.1636   -2.12   0.0338
time*a3    -2.2353   1.0093  -4.2135  -0.2571   -2.21   0.0268
Scale      21.0786                                       .
GEE, unstructured, algorithm does not converge for more than 5000 iterations. The result therefore does not match with the result in the book which was generated using Stata.
proc genmod data = table11_3a;
  class  subject;
  model score = time a2 a3 time*a2 time*a3 ;
  repeated subject = subject /type=un modelse maxit=5000 converge=.01;
run;
quit;
WARNING: Iteration limit exceeded.

             Analysis Of GEE Parameter Estimates
              Empirical Standard Error Estimates
                   Standard   95% Confidence
Parameter Estimate    Error       Limits            Z Pr > |Z|
Intercept  34.1561   9.4020  15.7284  52.5837    3.63   0.0003
time        6.2530   1.1736   3.9528   8.5533    5.33   <.0001
a2         -8.4854  10.5225 -29.1091  12.1383   -0.81   0.4200
a3         -6.5443  10.0545 -26.2506  13.1621   -0.65   0.5151
time*a2    -1.3303   1.6162  -4.4979   1.8373   -0.82   0.4104
time*a3    -2.6339   1.4638  -5.5029   0.2351   -1.80   0.0720

             Analysis Of GEE Parameter Estimates
             Model-Based Standard Error Estimates
                   Standard   95% Confidence
Parameter Estimate    Error       Limits            Z Pr > |Z|
Intercept  34.1561   6.7387  20.9484  47.3638    5.07   <.0001
time        6.2530   0.0788   6.0986   6.4074   79.37   <.0001
a2         -8.4854   9.5300 -27.1639  10.1931   -0.89   0.3733
a3         -6.5443   9.5300 -25.2228  12.1343   -0.69   0.4923
time*a2    -1.3303   0.1114  -1.5487  -1.1119  -11.94   <.0001
time*a3    -2.6339   0.1114  -2.8523  -2.4155  -23.64   <.0001
Scale      21.3377                                       .
Random Effects:
proc mixed data = table11_3a method=ml;
  class subject;
  model score = time a2 a3 time*a2 time*a3 /solution;
  random intercept /subject=subject type=un;
run;
 Solution for Fixed Effects
                         Standard
Effect       Estimate       Error      DF    t Value    Pr > |t|
Intercept     29.8214      7.0468      21       4.23      0.0004
time           6.3244      0.4630     165      13.66      <.0001
a2             3.3482      9.9657     165       0.34      0.7373
a3           -0.02232      9.9657     165      -0.00      0.9982
time*a2       -1.9940      0.6548     165      -3.05      0.0027
time*a3       -2.6860      0.6548     165      -4.10      <.0001

