2.2 Examples
Table 2.1 on page 18.
data table2_1;
input town country  @@;
datalines;
0 2 1	0
1 3 0	0
2 0 3	1
0 1 1	1
1 1 1	0
1 0 2	2
0 2 1	0
3 1 0	2
1 0 2	0
1 1 3	1
3 1 4	0
1 2 3	.
2 . 0	.
;
run;
proc means data = table2_1 n mean std var;
  var town country;
run;
Variable     N            Mean         Std Dev        Variance
--------------------------------------------------------------
town        26       1.4230769       1.1721118       1.3738462
country     23       0.9130435       0.9001537       0.8102767
--------------------------------------------------------------
Table 2.2 on page 20. In order to use proc genmod to perform our analyses, we have to reshape our data from wide to long. Here is the code for it.
data long;
  set table2_1;
  array varname(2) town country;
  do group = 1 to 2;
  y = varname(group);
  output;
end;
keep y group;
run;
A. Model (2.1)
proc genmod data = long;
  model y = /dist=poisson;
  output out = overall reschi=reschi;
  ods output parameterestimates = col2;
run;
quit;
data col2;
  set col2;
  theta = exp(estimate);
run;
proc print data = col2;
  where parameter = "Intercept";
  var theta;
run;

Obs     theta
 1     1.18367

proc freq data = overall;
tables group*y*reschi /out = model1 list nopercent nocum;
format reschi 6.3;
run;
The FREQ Procedure
group    y    reschi    Frequency
---------------------------------
    1    0    -1.088           6
    1    1    -0.169          10
    1    2     0.750           4
    1    3     1.669           5
    1    4     2.589           1
    2    0    -1.088           9
    2    1    -0.169           8
    2    2     0.750           5
    2    3     1.669           1

Frequency Missing = 3
B. Model (2.2).
proc sort data = long;
  by group;
run;
proc genmod data = long;
  by group;
  model y = /dist=poisson;
  output out = bygroup reschi=reschi;
  ods output parameterestimates = col3;
run;
quit;
data col3;
  set col3;
  theta = exp(estimate);
run;
proc print data = col3;
  where parameter ~="Scale";
var theta;
run;
Obs     theta
 1     1.42308

 3     0.91304
proc freq data = bygroup;
tables group*y*reschi /out=model2 list nopercent nocum;
format reschi 6.3;
run;
The FREQ Procedure
group    y    reschi    Frequency
---------------------------------
    1    0    -1.193           6
    1    1    -0.355          10
    1    2     0.484           4
    1    3     1.322           5
    1    4     2.160           1
    2    0    -0.956           9
    2    1     0.091           8
    2    2     1.138           5
    2    3     2.184           1
Frequency Missing = 3
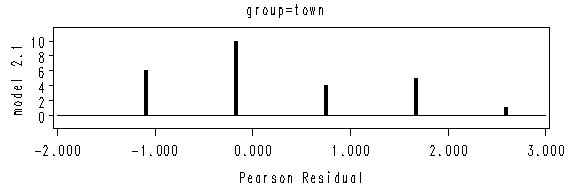
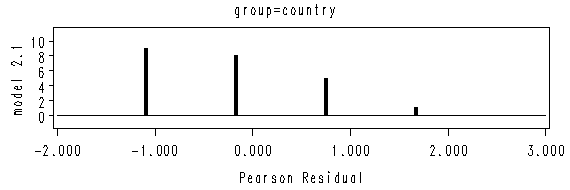
Figure 2.1 on page 20. We will use the two data sets created from the previous example.
proc format;
  value grp 1 = "town"
            2 = "country";
run;

goptions reset=all  hsize=6 vsize=2;
axis1 order = (-2 to 3 by 1) minor = none;
axis2 offset = (1, 1) minor=none label=(a=90 r= 0 'model 2.1');
symbol i = needle w=3 value=none;

proc gplot data = model1;
 by group;
 format group grp.;
 plot count*reschi /vaxis = axis2 haxis= axis1 ;
run;
quit;

axis2 offset = (1, 1) minor=none label=(a=90 r= 0 'model 2.2');
proc gplot data = model2;
 by group;
 format group grp.;
 plot count*reschi /vaxis = axis2 haxis= axis1 ;
run;
quit;
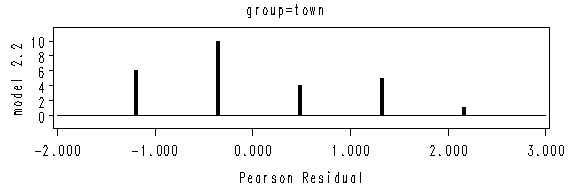
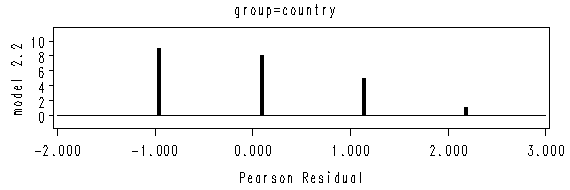
Results on page 21.
For model (2.1):
proc genmod data = long;
  model y = /dist=poisson;
run;
quit;
           Criteria For Assessing Goodness Of Fit
Criterion                 DF           Value        Value/DF
Deviance                  48         56.0335          1.1674
Scaled Deviance           48         56.0335          1.1674
Pearson Chi-Square        48         46.7586          0.9741
Scaled Pearson X2         48         46.7586          0.9741
Log Likelihood                      -48.2199
For model (2.2):
proc genmod data = long;
  class group;
  model y = group/dist=poisson;
run;
quit;
           Criteria For Assessing Goodness Of Fit
Criterion                 DF           Value        Value/DF
Deviance                  47         53.3057          1.1342
Scaled Deviance           47         53.3057          1.1342
Pearson Chi-Square        47         43.6589          0.9289
Scaled Pearson X2         47         43.6589          0.9289
Log Likelihood                      -46.8560
Table 2.3 on page 22.
data table2_3;
  input bage bweight gage gweight;
  label bage = "boys gestational age";
  label bweight = "boys weight";
  label gage = "girls gestational age";
  label gweight = "girls weight";
datalines;
40	2968	40	3317
38	2795	36	2729
40	3163	40	2935
35	2925	38	2754
36	2625	42	3210
37	2847	39	2817
41	3292	40	3126
40	3473	37	2539
37	2628	36	2412
38	3176	38	2991
40	3421	39	2875
38	2975	40	3231
;
run;
options nolabel;
proc means data = table2_3 mean ;
run;
The MEANS Procedure
Variable            Mean
------------------------
bage          38.3333333
bweight          3024.00
gage          38.7500000
gweight          2911.33
------------------------
Figure 2.2 on page 22.
goptions reset = all;
symbol1 v=circle c=black h=1 ;
symbol2 v = dot c=black h=1;
axis1 order = (2000 to 3500 by 500) label=(a=90 'Birth weight') minor = none;
axis2 order = (34 to 42 by 2) offset = (1, 2) minor = none label=('Gestational Age');
proc gplot data = table2_3;
  plot  bweight*bage gweight*gage /overlay vaxis=axis1 haxis=axis2;
run;
quit;
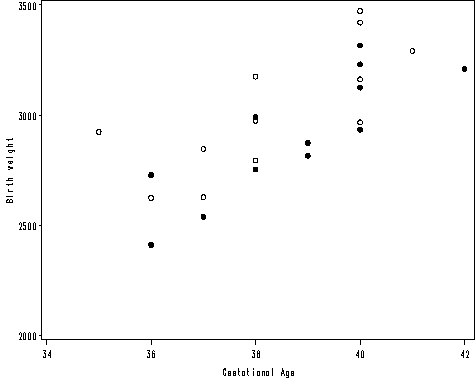
Table 2.4 on page 25. The previous data is in wide format. We need to use the long format of the data to perform regression analysis. Proc reg with option usscp gives the uncorrected sums of squares and cross-products matrix. We also use the by statement to get these for the boys and girls group.
data birthweight;
  input female age weight;
cards;
0 40	2968
0 38	2795
0 40	3163
0 35	2925
0 36	2625
0 37	2847
0 41	3292
0 40	3473
0 37	2628
0 38	3176
0 40	3421
0 38	2975
1 40	3317
1 36	2729
1 40	2935
1 38	2754
1 42	3210
1 39	2817
1 40	3126
1 37	2539
1 36	2412
1 38	2991
1 39	2875
1 40	3231
;
run;
proc reg data = birthweight usscp;
  by female;
  model weight = age ;
run;
quit;
female=0
The REG Procedure
         Uncorrected Sums of Squares and Crossproducts
Variable          Intercept               age            weight
Intercept                12               460             36288
age                     460             17672           1395370
weight                36288           1395370         110623496

female=1
         Uncorrected Sums of Squares and Crossproducts
Variable          Intercept               age            weight
Intercept                12               465             34936
age                     465             18055           1358497
weight                34936           1358497         102575468
Table 2.5 on page 26.
Model (2.6) where variable female is a predictor variable. The intercept for female group a2 is the difference between the Intercept and the coefficient for female: -1610.28254 + (-163.03930) = -1773.3218.
proc reg data = birthweight usccp;
  model weight = age female;
run;
quit;
                        Analysis of Variance
                                    Sum of           Mean
Source                   DF        Squares         Square    F Value    Pr > F
Model                     2        1171103         585551      18.67    <.0001
Error                    21         658771          31370
Corrected Total          23        1829873

Root MSE            177.11588    R-Square     0.6400
Dependent Mean     2967.66667    Adj R-Sq     0.6057
Coeff Var             5.96819

                        Parameter Estimates
                     Parameter       Standard
Variable     DF       Estimate          Error    t Value    Pr > |t|
Intercept     1    -1610.28254      786.07771      -2.05      0.0532
age           1      120.89433       20.46295       5.91      <.0001
female        1     -163.03930       72.80821      -2.24      0.0361
Model (2.7) where we do two separate regression analyses, one on each gender group.
proc reg data = birthweight usccp;
  by female;
  model weight = age ;
run;
quit;
female=0

                Parameter Estimates
                     Parameter       Standard
Variable     DF       Estimate          Error    t Value    Pr > |t|
Intercept     1    -1268.67241     1239.97381      -1.02      0.3304
age           1      111.98276       32.31174       3.47      0.0061

female=1
                        Parameter Estimates
                     Parameter       Standard
Variable     DF       Estimate          Error    t Value    Pr > |t|
Intercept     1    -2141.66667     1016.04886      -2.11      0.0613
age           1      130.40000       26.19428       4.98      0.0006
We can also think this model in terms of interaction of age and female.
proc glm data = birthweight ;
  model weight = age female age*female /solution;
run;
quit;
                                   Standard
Parameter          Estimate           Error    t Value    Pr > |t|
Intercept      -1268.672414     1114.638402      -1.14      0.2685
age              111.982759       29.045695       3.86      0.0010
female          -872.994253     1611.330856      -0.54      0.5940
age*female        18.417241       41.755817       0.44      0.6639
Table 2.6 on page 26.
proc reg data = birthweight usscp;
  model weight = age female;
  output out = mod1 p=p1;
run;
quit;
proc reg data = mod1 usscp;
  by female;
  model weight = age ;
  output out = mod2 p=p2;
run;
quit;
proc print data = mod2 noobs;
run;
female    age    weight       p1         p2
   0       40     2968     3225.49    3210.64
   0       38     2795     2983.70    2986.67
   0       40     3163     3225.49    3210.64
   0       35     2925     2621.02    2650.72
   0       36     2625     2741.91    2762.71
   0       37     2847     2862.81    2874.69
   0       41     3292     3346.38    3322.62
   0       40     3473     3225.49    3210.64
   0       37     2628     2862.81    2874.69
   0       38     3176     2983.70    2986.67
   0       40     3421     3225.49    3210.64
   0       38     2975     2983.70    2986.67
   1       40     3317     3062.45    3074.33
   1       36     2729     2578.87    2552.73
   1       40     2935     3062.45    3074.33
   1       38     2754     2820.66    2813.53
   1       42     3210     3304.24    3335.13
   1       39     2817     2941.56    2943.93
   1       40     3126     3062.45    3074.33
   1       37     2539     2699.77    2683.13
   1       36     2412     2578.87    2552.73
   1       38     2991     2820.66    2813.53
   1       39     2875     2941.56    2943.93
   1       40     3231     3062.45    3074.33
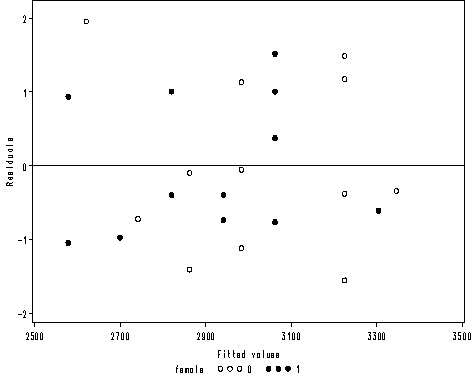
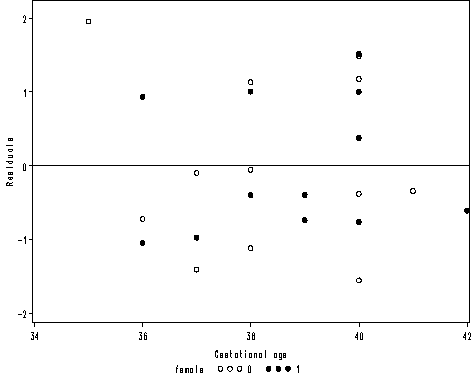
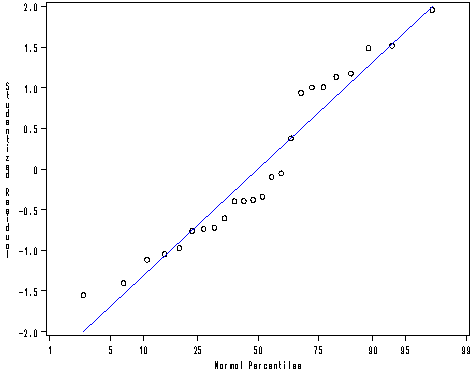
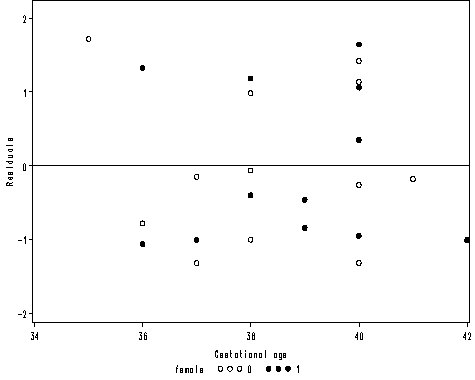
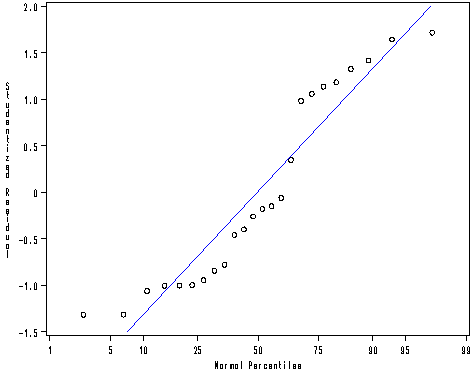
Figure 2.3 on page 27.
symbol1 v=circle c=black h=1 ;
symbol2 v = dot c=black h=1;
axis1 order = (2500 to 3500 by 500) label=('Fitted values') minor = none;
axis2 order = (-2 to 2 by 1) offset = (1, 2) minor = none label=(a=90 'Residuals');
proc gplot data = mod2;
  plot  r*p1 = female /vaxis=axis2 haxis=axis1 vref=0;
run;
quit;
axis1 order = (34 to 42 by 2) label=('Gestational age') minor = none;
axis2 order = (-2 to 2 by 1) offset = (1, 2) minor = none label=(a=90 'Residuals');
proc gplot data = mod2;
  plot  r*age = female /vaxis=axis2 haxis=axis1 vref=0;
run;
quit;
proc univariate data = mod2 noprint;
  probplot r / normal(mu = est sigma=est color=blue l=1 w=1);
run;
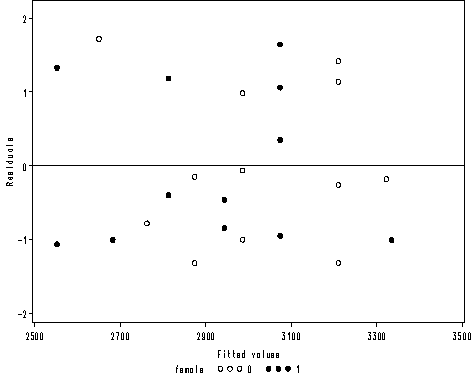
Figure 2.4 on page 28.
symbol1 v=circle c=black h=1 ;
symbol2 v = dot c=black h=1;
axis1 order = (2500 to 3500 by 200) label=('Fitted values') minor = none;
axis2 order = (-2 to 2 by 1) offset = (1, 2) minor = none label=(a=90 'Residuals');
proc gplot data = mod2;
  plot  r2*p2 = female /vaxis=axis2 haxis=axis1 vref=0;
run;
quit;
axis1 order = (34 to 42 by 2) label=('Gestational age') minor = none;
axis2 order = (-2 to 2 by 1) offset = (1, 2) minor = none label=(a=90 'Residuals');
proc gplot data = mod2;
  plot  r2*age = female /vaxis=axis2 haxis=axis1 vref=0;
run;
quit;
proc univariate data = mod2 noprint;
  probplot r2 / normal(mu = est sigma=est color=blue l=1 w=1);
run;

