Table 3.2 on page 52.
data table3_2;
 input age_group $1-5	deaths	population;
 rate = deaths/population*100000;
 lograte = log(rate);
cards;
30-34	1	17742
35-39	5	16554
40-44	5	16059
45-49	12	13083
50-54	25	10784
55-59	38	9645
60-64	54	10706
65-69	65	9933
;
run;
proc print data = table3_2;
run;
       age_
Obs    group    deaths    population      rate     lograte
 1     30-34       1         17742        5.636    1.72924
 2     35-39       5         16554       30.204    3.40798
 3     40-44       5         16059       31.135    3.43834
 4     45-49      12         13083       91.722    4.51876
 5     50-54      25         10784      231.825    5.44598
 6     55-59      38          9645      393.987    5.97632
 7     60-64      54         10706      504.390    6.22335
 8     65-69      65          9933      654.384    6.48369
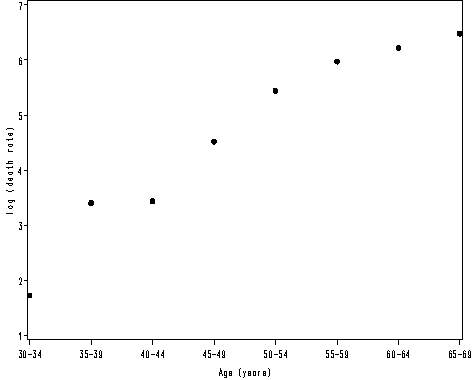
Figure 3.2 on page 52.
goptions reset = all;
symbol2 v = dot c=black h=1;
axis1 label = ('Age (years)');
axis2 label=(a=90 'log (death rate)') minor = none;
proc gplot data = table3_2;
  plot lograte*age_group /haxis=axis1 vaxis= axis2;
run;
quit;

