Table 4.1 on page 57.
data table4_1;
  input lifetime @@;
cards;
1051 1337
1389 1921
1942 2322
3629 4006
4012 4063
4921 5445
5620 5817
5905 5956
6068 6121
6473 7501
7886 8108
8546 8666
8831 9106
9711 9806
10205 10396
10861 11026
11214 11362
11604 11608
11745 11762
11895 12044
13520 13670
14110 14496
15395 16179
17092 17568
17568
;
run;
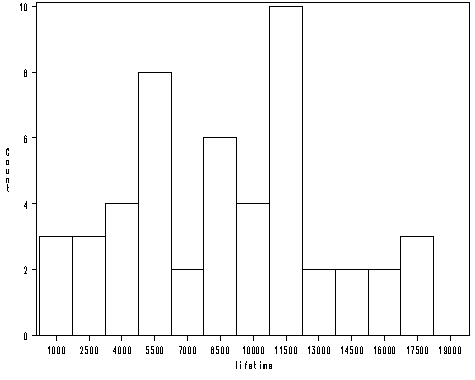
Figure 4.1 on page 58.
goptions reset = all;
symbol2 v = dot c=black h=1;
proc univariate data = table4_1 noprint;
  histogram lifetime / vscale=count midpoints= 1000 to 19000 by 1500 ;
run;
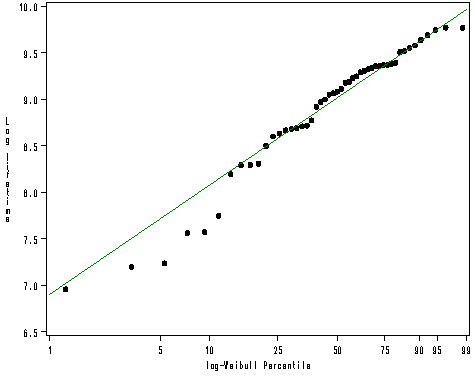
Figure 4.2 on page 58.
goptions reset = all;
symbol2 v = dot c=black h=1;
proc univariate data = table4_1 noprint;
  probplot lifetime  / weibull2(c=2 sigma=est );
run;

Table 4.2 on page 61. We will use proc iml for the calculation.
proc iml;
  use table4_1;
  read all;
  y = lifetime;
  y1 = sum(y);
  y2 = t(y)*y;
  count = 1;
  n = nrow(y);
  theta = y1/n;
  result = j(7, 4, 0);
  do i = 1 to 4;
  result[1,i] = i;
  end;
  do while(count<=4);
          u = 10**6*( -2*n/theta + 2*y2/(theta**3) );
	  up = 10**6*(2*n/(theta*theta) - 6*y2/(theta**4));
	  j = 10**6*(4*n/(theta*theta));
          u_up = u/up;
	  u_j = u/j;
	  result[2,count] = theta;
          result[3,count] = u;
	  result[4,count] = up;
          result[5,count] = -j;
	  result[6,count] = u_up;
	  result[7,count] = -u_j;
          count=count+1;
	  theta = theta - u_up;
   end;
     v = {"Iteration" "theta" "U*10^6" "U'*10^6" "E(U')*10^6" "U/U'" "U/E(U')" };
     print result[rowname=v label=''];
quit;
Iteration          1         2         3         4
theta      8805.6939 9633.7774 9875.8983   9892.11
U*10^6     2915.7507 553.01898 32.739779 0.1338316
U'*10^6    -3.521083 -2.284061 -2.019514 -2.003028
E(U')*10^6  -2.52772 -2.111849 -2.009569 -2.002987
U/U'       -828.0835 -242.1209 -16.21171 -0.066815
U/E(U')     -1153.51 -261.8648 -16.29194 -0.066816
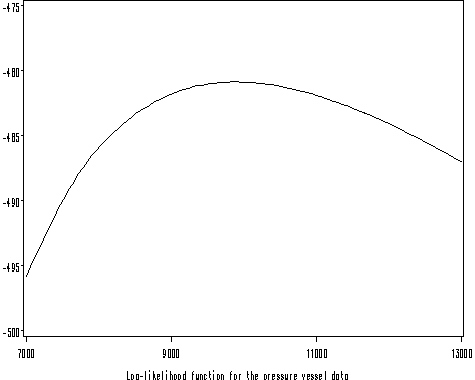
Figure 4.4 on page 62.
proc iml;
  use table4_1;
  read all;
  y = lifetime;
  y2 = t(y)*y;
  n = nrow(y);
  theta = y1/n;
  result = j(10, 2, 0);
  do i = 1 to 10;
      theta = 2000/3*i + 19000/3;
	  result[i, 1] = sum(log(y)) + n*(log(2) - 2*log(theta)) - y2/(theta*theta);
      result[i, 2] = theta;
  end;
     create c var {logl theta} ;
	 append from result;
quit;
axis1 order = (-500 to -475 by 5) minor = none label=('');
axis2 order = (7000 to 13000 by 2000) minor = none label =('');
footnote 'Log-likelihood function for the pressure vessel data';
symbol i = spline v = none;
proc gplot data = c ;
  plot logl*theta /vaxis=axis1 haxis=axis2;
run;
quit;
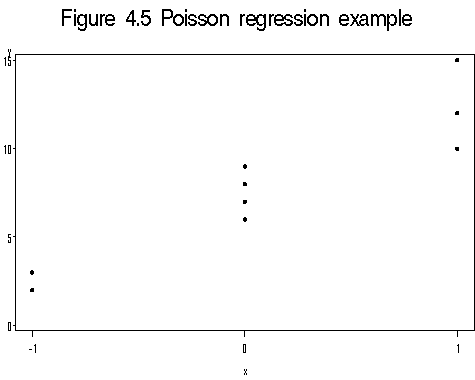
Table 4.3 and Figure 4.4 on page 65.
data table4_3;
  input y x;
cards;
2	-1
3	-1
6	0
7	0
8	0
9	0
10	1
12	1
15	1
;
run;

goptions reset = all;
symbol v = dot h=.5;
axis1 order = (0 to 15 by 5) minor = none;
axis2 order =(-1 to 1 by 1) minor = none offset=(4, 4);
title 'Figure 4.5 Poisson regression example';
proc gplot data = table4_3;
  plot y*x /vaxis = axis1 haxis=axis2;
run;
quit;
Table 4.4. This involves some matrix calculations, so we will use proc iml.
proc iml;
  use table4_3;
  read all;
  n = nrow(y);
  x1 = j(n, 1, 1);
  xall = x1 || x;
  xwx = j(2,2,1);
  xwz = j(2,1,1);
  /*getting the initial values for beta from
  ordinary least square regression*/
 * b = inv((t(xall)*xall))*(t(xall)*y);
  b = {7,5};
  m = 1;
  do while (m <=4);
  mydenom = (xall*b)##(-1);
  xwx[1,1] = sum(mydenom);
  xwx[1,2] = sum(x#mydenom);
  xwx[2,1] = xwx[1,2];
  xwx[2,2] = sum(x#x#mydenom);
  xwz[1,1] = sum(y#mydenom);
  xwz[2,1] = sum(x#y#mydenom);
  print m b[format=7.5];
  b = inv(xwx)*xwz;
  m = m + 1;
  end;
 quit;
     M       B
     1 7.00000
       5.00000

     M       B
     2 7.45139
       4.93750

     M       B
     3 7.45163
       4.93531

     M       B
     4 7.45163
       4.93530


