You can download the dataset for this chapter by clicking here: https://stats.idre.ucla.edu/wp-content/uploads/2016/02/sfa.sas7bdat.
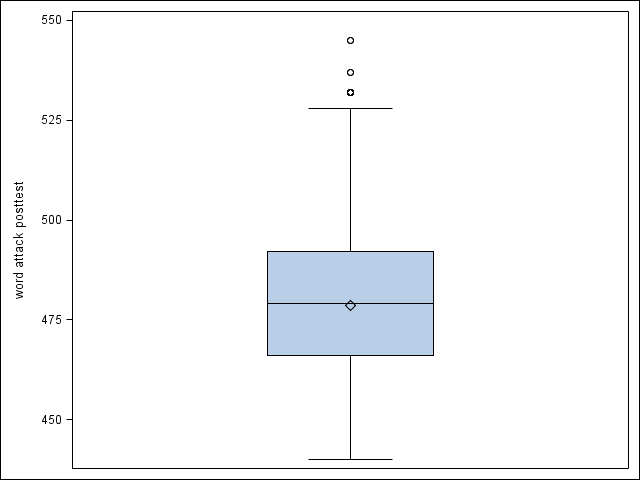
Descriptive statistics for the variable wattack. Notice the floor effect which cannot be resolved by a straightforward transformation. (Note these analyses are not shown in the text.)
proc univariate data= sfa;
   var wattack;
run;


                                     The UNIVARIATE Procedure
                            Variable:  wattack  (word attack posttest)

                                             Moments

                 N                        2334    Sum Weights               2334
                 Mean                478.51928    Sum Observations       1116864
                 Std Deviation      19.8787218    Variance             395.16358
                 Skewness           -0.1655814    Kurtosis            -0.1967402
                 Uncorrected SS      535362874    Corrected SS        921916.632
                 Coeff Variation    4.15421543    Std Error Mean      0.41146986


                                    Basic Statistical Measures

                          Location                    Variability

                      Mean     478.5193     Std Deviation           19.87872
                      Median   479.0000     Variance               395.16358
                      Mode     440.0000     Range                  105.00000
                                            Interquartile Range     26.00000


                                    Tests for Location: Mu0=0

                         Test           -Statistic-    -----p Value------

                         Student's t    t  1162.951    Pr > |t|    <.0001
                         Sign           M      1167    Pr >= |M|   <.0001
                         Signed Rank    S   1362473    Pr >= |S|   <.0001


                                     Quantiles (Definition 5)

                                      Quantile      Estimate

                                      100% Max           545
                                      99%                525
                                      95%                509
                                      90%                503
                                      75% Q3             492
                                      50% Median         479
                                      25% Q1             466
                                      10%                449
                                      5%                 440
                                      1%                 440
                                      0% Min             440


                                     The UNIVARIATE Procedure
                            Variable:  wattack  (word attack posttest)

                                       Extreme Observations

                               ----Lowest----        ----Highest---

                               Value      Obs        Value      Obs

                                 440     2327          532     1994
                                 440     2323          537     1008
                                 440     2322          537     1442
                                 440     2320          545     1640
                                 440     2312          545     1847


proc sgplot data=sfa;
   vbox wattack;
run;
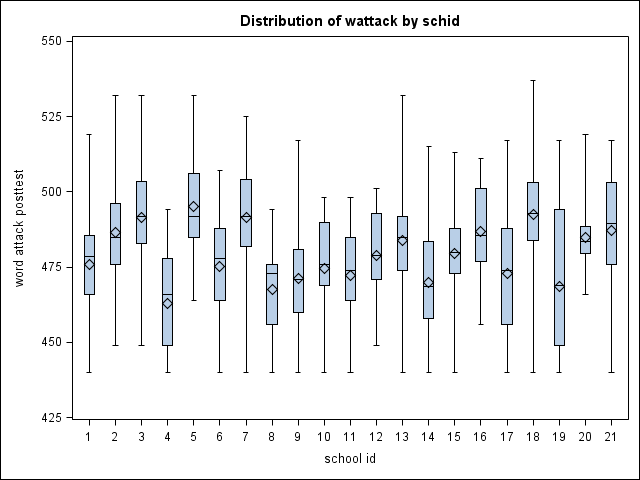
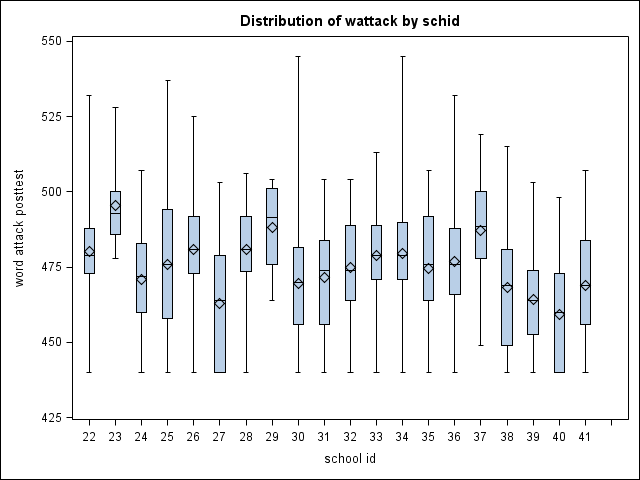
Descriptive analyses of wattack by school (schid). Note the floor effect is present in most schools. (Not shown in text.)
proc means data=sfa;
   class schid;
   vars wattack;
run;

                                       The MEANS Procedure

                         Analysis Variable : wattack word attack posttest

                      N
      school id     Obs       N            Mean         Std Dev         Minimum         Maximum

              1      52      52     475.7307692      16.1598818     440.0000000     519.0000000

              2     116     116     486.6034483      15.3106268     449.0000000     532.0000000

              3      68      68     491.3676471      16.8469001     449.0000000     532.0000000

              4      34      34     462.9117647      16.5517877     440.0000000     494.0000000

              5      47      47     495.0851064      14.9678348     464.0000000     532.0000000

              6      87      87     475.1149425      18.0776267     440.0000000     507.0000000

              7      83      83     491.5301205      16.1911880     440.0000000     525.0000000

              8      22      22     467.5000000      13.9412031     440.0000000     494.0000000

              9      95      95     471.1052632      17.6962995     440.0000000     517.0000000

             10      27      27     474.5555556      19.0774400     440.0000000     498.0000000

             11      43      43     472.1860465      16.6879709     440.0000000     498.0000000

             12      27      27     478.9629630      13.2185228     449.0000000     501.0000000

             13      62      62     483.8709677      14.5641418     440.0000000     532.0000000

             14      36      36     469.8888889      17.1876663     440.0000000     515.0000000

             15      54      54     479.5555556      15.9712793     440.0000000     513.0000000

             16      36      36     486.7500000      14.8696719     456.0000000     511.0000000

             17      41      41     472.9512195      22.7199815     440.0000000     517.0000000

             18     109     109     492.5963303      17.5209500     440.0000000     537.0000000

             19      23      23     468.7391304      23.8560406     440.0000000     517.0000000

             20      20      20     484.7500000      11.1349379     466.0000000     519.0000000

             21     134     134     487.2313433      19.0700782     440.0000000     517.0000000

             22     106     106     480.2735849      18.0182622     440.0000000     532.0000000

             23      36      36     495.3333333      12.1161050     478.0000000     528.0000000


                                       The MEANS Procedure

                         Analysis Variable : wattack word attack posttest

                      N
      school id     Obs       N            Mean         Std Dev         Minimum         Maximum

             24      48      48     470.7708333      17.1504477     440.0000000     507.0000000

             25      52      52     476.0192308      23.5134425     440.0000000     537.0000000

             26      66      66     480.9696970      18.0264504     440.0000000     525.0000000

             27      41      41     462.9512195      19.4601532     440.0000000     503.0000000

             28      56      56     480.8392857      15.7823570     440.0000000     506.0000000

             29      10      10     488.1000000      15.1983186     464.0000000     504.0000000

             30      24      24     469.6250000      22.4185725     440.0000000     545.0000000

             31      61      61     471.5245902      17.9662708     440.0000000     504.0000000

             32      58      58     474.7241379      17.7722365     440.0000000     504.0000000

             33      41      41     478.8780488      19.1992124     440.0000000     513.0000000

             34      79      79     479.4177215      19.1850687     440.0000000     545.0000000

             35      57      57     474.4210526      18.7349438     440.0000000     507.0000000

             36      85      85     476.9294118      20.6321457     440.0000000     532.0000000

             37      58      58     487.1896552      16.9275618     449.0000000     519.0000000

             38      37      37     468.1891892      21.3174913     440.0000000     515.0000000

             39      36      36     464.3611111      16.3255326     440.0000000     503.0000000

             40     107     107     459.2523364      16.9739498     440.0000000     498.0000000

             41      60      60     468.9333333      17.3536170     440.0000000     507.0000000

proc boxplot data=sfa;
   plot wattack*schid;
run;
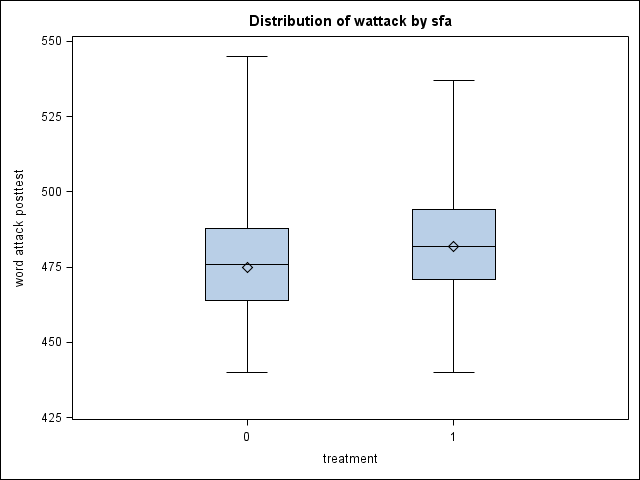
Descriptive analyses of wattack by experimental condition (sfa). (Not shown in text.)
proc univariate data= sfa;
   class sfa;
   var wattack;
run;


                                     The UNIVARIATE Procedure
                            Variable:  wattack  (word attack posttest)
                                             sfa = 0

                                             Moments

                 N                        1118    Sum Weights               1118
                 Mean               474.824687    Sum Observations        530854
                 Std Deviation      20.0523853    Variance            402.098155
                 Skewness            -0.020796    Kurtosis            -0.1872213
                 Uncorrected SS      252511728    Corrected SS        449143.639
                 Coeff Variation    4.22311346    Std Error Mean      0.59971531


                                    Basic Statistical Measures

                          Location                    Variability

                      Mean     474.8247     Std Deviation           20.05239
                      Median   476.0000     Variance               402.09815
                      Mode     440.0000     Range                  105.00000
                                            Interquartile Range     24.00000


                                    Tests for Location: Mu0=0

                         Test           -Statistic-    -----p Value------

                         Student's t    t  791.7501    Pr > |t|    <.0001
                         Sign           M       559    Pr >= |M|   <.0001
                         Signed Rank    S  312760.5    Pr >= |S|   <.0001


                                     Quantiles (Definition 5)

                                      Quantile      Estimate

                                      100% Max           545
                                      99%                525
                                      95%                506
                                      90%                500
                                      75% Q3             488
                                      50% Median         476
                                      25% Q1             464
                                      10%                440
                                      5%                 440
                                      1%                 440
                                      0% Min             440


                                     The UNIVARIATE Procedure
                            Variable:  wattack  (word attack posttest)
                                             sfa = 0

                                       Extreme Observations

                               ----Lowest----        ----Highest---

                               Value      Obs        Value      Obs

                                 440     2327          532     1282
                                 440     2323          532     1994
                                 440     2322          537     1442
                                 440     2320          545     1640
                                 440     2312          545     1847


                                     The UNIVARIATE Procedure
                            Variable:  wattack  (word attack posttest)
                                             sfa = 1

                                             Moments

                 N                        1216    Sum Weights               1216
                 Mean               481.916118    Sum Observations        586010
                 Std Deviation       19.105112    Variance            365.005304
                 Skewness           -0.2810488    Kurtosis            -0.0585321
                 Uncorrected SS      282851146    Corrected SS        443481.444
                 Coeff Variation     3.9644061    Std Error Mean      0.54787666


                                    Basic Statistical Measures

                          Location                    Variability

                      Mean     481.9161     Std Deviation           19.10511
                      Median   482.0000     Variance               365.00530
                      Mode     440.0000     Range                   97.00000
                                            Interquartile Range     23.00000


                                    Tests for Location: Mu0=0

                         Test           -Statistic-    -----p Value------

                         Student's t    t  879.6069    Pr > |t|    <.0001
                         Sign           M       608    Pr >= |M|   <.0001
                         Signed Rank    S    369968    Pr >= |S|   <.0001


                                     Quantiles (Definition 5)

                                      Quantile      Estimate

                                      100% Max           537
                                      99%                522
                                      95%                511
                                      90%                506
                                      75% Q3             494
                                      50% Median         482
                                      25% Q1             471
                                      10%                456
                                      5%                 440
                                      1%                 440
                                      0% Min             440


                                     The UNIVARIATE Procedure
                            Variable:  wattack  (word attack posttest)
                                             sfa = 1

                                       Extreme Observations

                               ----Lowest----        ----Highest---

                               Value      Obs        Value      Obs

                                 440     1183          532      199
                                 440     1169          532      310
                                 440     1160          532      739
                                 440     1147          532     1010
                                 440     1130          537     1008

 proc sort data = sfa;
   by sfa;
run;

proc boxplot data=sfa;
   plot wattack*sfa;
run;
Model #1 from Table 7.1 on page 114. Note that the estimates of the fixed effects are not identical to those in the text, but are very similar.
proc sort data=sfa;
   by schid ;
run;

proc mixed data=sfa method=reml;
   class schid;
   model wattack = /solution ;
   random schid;
run;


                                       The Mixed Procedure

                                        Model Information

                      Data Set                     WORK.SFA
                      Dependent Variable           wattack
                      Covariance Structure         Variance Components
                      Estimation Method            REML
                      Residual Variance Method     Profile
                      Fixed Effects SE Method      Model-Based
                      Degrees of Freedom Method    Containment


                                     Class Level Information

                        Class    Levels    Values

                        schid        41    1 2 3 4 5 6 7 8 9 10 11 12 13
                                           14 15 16 17 18 19 20 21 22 23
                                           24 25 26 27 28 29 30 31 32 33
                                           34 35 36 37 38 39 40 41


                                           Dimensions

                               Covariance Parameters             2
                               Columns in X                      1
                               Columns in Z                     41
                               Subjects                          1
                               Max Obs Per Subject            2334


                                     Number of Observations

                           Number of Observations Read            2334
                           Number of Observations Used            2334
                           Number of Observations Not Used           0


                                        Iteration History

                   Iteration    Evaluations    -2 Res Log Like       Criterion

                           0              1     20578.22898221
                           1              3     20147.79602987      0.00000807
                           2              1     20147.72782562      0.00000009
                           3              1     20147.72708485      0.00000000


                                    Convergence criteria met.

                                       The Mixed Procedure

                                      Covariance Parameter
                                            Estimates

                                      Cov Parm     Estimate

                                      schid         79.1290
                                      Residual       314.19


                                         Fit Statistics

                              -2 Res Log Likelihood         20147.7
                              AIC (smaller is better)       20151.7
                              AICC (smaller is better)      20151.7
                              BIC (smaller is better)       20155.2


                                    Solution for Fixed Effects

                                          Standard
                 Effect       Estimate       Error      DF    t Value    Pr > |t|

                 Intercept      477.54      1.4508      40     329.15      <.0001
Model #2 from Table 7.1 on page 114. Note that the estimates of the fixed effects are not identical to those in the text, but are very similar.
proc mixed data=sfa method=reml;
   class schid;
   model wattack = sfa /solution ;
   random schid;
run;

                                       The Mixed Procedure

                                        Model Information

                      Data Set                     WORK.SFA
                      Dependent Variable           wattack
                      Covariance Structure         Variance Components
                      Estimation Method            REML
                      Residual Variance Method     Profile
                      Fixed Effects SE Method      Model-Based
                      Degrees of Freedom Method    Containment


                                     Class Level Information

                        Class    Levels    Values

                        schid        41    1 2 3 4 5 6 7 8 9 10 11 12 13
                                           14 15 16 17 18 19 20 21 22 23
                                           24 25 26 27 28 29 30 31 32 33
                                           34 35 36 37 38 39 40 41


                                           Dimensions

                               Covariance Parameters             2
                               Columns in X                      2
                               Columns in Z                     41
                               Subjects                          1
                               Max Obs Per Subject            2334


                                     Number of Observations

                           Number of Observations Read            2334
                           Number of Observations Used            2334
                           Number of Observations Not Used           0


                                        Iteration History

                   Iteration    Evaluations    -2 Res Log Like       Criterion

                           0              1     20501.48291319
                           1              2     20141.47629690      0.00000008
                           2              1     20141.47565212      0.00000000


                                    Convergence criteria met.


                                       The Mixed Procedure

                                      Covariance Parameter
                                            Estimates

                                      Cov Parm     Estimate

                                      schid         75.6802
                                      Residual       314.23


                                         Fit Statistics

                              -2 Res Log Likelihood         20141.5
                              AIC (smaller is better)       20145.5
                              AICC (smaller is better)      20145.5
                              BIC (smaller is better)       20148.9


                                    Solution for Fixed Effects

                                          Standard
                 Effect       Estimate       Error      DF    t Value    Pr > |t|

                 Intercept      475.30      2.0345      39     233.62      <.0001
                 sfa            4.3662      2.8437    2293       1.54      0.1248


                                  Type 3 Tests of Fixed Effects

                                        Num     Den
                          Effect         DF      DF    F Value    Pr > F

                          sfa             1    2293       2.36    0.1248
Model #3 from Table 7.1 on page 114. The variable sch_ppvt is the within-school average of ppvt based on the full sample, rather than the subsample analyzed here, see footnote 15 on page 127.
proc mixed data=sfa method=reml;
   class schid;
   model wattack = sfa sch_ppvt /solution ;
   random schid;
run;


                                       The Mixed Procedure

                                        Model Information

                      Data Set                     WORK.SFA
                      Dependent Variable           wattack
                      Covariance Structure         Variance Components
                      Estimation Method            REML
                      Residual Variance Method     Profile
                      Fixed Effects SE Method      Model-Based
                      Degrees of Freedom Method    Containment


                                     Class Level Information

                        Class    Levels    Values

                        schid        41    1 2 3 4 5 6 7 8 9 10 11 12 13
                                           14 15 16 17 18 19 20 21 22 23
                                           24 25 26 27 28 29 30 31 32 33
                                           34 35 36 37 38 39 40 41


                                           Dimensions

                               Covariance Parameters             2
                               Columns in X                      3
                               Columns in Z                     41
                               Subjects                          1
                               Max Obs Per Subject            2334


                                     Number of Observations

                           Number of Observations Read            2334
                           Number of Observations Used            2334
                           Number of Observations Not Used           0


                                        Iteration History

                   Iteration    Evaluations    -2 Res Log Like       Criterion

                           0              1     20354.02113840
                           1              2     20127.21885957      0.00000001


                                    Convergence criteria met.


                                       The Mixed Procedure

                                      Covariance Parameter
                                            Estimates

                                      Cov Parm     Estimate

                                      schid         49.2429
                                      Residual       314.18


                                         Fit Statistics

                              -2 Res Log Likelihood         20127.2
                              AIC (smaller is better)       20131.2
                              AICC (smaller is better)      20131.2
                              BIC (smaller is better)       20134.6


                                    Solution for Fixed Effects

                                          Standard
                 Effect       Estimate       Error      DF    t Value    Pr > |t|

                 Intercept      419.81     12.6327      38      33.23      <.0001
                 sfa            3.5695      2.3537    2293       1.52      0.1295
                 sch_ppvt       0.6229      0.1407    2293       4.43      <.0001


                                  Type 3 Tests of Fixed Effects

                                        Num     Den
                          Effect         DF      DF    F Value    Pr > F

                          sfa             1    2293       2.30    0.1295
                          sch_ppvt        1    2293      19.61    <.0001
Model #3 using the within-school averages of prior ppvt score (new variable schavgppvt) from the analytic subsample instead of sch_ppvt. (Not shown in text, this analysis is mentioned in footnote 15 on page 127.)
proc sql ;
   create table sfa as
   select *, mean(ppvt) as schavgppvt
   from sfa
   group by schid;
quit;

proc mixed data=sfa method=reml;
   class schid;
   model wattack = sfa schavgppvt /solution ;
   random schid;
run;

                                       The Mixed Procedure

                                        Model Information

                      Data Set                     WORK.SFA
                      Dependent Variable           wattack
                      Covariance Structure         Variance Components
                      Estimation Method            REML
                      Residual Variance Method     Profile
                      Fixed Effects SE Method      Model-Based
                      Degrees of Freedom Method    Containment


                                     Class Level Information

                        Class    Levels    Values

                        schid        41    1 2 3 4 5 6 7 8 9 10 11 12 13
                                           14 15 16 17 18 19 20 21 22 23
                                           24 25 26 27 28 29 30 31 32 33
                                           34 35 36 37 38 39 40 41


                                           Dimensions

                               Covariance Parameters             2
                               Columns in X                      3
                               Columns in Z                     41
                               Subjects                          1
                               Max Obs Per Subject            2334


                                     Number of Observations

                           Number of Observations Read            2334
                           Number of Observations Used            2334
                           Number of Observations Not Used           0


                                        Iteration History

                   Iteration    Evaluations    -2 Res Log Like       Criterion

                           0              1     20338.04927507
                           1              2     20126.12066409      0.00000013
                           2              1     20126.11963668      0.00000000


                                    Convergence criteria met.


                                       The Mixed Procedure

                                      Covariance Parameter
                                            Estimates

                                      Cov Parm     Estimate

                                      schid         47.4401
                                      Residual       314.19


                                         Fit Statistics

                              -2 Res Log Likelihood         20126.1
                              AIC (smaller is better)       20130.1
                              AICC (smaller is better)      20130.1
                              BIC (smaller is better)       20133.5


                                   Solution for Fixed Effects

                                          Standard
                Effect        Estimate       Error      DF    t Value    Pr > |t|

                Intercept       421.60     11.6898      39      36.07      <.0001
                sfa             3.2159      2.3231    2292       1.38      0.1664
                schavgppvt      0.6024      0.1299    2292       4.64      <.0001


                                  Type 3 Tests of Fixed Effects

                                        Num     Den
                         Effect          DF      DF    F Value    Pr > F

                         sfa              1    2292       1.92    0.1664
                         schavgppvt       1    2292      21.49    <.0001
The following models show various ways of controlling for individual- and school-level ppvt. None of the models shown below are displayed in the text.
Controlling for individual-level ppvt, deviated from the grand mean (new variable ppvt_devgm).
proc means data=sfa;
   vars ppvt;
run;


                                       The MEANS Procedure

                               Analysis Variable : ppvt ppvt pretest

                  N            Mean         Std Dev         Minimum         Maximum

               2334      90.4005998      15.0008207      40.0000000     144.0000000

data sfa;
   set sfa;
   ppvt_devgm = ppvt-90.4005998;
run;

proc mixed data=sfa method=reml;
   class schid;
   model wattack = sfa ppvt_devgm /solution ;
   random schid;
run;

                                       The Mixed Procedure

                                        Model Information

                      Data Set                     WORK.SFA
                      Dependent Variable           wattack
                      Covariance Structure         Variance Components
                      Estimation Method            REML
                      Residual Variance Method     Profile
                      Fixed Effects SE Method      Model-Based
                      Degrees of Freedom Method    Containment


                                     Class Level Information

                        Class    Levels    Values

                        schid        41    1 2 3 4 5 6 7 8 9 10 11 12 13
                                           14 15 16 17 18 19 20 21 22 23
                                           24 25 26 27 28 29 30 31 32 33
                                           34 35 36 37 38 39 40 41


                                           Dimensions

                               Covariance Parameters             2
                               Columns in X                      3
                               Columns in Z                     41
                               Subjects                          1
                               Max Obs Per Subject            2334


                                     Number of Observations

                           Number of Observations Read            2334
                           Number of Observations Used            2334
                           Number of Observations Not Used           0


                                        Iteration History

                   Iteration    Evaluations    -2 Res Log Like       Criterion

                           0              1     20110.44100068
                           1              2     19862.58772768      0.00000014
                           2              1     19862.58665957      0.00000000


                                    Convergence criteria met.


                                       The Mixed Procedure

                                      Covariance Parameter
                                            Estimates

                                      Cov Parm     Estimate

                                      schid         47.8823
                                      Residual       279.73


                                         Fit Statistics

                              -2 Res Log Likelihood         19862.6
                              AIC (smaller is better)       19866.6
                              AICC (smaller is better)      19866.6
                              BIC (smaller is better)       19870.0


                                   Solution for Fixed Effects

                                          Standard
                Effect        Estimate       Error      DF    t Value    Pr > |t|

                Intercept       475.91      1.6454      39     289.24      <.0001
                sfa             3.4402      2.3006    2292       1.50      0.1350
                ppvt_devgm      0.4852     0.02781    2292      17.45      <.0001


                                  Type 3 Tests of Fixed Effects

                                        Num     Den
                         Effect          DF      DF    F Value    Pr > F

                         sfa              1    2292       2.24    0.1350
                         ppvt_devgm       1    2292     304.38    <.0001
Controlling for individual-level ppvt by including deviations of individual scores from school-average scores (new variable ppvt_devsm) and school-average scores from the grand mean (new variable schavgppvt_devgm).
data sfa;
   set sfa;
   ppvt_devsm = ppvt-schavgppvt;
   schavgppvt_devgm = schavgppvt-90.4006;
run;

proc mixed data=sfa method=reml;
   class schid;
   model wattack = sfa ppvt_devsm schavgppvt_devgm  /solution ;
   random schid;
run;


                                       The Mixed Procedure

                                        Model Information

                      Data Set                     WORK.SFA
                      Dependent Variable           wattack
                      Covariance Structure         Variance Components
                      Estimation Method            REML
                      Residual Variance Method     Profile
                      Fixed Effects SE Method      Model-Based
                      Degrees of Freedom Method    Containment


                                     Class Level Information

                        Class    Levels    Values

                        schid        41    1 2 3 4 5 6 7 8 9 10 11 12 13
                                           14 15 16 17 18 19 20 21 22 23
                                           24 25 26 27 28 29 30 31 32 33
                                           34 35 36 37 38 39 40 41


                                           Dimensions

                               Covariance Parameters             2
                               Columns in X                      4
                               Columns in Z                     41
                               Subjects                          1
                               Max Obs Per Subject            2334


                                     Number of Observations

                           Number of Observations Read            2334
                           Number of Observations Used            2334
                           Number of Observations Not Used           0


                                        Iteration History

                   Iteration    Evaluations    -2 Res Log Like       Criterion

                           0              1     20109.23720784
                           1              2     19863.92245580      0.00000018
                           2              1     19863.92105409      0.00000000


                                    Convergence criteria met.


                                       The Mixed Procedure

                                      Covariance Parameter
                                            Estimates

                                      Cov Parm     Estimate

                                      schid         48.1678
                                      Residual       279.72


                                         Fit Statistics

                              -2 Res Log Likelihood         19863.9
                              AIC (smaller is better)       19867.9
                              AICC (smaller is better)      19867.9
                              BIC (smaller is better)       19871.3


                                   Solution for Fixed Effects

                                             Standard
             Effect              Estimate       Error      DF    t Value    Pr > |t|

             Intercept             476.06      1.6581      39     287.11      <.0001
             sfa                   3.1892      2.3223    2291       1.37      0.1698
             ppvt_devsm            0.4795     0.02847    2291      16.84      <.0001
             schavgppvt_devgm      0.6030      0.1299    2291       4.64      <.0001


                                  Type 3 Tests of Fixed Effects

                                           Num     Den
                      Effect                DF      DF    F Value    Pr > F

                      sfa                    1    2291       1.89    0.1698
                      ppvt_devsm             1    2291     283.58    <.0001
                      schavgppvt_devgm       1    2291      21.56    <.0001
Controlling for school-average ppvt deviated from the grand mean (schavgppvt_devgm).
proc mixed data=sfa method=reml;
   class schid;
   model wattack = sfa schavgppvt_devgm  /solution ;
   random schid;
run;


                                       The Mixed Procedure

                                        Model Information

                      Data Set                     WORK.SFA
                      Dependent Variable           wattack
                      Covariance Structure         Variance Components
                      Estimation Method            REML
                      Residual Variance Method     Profile
                      Fixed Effects SE Method      Model-Based
                      Degrees of Freedom Method    Containment


                                     Class Level Information

                        Class    Levels    Values

                        schid        41    1 2 3 4 5 6 7 8 9 10 11 12 13
                                           14 15 16 17 18 19 20 21 22 23
                                           24 25 26 27 28 29 30 31 32 33
                                           34 35 36 37 38 39 40 41


                                           Dimensions

                               Covariance Parameters             2
                               Columns in X                      3
                               Columns in Z                     41
                               Subjects                          1
                               Max Obs Per Subject            2334


                                     Number of Observations

                           Number of Observations Read            2334
                           Number of Observations Used            2334
                           Number of Observations Not Used           0


                                        Iteration History

                   Iteration    Evaluations    -2 Res Log Like       Criterion

                           0              1     20338.04927507
                           1              2     20126.12066409      0.00000013
                           2              1     20126.11963668      0.00000000


                                    Convergence criteria met.


                                       The Mixed Procedure

                                      Covariance Parameter
                                            Estimates

                                      Cov Parm     Estimate

                                      schid         47.4401
                                      Residual       314.19


                                         Fit Statistics

                              -2 Res Log Likelihood         20126.1
                              AIC (smaller is better)       20130.1
                              AICC (smaller is better)      20130.1
                              BIC (smaller is better)       20133.5


                                   Solution for Fixed Effects

                                             Standard
             Effect              Estimate       Error      DF    t Value    Pr > |t|

             Intercept             476.06      1.6584      39     287.06      <.0001
             sfa                   3.2159      2.3231    2292       1.38      0.1664
             schavgppvt_devgm      0.6024      0.1299    2292       4.64      <.0001


                                  Type 3 Tests of Fixed Effects

                                           Num     Den
                      Effect                DF      DF    F Value    Pr > F

                      sfa                    1    2292       1.92    0.1664
                      schavgppvt_devgm       1    2292      21.49    <.0001