You can download the dataset for this chapter by clicking here: https://stats.idre.ucla.edu/wp-content/uploads/2016/02/dynarski.sas7bdat.
Descriptive statistics and cross-tabulations for key variables. (Not shown in text.)
proc surveymeans data=dynarski;
   cluster hhid;
   var coll;
   weight wt88;
run;


                                    The SURVEYMEANS Procedure

                                           Data Summary

                               Number of Clusters              3123
                               Number of Observations          3986
                               Sum of Weights            1302933368


                                           Statistics

                                                                                   Std Error
     Variable    Label                                     N            Mean         of Mean

     coll        Full-time college by age 23            3986        0.494350        0.010515


                                           Statistics

                                Variable       95% CL for Mean

                                coll        0.47373264 0.51496809


proc freq data=dynarski;
   table fatherdec*yearsr;
run;


                                        The FREQ Procedure

                                   Table of fatherdec by yearsr

              fatherdec(Father deceased by age 18)
                                yearsr(Year in which a senior)

              Frequency
              Percent
              Row Pct
              Col Pct                 79       80       81       82       83   Total

              Father not decea      892      986      867      828      222     3795
              sed                 22.38    24.74    21.75    20.77     5.57    95.21
                                  23.50    25.98    22.85    21.82     5.85
                                  95.61    95.73    94.34    95.28    94.47

              Father deceased        41       44       52       41       13      191
                                   1.03     1.10     1.30     1.03     0.33     4.79
                                  21.47    23.04    27.23    21.47     6.81
                                   4.39     4.27     5.66     4.72     5.53

              Total                 933     1030      919      869      235     3986
                                  23.41    25.84    23.06    21.80     5.90   100.00
(a) Direct Estimate shown in Table 8.1 on page 143. The means of coll are shown in the rows labeled _subpop_3 and _subpop_4. This output also replicates part of the table of variable means and differences from the Dynarski article referenced in the chapter (not shown in the text).
proc sort data=dynarski;
   by fatherdec offer;
run;

proc surveymeans data=dynarski;
   domain fatherdec*offer;
   cluster hhid;
   var coll;
   weight wt88;
run;


                                    The SURVEYMEANS Procedure

                                           Data Summary

                               Number of Clusters              3123
                               Number of Observations          3986
                               Sum of Weights            1302933368


                                           Statistics

                                                                                   Std Error
     Variable    Label                                     N            Mean         of Mean

     coll        Full-time college by age 23            3986        0.494350        0.010515


                                           Statistics

                                Variable       95% CL for Mean

                                coll        0.47373264 0.51496809


        Domain Analysis: Father deceased by age 18*Senior in year SSSB support available

                     Senior in
                     year SSSB
Father deceased        support
by age 18            available  Variable  Label                                   N          Mean

Father not deceased          0  coll      Full-time college by age 23          1050      0.475694
                             1  coll      Full-time college by age 23          2745      0.501702
Father deceased              0  coll      Full-time college by age 23            54      0.352218
                             1  coll      Full-time college by age 23           137      0.560456


         Domain Analysis: Father deceased by age 18*Senior in year SSSB support available

                              Senior in
                              year SSSB
         Father deceased        support               Std Error
         by age 18            available  Variable       of Mean       95% CL for Mean

         Father not deceased          0  coll          0.018865    0.43870461 0.51268248
                                      1  coll          0.012174    0.47783269 0.52557057
         Father deceased              0  coll          0.081245    0.19291968 0.51151598
                                      1  coll          0.052744    0.45703939 0.66387184
(b) Linear-Probability Model (OLS) Estimate shown in Table 8.1 on page 143.
proc surveyreg data=dynarski;
   model coll = offer;
   cluster hhid;
   weight wt88;
   where fatherdec=1;
run;
                                     The SURVEYREG Procedure

                         Regression Analysis for Dependent Variable coll

                                           Data Summary

                               Number of Observations           191
                               Sum of Weights              51656801
                               Weighted Mean of coll        0.49986
                               Weighted Sum of coll        25821369


                                          Design Summary

                                 Number of Clusters           172


                                          Fit Statistics

                                    R-square           0.03578
                                    Root MSE            0.4936
                                    Denominator DF         171


                                      Tests of Model Effects

                             Effect       Num DF    F Value    Pr > F

                             Model             1       4.93    0.0277
                             Intercept         1      18.59    <.0001
                             offer             1       4.93    0.0277

                 NOTE: The denominator degrees of freedom for the F tests is 171.


                                Estimated Regression Coefficients

                                                Standard
                   Parameter      Estimate         Error    t Value    Pr > |t|

                   Intercept    0.35221783    0.08168396       4.31      <.0001
                   offer        0.20823778    0.09375011       2.22      0.0277
Figure 8.1 on page 155. Note that some of the output from the following section of code is not shown.
data dynarski;
   set dynarski;
   if offer=1 then post = 0;
   if offer=0 then post = 1;
run;

proc sort data=dynarski;
   by fatherdec post;
run;

proc surveymeans data=dynarski;
   by fatherdec post;
   cluster hhid;
   var coll;
   weight wt88;
   ods output statistics = table81;
run;

proc print data=table81;
run;

proc format;
   value post 0="pre-1981"
              1="post-1981";
run;

proc sgplot data=table81;
   by fatherdec;
   series x=post y=mean ;
   yaxis min=.3 max=.6;
   xaxis tickvalueformat=post. values=(0 1);
run;
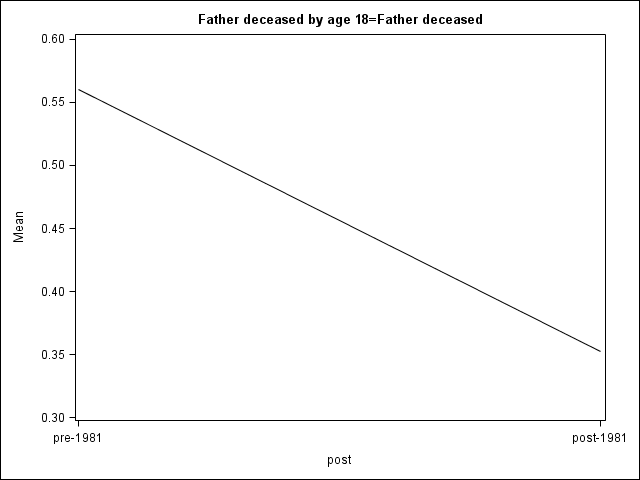
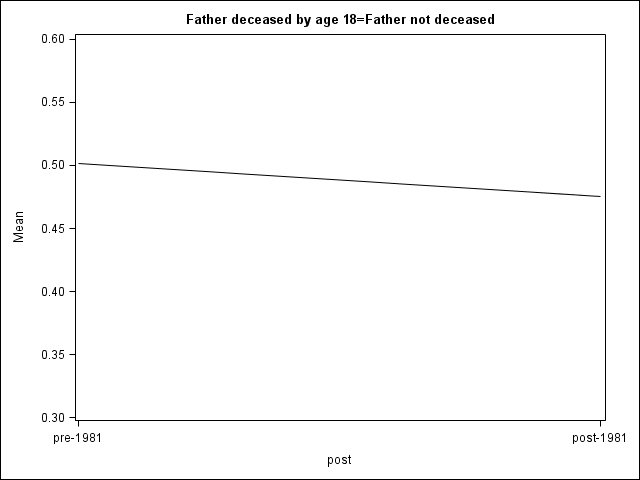
Table 8.2 on page 157, labeled "(First Diff)". (Note this replicates the last regression model.)
proc surveyreg data=dynarski;
   model coll = offer;
   cluster hhid;
   weight wt88;
   where fatherdec = 1 ;
run;

                                     The SURVEYREG Procedure

                         Regression Analysis for Dependent Variable coll

                                           Data Summary

                               Number of Observations           191
                               Sum of Weights              51656801
                               Weighted Mean of coll        0.49986
                               Weighted Sum of coll        25821369


                                          Design Summary

                                 Number of Clusters           172


                                          Fit Statistics

                                    R-square           0.03578
                                    Root MSE            0.4936
                                    Denominator DF         171


                                      Tests of Model Effects

                             Effect       Num DF    F Value    Pr > F

                             Model             1       4.93    0.0277
                             Intercept         1      18.59    <.0001
                             offer             1       4.93    0.0277

                 NOTE: The denominator degrees of freedom for the F tests is 171.


                                Estimated Regression Coefficients

                                                Standard
                   Parameter      Estimate         Error    t Value    Pr > |t|

                   Intercept    0.35221783    0.08168396       4.31      <.0001
                   offer        0.20823778    0.09375011       2.22      0.0277
Table 8.2 on page 157, labeled "(Second Diff)".
proc surveyreg data=dynarski;
   model coll = offer;
   cluster hhid;
   weight wt88;
   where fatherdec = 0;
run;


                                     The SURVEYREG Procedure

                         Regression Analysis for Dependent Variable coll

                                           Data Summary

                               Number of Observations          3795
                               Sum of Weights            1251276567
                               Weighted Mean of coll        0.49412
                               Weighted Sum of coll       618284217


                                          Design Summary

                                 Number of Clusters          2984


                                          Fit Statistics

                                    R-square          0.000559
                                    Root MSE            0.5000
                                    Denominator DF        2983


                                      Tests of Model Effects

                             Effect       Num DF    F Value    Pr > F

                             Model             1       1.50    0.2215
                             Intercept         1     635.66    <.0001
                             offer             1       1.50    0.2215

                NOTE: The denominator degrees of freedom for the F tests is 2983.


                                Estimated Regression Coefficients

                                                Standard
                   Parameter      Estimate         Error    t Value    Pr > |t|

                   Intercept    0.47569354    0.01886756      25.21      <.0001
                   offer        0.02600809    0.02126729       1.22      0.2215
Table 8.4 on page 161.
proc surveyreg data=dynarski;
   model coll = offer fatherdec offer*fatherdec;
   cluster hhid;
   weight wt88;
   estimate offer 1 offer*fatherdec 1 ;
   run;

                                     The SURVEYREG Procedure

                         Regression Analysis for Dependent Variable coll

                                           Data Summary

                               Number of Observations          3986
                               Sum of Weights            1302933368
                               Weighted Mean of coll        0.49435
                               Weighted Sum of coll       644105586


                                          Design Summary

                                 Number of Clusters          3123


                                          Fit Statistics

                                    R-square          0.001961
                                    Root MSE            0.4997
                                    Denominator DF        3122


                                      Tests of Model Effects

                          Effect             Num DF    F Value    Pr > F

                          Model                   3       2.19    0.0875
                          Intercept               1     635.36    <.0001
                          offer                   1       1.49    0.2216
                          fatherdec               1       2.19    0.1391
                          offer*fatherdec         1       3.61    0.0574

                NOTE: The denominator degrees of freedom for the F tests is 3122.


                                Estimated Regression Coefficients

                                                   Standard
                Parameter            Estimate         Error    t Value    Pr > |t|

                Intercept           0.4756935    0.01887204      25.21      <.0001
                offer               0.0260081    0.02127234       1.22      0.2216
                fatherdec          -0.1234757    0.08345651      -1.48      0.1391
                offer*fatherdec     0.1822297    0.09587712       1.90      0.0574


                                     The SURVEYREG Procedure

                         Regression Analysis for Dependent Variable coll

                                            Estimate

                                       Standard
                  Label    Estimate       Error       DF    t Value    Pr > |t|

                  Row 1      0.2082     0.09328     3122       2.23      0.0257