You can download the dataset for this chapter by clicking here: https://stats.idre.ucla.edu/wp-content/uploads/2016/02/angrist.sas7bdat.
Descriptive statistics for the all variables. The variable read is the average reading score for each school, size is the cohort size for each school, intended_classsize is the average intended class size for each school, and observed_classize is the average of actual class sizes for each school. Note: this output does not appear in the text.
proc means data=angrist;
   vars read size intended_classize observed_classize;
run;


                                       The MEANS Procedure

 Variable             Label                                     N            Mean         Std Dev

 read                 verbal score (class average)           2019      74.3791713       7.6784598
 size                 size of september enrollment cohort    2019      77.7419515      38.8107308
 intended_classize    maimonides rule                        2019      30.9559353       6.1079239
 observed_classize    spring class size                      2019      29.9351164       6.5458852


     Variable             Label                                       Minimum         Maximum

     read                 verbal score (class average)             34.7999992      93.8600006
     size                 size of september enrollment cohort       8.0000000     226.0000000
     intended_classize    maimonides rule                           8.0000000      40.0000000
     observed_classize    spring class size                         8.0000000      44.0000000
A boxplot showing the distribution of read by size. (Not shown in text.)
proc sgplot data=angrist;
   vbox read / category=size;
   where size>=36 AND size<=46;
run;
Table 9.1 on page 168.
proc sql ;
   select size, mean(intended_classize) as mean_intended,
   mean(observed_classize) as mean_observed, mean(read) as mean_read,
   std(read) as sd_read
   from angrist
   where size>=36 AND size<=46
   group by size;
quit;

                      size of
                    september
                   enrollment         mean_         mean_
                       cohort      intended      observed  mean_read   sd_read

                           36            36      27.44444   67.30445  12.36389
                           37            37      26.22222   68.94066  8.497514
                           38            38          33.1     67.854  14.03826
                           39            39          31.2      68.87  12.07238
                           40            40      29.88889   67.92847  7.865053
                           41          20.5      22.67857    73.6767  8.766867
                           42            21          23.4    67.5956  9.302938
                           43          21.5        22.125   77.17644  7.466089
                           44            22      24.41176    72.1616  7.712399
                           45          22.5      22.73684   76.91684  8.708218
                           46            23         22.55   70.30814  9.783913
Difference analysis discussed on page 172.
data angrist;
   set angrist;
   if size<=40 then small=0;
   if size>40 then small=1;
run;

proc ttest data=angrist;
   class small;
   var read;
   where size=40 | size = 41;
run;

                                       The TTEST Procedure

                         Variable:  read  (verbal score (class average))

          small           N        Mean     Std Dev     Std Err     Minimum     Maximum

          0               9     67.9285      7.8651      2.6217     52.7700     77.2900
          1              28     73.6767      8.7669      1.6568     55.3200     89.2700
          Diff (1-2)            -5.7482      8.5691      3.2835

  small         Method               Mean       95% CL Mean        Std Dev      95% CL Std Dev

  0                               67.9285     61.8829  73.9741      7.8651      5.3125  15.0676
  1                               73.6767     70.2773  77.0761      8.7669      6.9313  11.9329
  Diff (1-2)    Pooled            -5.7482    -12.4141   0.9176      8.5691      6.9502  11.1779
  Diff (1-2)    Satterthwaite     -5.7482    -12.3601   0.8637

                   Method           Variances        DF    t Value    Pr > |t|

                   Pooled           Equal            35      -1.75      0.0888
                   Satterthwaite    Unequal      14.959      -1.85      0.0836

                                      Equality of Variances

                        Method      Num DF    Den DF    F Value    Pr > F

                        Folded F        27         8       1.24    0.7921
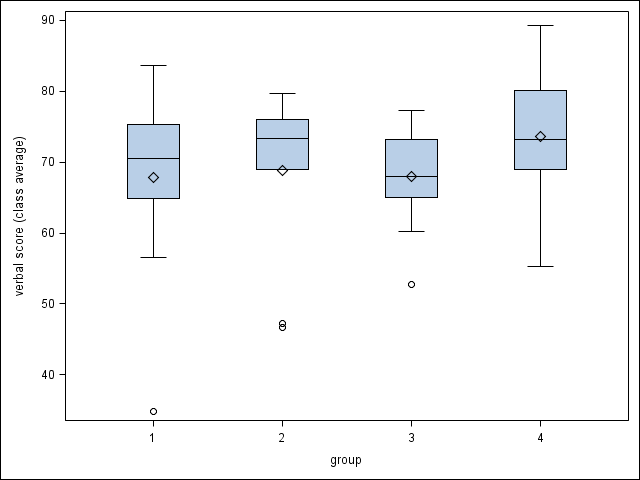
Difference of difference analysis, discussed starting on page 173. (Output not shown in text.)
data angrist2;
   set angrist;
   where size>=38 & size<=41;
   if size=38 then group=1;
   if size=39 then group=2;
   if size=40 then group=3;
   if size=41 then group=4;
run;

proc sort data=angrist2;
   by group;
run;

proc means data=angrist2 mean var;
   class group;
   var read;
run;


                                       The MEANS Procedure

                      Analysis Variable : read verbal score (class average)

                                         N
                              group    Obs            Mean        Variance

                                  1     10      67.8540001     197.0727013

                                  2     10      68.8699997     145.7422671

                                  3      9      67.9284655      61.8590551

                                  4     28      73.6766950      76.8579504


proc sgplot data=angrist2;
   vbox read / category=group;
run;


* "larger" distinguishes the group with the larger enrollment in any pair;
* "first" distinguishes the groups that participate in the first diff;
data angrist2;
   set angrist2;
   if group=1 | group=3 then larger=0;
   if group=2 | group=4 then larger=1;

   if group=1 | group=2 then first=0;
   if group=3 | group=4 then first=1;
run;

proc glm data=angrist2;
   model read = first larger first*larger;
run;


                                        The GLM Procedure

                             Number of Observations Read          57
                             Number of Observations Used          57


                                        The GLM Procedure

Dependent Variable: read   verbal score (class average)

                                               Sum of
       Source                      DF         Squares     Mean Square    F Value    Pr > F

       Model                        3      429.340264      143.113421       1.34    0.2709

       Error                       53     5655.371816      106.705129

       Corrected Total             56     6084.712080


                        R-Square     Coeff Var      Root MSE     read Mean

                        0.070560      14.56868      10.32982      70.90427


       Source                      DF       Type I SS     Mean Square    F Value    Pr > F

       first                        1     199.1352089     199.1352089       1.87    0.1777
       larger                       1     165.6365436     165.6365436       1.55    0.2183
       first*larger                 1      64.5685115      64.5685115       0.61    0.4401


       Source                      DF     Type III SS     Mean Square    F Value    Pr > F

       first                        1      0.02626627      0.02626627       0.00    0.9875
       larger                       1      5.16127597      5.16127597       0.05    0.8268
       first*larger                 1     64.56851148     64.56851148       0.61    0.4401


                                                    Standard
               Parameter            Estimate           Error    t Value    Pr > |t|

               Intercept         67.85400009      3.26657510      20.77      <.0001
               first              0.07446543      4.74622358       0.02      0.9875
               larger             1.01599960      4.61963480       0.22      0.8268
               first*larger       4.73222988      6.08342408       0.78      0.4401
* "larger" distinguishes the group with the larger enrollment in any pair;
* "first" distinguishes the groups that participate in the first diff;
data angrist2;
set angrist2;
if group=1 | group=3 then larger=0;
if group=2 | group=4 then larger=1;
if group=1 | group=2 then first=0;
if group=3 | group=4 then first=1;
run;
proc glm data=angrist2;
model read = first larger first*larger;
run;
The GLM Procedure
Number of Observations Read 57
Number of Observations Used 57
The GLM Procedure
Dependent Variable: read verbal score (class average)
Sum of
Source DF Squares Mean Square F Value Pr > F
Model 3 429.340264 143.113421 1.34 0.2709
Error 53 5655.371816 106.705129
Corrected Total 56 6084.712080
R-Square Coeff Var Root MSE read Mean
0.070560 14.56868 10.32982 70.90427
Source DF Type I SS Mean Square F Value Pr > F
first 1 199.1352089 199.1352089 1.87 0.1777
larger 1 165.6365436 165.6365436 1.55 0.2183
first*larger 1 64.5685115 64.5685115 0.61 0.4401
Source DF Type III SS Mean Square F Value Pr > F
first 1 0.02626627 0.02626627 0.00 0.9875
larger 1 5.16127597 5.16127597 0.05 0.8268
first*larger 1 64.56851148 64.56851148 0.61 0.4401
Standard
Parameter Estimate Error t Value Pr > |t|
Intercept 67.85400009 3.26657510 20.77 <.0001
first 0.07446543 4.74622358 0.02 0.9875
larger 1.01599960 4.61963480 0.22 0.8268
first*larger 4.73222988 6.08342408 0.78 0.4401
Figure 9.1 on page 176. The dataset has changed so you will need to open the original dataset again.
proc sql;
   create table angrist3 as
   select *, mean(read) as mread
   from angrist
   group by size;
quit;

data angrist3;
   set angrist3;
   if size=41 then mread41=mread;
   if size>=36 & size<=40 then mread3640 = mread;
run;

proc sgplot data=angrist3 noautolegend;
   series y=mread3640 x=size;
   scatter y=mread41 x=size ;
   reg y=mread3640 x=size ;
   where size>=36 & size<=41;
   yaxis label='Average Reading Achievement';
   xaxis label='Size of Enrollment Cohort';
run;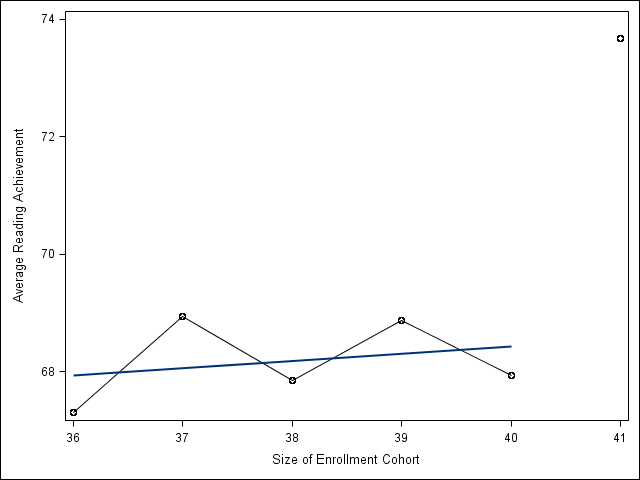
Table 9.3 on page 180.
data angrist;
   set angrist;
   small=0 ;
   if size>=41 then small=1;
   csize = size-41;
run;

proc glm data=angrist;
   model read = csize small;
   where size>=36 & size<=41;
run;
quit;


                                        The GLM Procedure

                             Number of Observations Read          75
                             Number of Observations Used          75
                                          The SAS System     11:04 Wednesday, January 19, 2011 122

                                        The GLM Procedure

Dependent Variable: read   verbal score (class average)

                                               Sum of
       Source                      DF         Squares     Mean Square    F Value    Pr > F

       Model                        2      530.144127      265.072063       2.55    0.0848

       Error                       72     7473.058357      103.792477

       Corrected Total             74     8003.202483


                        R-Square     Coeff Var      Root MSE     read Mean

                        0.066241      14.50505      10.18786      70.23666


       Source                      DF       Type I SS     Mean Square    F Value    Pr > F

       csize                        1     360.4818362     360.4818362       3.47    0.0665
       small                        1     169.6622905     169.6622905       1.63    0.2052


       Source                      DF     Type III SS     Mean Square    F Value    Pr > F

       csize                        1       1.3983446       1.3983446       0.01    0.9079
       small                        1     169.6622905     169.6622905       1.63    0.2052


                                                  Standard
                Parameter         Estimate           Error    t Value    Pr > |t|

                Intercept      68.55656883      3.51152647      19.52      <.0001
                csize           0.12397588      1.06810272       0.12      0.9079
                small           5.12012617      4.00470877       1.28      0.2052
1044  quit;
Boxplot of read by school size, for classes size 36-46. (Not shown in text.)
proc sgplot data=angrist;
   vbox read / category=size;
   where size>=36 & size<=46;
run;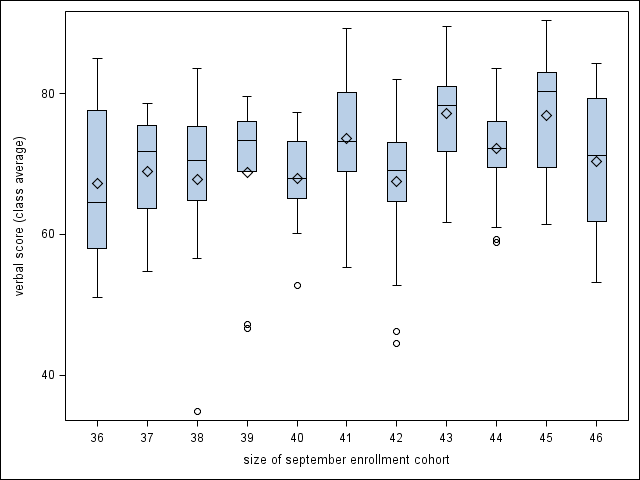
Table 9.4 on page 183.
proc glm data=angrist;
   model read = csize small;
   where size>=36 & size<=46;
run;
quit;


                                        The GLM Procedure

                             Number of Observations Read         180
                             Number of Observations Used         180

                                        The GLM Procedure

Dependent Variable: read   verbal score (class average)

                                               Sum of
       Source                      DF         Squares     Mean Square    F Value    Pr > F

       Model                        2       794.77415       397.38708       4.25    0.0158

       Error                      177     16564.03364        93.58211

       Corrected Total            179     17358.80779


                        R-Square     Coeff Var      Root MSE     read Mean

                        0.045785      13.49391      9.673785      71.69002


       Source                      DF       Type I SS     Mean Square    F Value    Pr > F

       csize                        1     619.5174098     619.5174098       6.62    0.0109
       small                        1     175.2567410     175.2567410       1.87    0.1729


       Source                      DF     Type III SS     Mean Square    F Value    Pr > F

       csize                        1      14.3411041      14.3411041       0.15    0.6959
       small                        1     175.2567410     175.2567410       1.87    0.1729


                                                  Standard
                Parameter         Estimate           Error    t Value    Pr > |t|

                Intercept      68.69568689      1.91775834      35.82      <.0001
                csize           0.17067980      0.43600075       0.39      0.6959
                small           3.84715660      2.81124643       1.37      0.1729
Syntax to produce the coefficients from small and csize shown in Table 9.5 on page 184.
proc glm data=angrist;
model read = csize small;
where size>=36 & size<=41;
run;
The GLM Procedure
Number of Observations Read 75
Number of Observations Used 75
The GLM Procedure
Dependent Variable: read verbal score (class average)
Sum of
Source DF Squares Mean Square F Value Pr > F
Model 2 530.144127 265.072063 2.55 0.0848
Error 72 7473.058357 103.792477
Corrected Total 74 8003.202483
R-Square Coeff Var Root MSE read Mean
0.066241 14.50505 10.18786 70.23666
Source DF Type I SS Mean Square F Value Pr > F
csize 1 360.4818362 360.4818362 3.47 0.0665
small 1 169.6622905 169.6622905 1.63 0.2052
Source DF Type III SS Mean Square F Value Pr > F
csize 1 1.3983446 1.3983446 0.01 0.9079
small 1 169.6622905 169.6622905 1.63 0.2052
Standard
Parameter Estimate Error t Value Pr > |t|
Intercept 68.55656883 3.51152647 19.52 <.0001
csize 0.12397588 1.06810272 0.12 0.9079
small 5.12012617 4.00470877 1.28 0.2052
proc glm data=angrist;
model read = csize small;
where size>=36 & size<=46;
run;
The GLM Procedure
Number of Observations Read 180
Number of Observations Used 180
The GLM Procedure
Dependent Variable: read verbal score (class average)
Sum of
Source DF Squares Mean Square F Value Pr > F
Model 2 794.77415 397.38708 4.25 0.0158
Error 177 16564.03364 93.58211
Corrected Total 179 17358.80779
R-Square Coeff Var Root MSE read Mean
0.045785 13.49391 9.673785 71.69002
Source DF Type I SS Mean Square F Value Pr > F
csize 1 619.5174098 619.5174098 6.62 0.0109
small 1 175.2567410 175.2567410 1.87 0.1729
Source DF Type III SS Mean Square F Value Pr > F
csize 1 14.3411041 14.3411041 0.15 0.6959
small 1 175.2567410 175.2567410 1.87 0.1729
Standard
Parameter Estimate Error t Value Pr > |t|
Intercept 68.69568689 1.91775834 35.82 <.0001
csize 0.17067980 0.43600075 0.39 0.6959
small 3.84715660 2.81124643 1.37 0.1729
proc glm data=angrist;
model read = csize small;
where size>=35 & size<=47;
run;
The GLM Procedure
Number of Observations Read 221
Number of Observations Used 221
The GLM Procedure
Dependent Variable: read verbal score (class average)
Sum of
Source DF Squares Mean Square F Value Pr > F
Model 2 766.65527 383.32764 4.24 0.0156
Error 218 19694.93698 90.34375
Corrected Total 220 20461.59226
R-Square Coeff Var Root MSE read Mean
0.037468 13.23299 9.504933 71.82755
Source DF Type I SS Mean Square F Value Pr > F
csize 1 521.8926837 521.8926837 5.78 0.0171
small 1 244.7625898 244.7625898 2.71 0.1012
Source DF Type III SS Mean Square F Value Pr > F
csize 1 0.2672968 0.2672968 0.00 0.9567
small 1 244.7625898 244.7625898 2.71 0.1012
Standard
Parameter Estimate Error t Value Pr > |t|
Intercept 68.76637004 1.67352147 41.09 <.0001
csize 0.01707451 0.31390657 0.05 0.9567
small 4.12172842 2.50412442 1.65 0.1012
proc glm data=angrist;
model read = csize small;
where size>=34 & size<=48;
run;
The GLM Procedure
Number of Observations Read 259
Number of Observations Used 259
The GLM Procedure
Dependent Variable: read verbal score (class average)
Sum of
Source DF Squares Mean Square F Value Pr > F
Model 2 827.84469 413.92234 4.76 0.0093
Error 256 22239.42185 86.87274
Corrected Total 258 23067.26654
R-Square Coeff Var Root MSE read Mean
0.035888 12.96111 9.320555 71.91172
Source DF Type I SS Mean Square F Value Pr > F
csize 1 564.9314706 564.9314706 6.50 0.0114
small 1 262.9132181 262.9132181 3.03 0.0831
Source DF Type III SS Mean Square F Value Pr > F
csize 1 0.0046601 0.0046601 0.00 0.9942
small 1 262.9132181 262.9132181 3.03 0.0831
Standard
Parameter Estimate Error t Value Pr > |t|
Intercept 68.98157843 1.51761499 45.45 <.0001
csize 0.00182198 0.24876314 0.01 0.9942
small 4.01178643 2.30607463 1.74 0.0831
proc glm data=angrist;
model read = csize small;
where size>=33 & size<=49;
run;
The GLM Procedure
Number of Observations Read 288
Number of Observations Used 288
The GLM Procedure
Dependent Variable: read verbal score (class average)
Sum of
Source DF Squares Mean Square F Value Pr > F
Model 2 727.97326 363.98663 4.36 0.0136
Error 285 23778.04705 83.43174
Corrected Total 287 24506.02031
R-Square Coeff Var Root MSE read Mean
0.029706 12.65253 9.134098 72.19189
Source DF Type I SS Mean Square F Value Pr > F
csize 1 486.5361321 486.5361321 5.83 0.0164
small 1 241.4371313 241.4371313 2.89 0.0900
Source DF Type III SS Mean Square F Value Pr > F
csize 1 0.3105589 0.3105589 0.00 0.9514
small 1 241.4371313 241.4371313 2.89 0.0900
Standard
Parameter Estimate Error t Value Pr > |t|
Intercept 69.54771739 1.40848952 49.38 <.0001
csize -0.01282446 0.21020003 -0.06 0.9514
small 3.67186597 2.15849203 1.70 0.0900
proc glm data=angrist;
model read = csize small;
where size>=32 & size<=50;
run;
The GLM Procedure
Number of Observations Read 315
Number of Observations Used 315
The GLM Procedure
Dependent Variable: read verbal score (class average)
Sum of
Source DF Squares Mean Square F Value Pr > F
Model 2 662.42455 331.21227 4.08 0.0178
Error 312 25337.79969 81.21090
Corrected Total 314 26000.22424
R-Square Coeff Var Root MSE read Mean
0.025478 12.41907 9.011709 72.56346
Source DF Type I SS Mean Square F Value Pr > F
csize 1 490.8500261 490.8500261 6.04 0.0145
small 1 171.5745236 171.5745236 2.11 0.1471
Source DF Type III SS Mean Square F Value Pr > F
csize 1 1.9174557 1.9174557 0.02 0.8780
small 1 171.5745236 171.5745236 2.11 0.1471
Standard
Parameter Estimate Error t Value Pr > |t|
Intercept 70.37797062 1.32498335 53.12 <.0001
csize 0.02785393 0.18127211 0.15 0.8780
small 2.96634260 2.04080759 1.45 0.1471
proc glm data=angrist;
model read = csize small;
where size>=31 & size<=51;
run;
The GLM Procedure
Number of Observations Read 352
Number of Observations Used 352
The GLM Procedure
Dependent Variable: read verbal score (class average)
Sum of
Source DF Squares Mean Square F Value Pr > F
Model 2 760.14017 380.07008 4.58 0.0109
Error 349 28979.74327 83.03651
Corrected Total 351 29739.88343
R-Square Coeff Var Root MSE read Mean
0.025560 12.55109 9.112437 72.60273
Source DF Type I SS Mean Square F Value Pr > F
csize 1 571.6505728 571.6505728 6.88 0.0091
small 1 188.4895936 188.4895936 2.27 0.1328
Source DF Type III SS Mean Square F Value Pr > F
csize 1 4.4935683 4.4935683 0.05 0.8162
small 1 188.4895936 188.4895936 2.27 0.1328
Standard
Parameter Estimate Error t Value Pr > |t|
Intercept 70.38685823 1.25279621 56.18 <.0001
csize 0.03592477 0.15443043 0.23 0.8162
small 2.92719390 1.94286379 1.51 0.1328
proc glm data=angrist;
model read = csize small;
where size>=30 & size<=52;
run;
The GLM Procedure
Number of Observations Read 385
Number of Observations Used 385
The GLM Procedure
Dependent Variable: read verbal score (class average)
Sum of
Source DF Squares Mean Square F Value Pr > F
Model 2 632.40608 316.20304 3.91 0.0209
Error 382 30914.61803 80.92832
Corrected Total 384 31547.02411
R-Square Coeff Var Root MSE read Mean
0.020046 12.38679 8.996017 72.62590
Source DF Type I SS Mean Square F Value Pr > F
csize 1 362.7692594 362.7692594 4.48 0.0349
small 1 269.6368231 269.6368231 3.33 0.0687
Source DF Type III SS Mean Square F Value Pr > F
csize 1 8.8270914 8.8270914 0.11 0.7414
small 1 269.6368231 269.6368231 3.33 0.0687
Standard
Parameter Estimate Error t Value Pr > |t|
Intercept 70.28562412 1.18328290 59.40 <.0001
csize -0.04415984 0.13371156 -0.33 0.7414
small 3.36202761 1.84188256 1.83 0.0687
proc glm data=angrist;
model read = csize small;
where size>=29 & size<=53;
run;
The GLM Procedure
Number of Observations Read 423
Number of Observations Used 423
The GLM Procedure
Dependent Variable: read verbal score (class average)
Sum of
Source DF Squares Mean Square F Value Pr > F
Model 2 523.19971 261.59986 3.10 0.0459
Error 420 35406.02649 84.30006
Corrected Total 422 35929.22620
R-Square Coeff Var Root MSE read Mean
0.014562 12.64227 9.181507 72.62545
Source DF Type I SS Mean Square F Value Pr > F
csize 1 116.4220236 116.4220236 1.38 0.2406
small 1 406.7776872 406.7776872 4.83 0.0286
Source DF Type III SS Mean Square F Value Pr > F
csize 1 115.0706088 115.0706088 1.37 0.2433
small 1 406.7776872 406.7776872 4.83 0.0286
Standard
Parameter Estimate Error t Value Pr > |t|
Intercept 70.11879928 1.15121736 60.91 <.0001
csize -0.13916580 0.11911440 -1.17 0.2433
small 3.95314634 1.79960951 2.20 0.0286