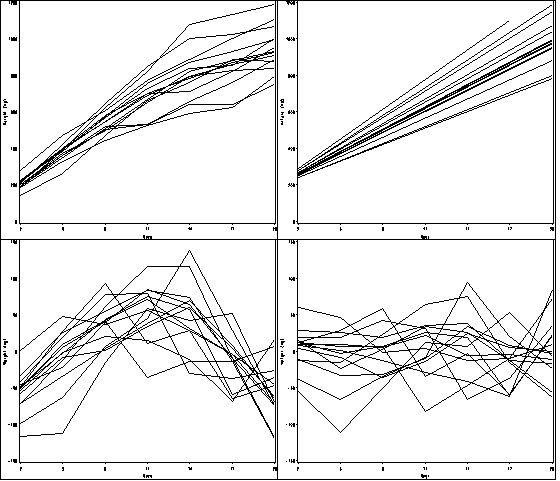
Figure 10.1, page 334.
*Figure a;
goptions reset = all;
 symbol1 value=none color=black interpol = join repeat = 38;
 axis1 order =(2 to 20 by 3) label=(a=0 'Days') minor=none;
 axis2 order =(0 to 1200 by 200) label = (a=90 'Weight (mg)') minor=none ;

proc gplot data = smallmice;
 plot weight*day=id / haxis = axis1 vaxis = axis2 nolegend name = 'f10_1a';
run; quit;

*Figure b;
data sm;
 set smallmice;
 cont_day = day;
run;

proc mixed data = sm method = reml;
 class id day;
 model weight = cont_day/ 	outpred = pred_sm;
 random cont_day/ subject = id type = un;
run;

goptions reset = all;
 symbol1 value=none color=black interpol = join repeat = 38;
 axis1 order =(2 to 20 by 3) label=(a=0 'Days') minor=none;
 axis2 order =(000 to 1200 by 200) label = (a=90 'Weight (mg)') minor=none ;

proc gplot data = pred_sm;
 plot pred*day=id / haxis = axis1 vaxis = axis2 nolegend name = 'f10_1b';
run; quit;

*Figure c;
goptions reset = all;
 symbol1 value=none color=black interpol = join repeat = 38;
 axis1 order =(2 to 20 by 3) label=(a=0 'Days') minor=none;
 axis2 order =(-150 to 150 by 50) label = (a=90 'Weight (mg)') minor=none ;

proc gplot data = pred_sm;
 plot resid*day=id / haxis = axis1 vaxis = axis2 nolegend name = 'f10_1c';
run; quit;

*Figure d;
proc mixed data = sm method = reml;
 class id day;
 model weight = cont_day cont_day*cont_day/ outpred = pred_sm2;
 random cont_day/ subject = id type = un;
run;

goptions reset = all;
 symbol1 value=none color=black interpol = join repeat = 38;
 axis1 order =(2 to 20 by 3) label=(a=0 'Days') minor=none;
 axis2 order =(-150 to 150 by 50) label = (a=90 'Weight (mg)') minor=none ;

proc gplot data = pred_sm2;
 plot resid*day=id / haxis = axis1 vaxis = axis2 nolegend name = 'f10_1d';
run; quit;

proc greplay igout = work.gseg tc=sashelp.templt template=l2r2 nofs;
 treplay  1:f10_1a 2:f10_1c 3:f10_1b 4:f10_1d;
run; quit;
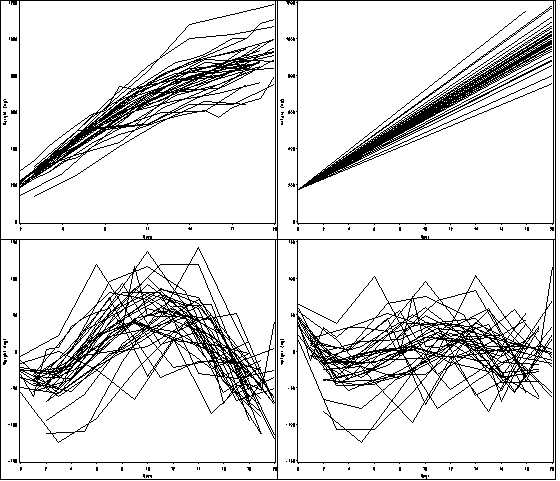
Figure 10.2, page 335.
*Figure a;
goptions reset = all;
 symbol1 value=none color=black interpol = join repeat = 38;
 axis1 order =(0 to 20 by 2) label=(a=0 'Days') minor=none;
 axis2 order =(0 to 1200 by 200) label = (a=90 'Weight (mg)') minor=none ;

proc gplot data = bigmice;
 plot weight*day=id / haxis = axis1 vaxis = axis2 nolegend name = 'f10_2a';
run; quit;

*Figure b;
data bm;
 set bigmice;
 cont_day = day;
run;

proc mixed data = bm method = reml;
 class id day;
 model weight = cont_day/ outpred = pred_bm;
 random cont_day/ subject = id type = un;
run;

goptions reset = all;
 symbol1 value=none color=black interpol = join repeat = 38;
 axis1 order =(0 to 20 by 2) label=(a=0 'Days') minor=none;
 axis2 order =(000 to 1200 by 200) label = (a=90 'Weight (mg)') minor=none ;

proc gplot data = pred_bm;
 plot pred*day=id / haxis = axis1 vaxis = axis2 nolegend name = 'f10_2b';
run; quit;

*Figure c;
goptions reset = all;
 symbol1 value=none color=black interpol = join repeat = 38;
 axis1 order =(0 to 20 by 2) label=(a=0 'Days') minor=none;
 axis2 order =(-150 to 150 by 50) label = (a=90 'Weight (mg)') minor=none ;

proc gplot data = pred_bm;
 plot resid*day=id / haxis = axis1 vaxis = axis2 nolegend name = 'f10_2c';
run; quit;

*Figure d;
proc mixed data = bm method = reml;
 class id day;
 model weight = cont_day cont_day*cont_day/ outpred = pred_bm2;
 random cont_day/ subject = id type = un;
run;

goptions reset = all;
 symbol1 value=none color=black interpol = join repeat = 38;
 axis1 order =(0 to 20 by 2) label=(a=0 'Days') minor=none;
 axis2 order =(-150 to 150 by 50) label = (a=90 'Weight (mg)') minor=none ;

proc gplot data = pred_bm2;
 plot resid*day=id / haxis = axis1 vaxis = axis2 nolegend name = 'f10_2d';
run; quit;

proc greplay igout = work.gseg tc=sashelp.templt template=l2r2 nofs;
 treplay  1:f10_2a 2:f10_2c 3:f10_2b 4:f10_2d;
run; quit;
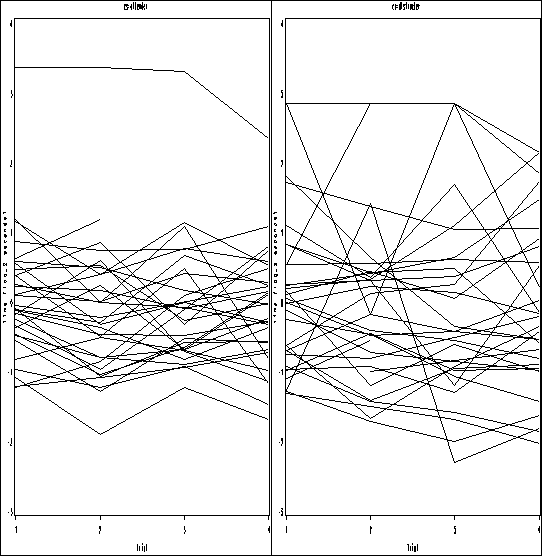
Figure 10.3, page 337.
data pain1;
 set pain;
 tmt_a = (treatment = "attend")*(trial = 4);
 tmt_d = (treatment = "distract")*(trial = 4);
 tmt_n = (treatment = "no directions")*(trial = 4);
 attend = (cs = "attender");
 distract = (cs = "distracter");
run;

proc mixed data = pain1 method = reml;
 class id trial;
 model l2paintol = attend tmt_a tmt_d tmt_n attend*tmt_a attend*tmt_d attend*tmt_n/ outpred=pred_pain;
  repeated trial / subject = id type = cs;
run;

proc sort data = pred_pain;
 by cs id trial;
run;

proc greplay igout = work.gseg nofs;
  delete _all_;
run; quit;

goptions reset = all;
 symbol1 value=none color=black interpol = join repeat = 100;
 axis1 order =(1 to 4 by 1) label=(a=0 'Trial') minor=none;
 axis2 order =(-3 to 4 by 1) label = (a=90 'Time (log_2 seconds)') minor=none ;

proc gplot data = pred_pain;
 by cs;
 plot resid*trial=id/ nolegend haxis=axis1 vaxis=axis2 name='f10_3_';
run; quit;

proc greplay igout = work.gseg tc=sashelp.templt template=h2 nofs;
 treplay  1:f10_3_ 2:f10_3_1 ;
run; quit;
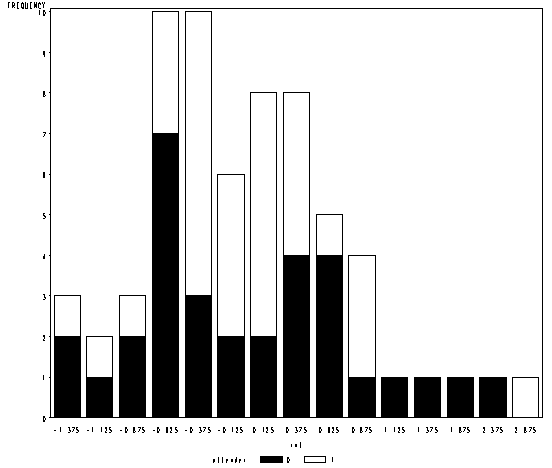
Figure 10.4, page 338.
proc mixed data = pain1 method = reml noclprint noitprint noinfo;
 class id trial;
 model l2paintol = attend tmt_a tmt_d tmt_n attend*tmt_a attend*tmt_d attend*tmt_n/ notest outpred = id_est;
  random intercept / subject = id type = un solution;
run;

data est_intercept;
input id estimate @@;
datalines;
 1     -0.3043  2     -0.6488   3     -1.0046
 4     -0.6417  5      0.1990   6      1.2456
 7     -0.4754  8     -0.8621   9      0.1353
10      0.04389 11    -1.4032  12      0.1224
13     -0.2475  14     0.5574  15     -0.6272
16      0.3819  17     0.9213  18      0.02049
19     -0.7358  20    -0.4957  21      2.8233
22      0.6626  23     0.3961  24      0.3321
25     -1.3005  26     0.01034 27     -0.6336
28     -0.3554  29    -0.7229  30     -0.4311
31      1.3668  32    -0.8595  33      0.7519
34      0.7446  35    -1.4561  36     -0.1218
37     -0.3138  38    -0.01444 39      0.5920
40     -0.2831  41    -0.3140  42      0.8265
43      0.07633 44    -0.6576  45     -0.6538
46     -0.2161  47    -1.2259  48     -0.8144
49      0.1901  50     0.8077  51     -0.4188
52      0.7474  53     0.4312  54     -0.5192
55     -0.7178  56     2.4837  57      0.2918
58      0.4356  59    -0.4888  60      1.9018
61      0.3491  62     0.4075  63     -0.1313
64     -0.1592
;
run;

proc sql;
 create table id_cs as
  select cs, mean(id) as id
  from id_est
 group by id, cs;
quit;

proc sort data = id_cs;
 by id;
run;

data intercept;
 merge id_cs est_intercept;
 by id;
run;

data intercept;
 set intercept;
 int = .;
 if (-1.5  <= estimate < -1.25) then int = -1.375;
 if (-1.25  <= estimate < -1)    then int = -1.125;
 if (-1     <= estimate < -.75)  then int = -.875;
 if (-.75  <= estimate < -.5)   then int = -.625;
 if (-.5   <= estimate lt -.25) then int = -.375;
 if (-.25   <= estimate lt 0) then int = -.125;
 if (0   <= estimate lt .25) then int = .125;
 if (.25   <= estimate lt .5) then int = .375;
 if (.5   <= estimate lt .75) then int = .625;
 if (.75   <= estimate lt 1) then int = .875;
 if (1   <= estimate lt 1.25) then int = 1.125;
 if (1.25   <= estimate lt 1.5) then int = 1.375;
 if (1.5   <= estimate lt 1.75) then int = 1.625;
 if (1.75   <= estimate lt 2) then int = 1.875;
 if (2   <= estimate lt 2.25) then int = 2.125;
 if (2.25   <= estimate lt 2.5) then int = 2.375;
 if (2.5   <= estimate lt 2.75) then int = 2.625;
 if (2.75   <= estimate lt 3) then int = 2.875;
 attender = (cs = "attender");
run;

goptions colors=(black white);
proc gchart data = intercept;
 vbar int/subgroup=attender discrete minor =0;* midpoints=(-1.5 to 3 by .25);
run; quit;
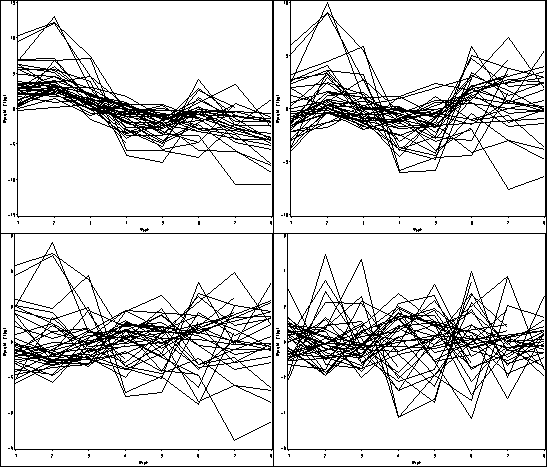
Figure 10.5, page 339.
proc greplay igout = work.gseg nofs;
  delete _all_;
run; quit;

*a;
proc mixed data=weight1 method = reml;
 class id;
 model weight =  / outpred=resid_f10_5a;
 random intercept/subject = id type = un;
run;

goptions reset = all;
 symbol1 value=none color=black interpol = join repeat = 38;
 axis1 order =(1 to 8 by 1) label=(a=0 'Week') minor=none;
 axis2 order =(-15 to 15 by 5) label = (a=90 'Weight (lbs)') minor=none ;

proc gplot data = resid_f10_5a ;
 plot resid*week=id / haxis = axis1 vaxis = axis2 nolegend name='f10_5a';
run; quit;

*b;
proc mixed data=weight1 method = reml;
 class id;
 model weight = week / outpred=resid_f10_5b;
 random intercept/subject = id type = un;
run;

goptions reset = all;
 symbol1 value=none color=black interpol = join repeat = 38;
 axis1 order =(1 to 8 by 1) label=(a=0 'Week') minor=none;
 axis2 order =(-10 to 10 by 5) label = (a=90 'Weight (lbs)') minor=none ;

proc gplot data = resid_f10_5b ;
 plot resid*week=id / haxis = axis1 vaxis = axis2 nolegend name='f10_5b';
run; quit;

*c;
proc mixed data=weight1 method = reml;
 class id week;
 model weight = week / outpred=resid_f10_5c;
 random intercept week/subject = id type = cs;
run;

goptions reset = all;
 symbol1 value=none color=black interpol = join repeat = 38;
 axis1 order =(1 to 8 by 1) label=(a=0 'Week') minor=none;
 axis2 order =(-9 to 9 by 3) label = (a=90 'Weight (lbs)') minor=none ;

proc gplot data = resid_f10_5c ;
 plot resid*week=id / haxis = axis1 vaxis = axis2 nolegend name='f10_5c';
run; quit;

*d;
data weight1;
 set weight1;
 cont_week=week;
run;

proc mixed data=weight1 method = reml;
 class id week;
 model weight = week / outpred=resid_f10_5d;
 random intercept cont_week/subject = id type = un;
run;

goptions reset = all;
 symbol1 value=none color=black interpol = join repeat = 38;
 axis1 order =(1 to 8 by 1) label=(a=0 'Week') minor=none;
 axis2 order =(-6 to 6 by 2) label = (a=90 'Weight (lbs)') minor=none ;

proc gplot data = resid_f10_5d;
 plot resid*week=id / haxis = axis1 vaxis = axis2 nolegend name='f10_5d';
run; quit;

proc greplay igout = work.gseg tc=sashelp.templt template=l2r2 nofs;
 treplay  1:f10_5a 2:f10_5c 3:f10_5b 4:f10_5d;
run; quit;

