Figure 2.1, page 31.
goptions reset = all;
 symbol1 value=circle color=black h=1;
 axis1 order =(0 to 20 by 5) label=(a=0 'Days') minor=none;
 axis2 order =(0 to 1200 by 200) label = (a=90 'Weight (mg)') minor=none;

proc gplot data = bigmice;
 plot weight*day / haxis = axis1 vaxis = axis2;
run;
Figure 2.2, page 32.
proc sort data = bigmice;
 by day;
run;

goptions reset = all;
proc boxplot data = bigmice;
 plot weight*day  / haxis=(0 to 20 by 5) vaxis = (0 to 1200 by 200) hminor=0 vminor=0;
  label weight = 'Weight';
  label day = 'Day';
run;
Figure 2.3, page 34.
proc sort data = bigmice;
 by day id;
run;

goptions reset = all;
 symbol1 value=circle color=black interpol = join repeat = 38;
 axis1 order =(0 to 20 by 5) label=(a=0 'Days') minor=none;
 axis2 order =(0 to 1200 by 200) label = (a=90 'Weight (mg)') minor=none ;

proc gplot data = bigmice;
 plot weight*day=id / haxis = axis1 vaxis = axis2 nolegend;
run; quit;
Figure 2.6, page 41.
proc sql;
 create table summary as
  select day,
         mean(weight) as mean_wght,
         std(weight) as sd_wght
  from bigmice
  group by day;
quit;

goptions reset = all;
 symbol1 value=circle color=black;
 axis1 order =(0 to 20 by 5) label=(a=0 'Days') minor=none;
 axis2 label = (a=90 'mean (mg)') order=(0 to 1000 by 200) minor = none;
proc gplot data = summary;
 plot mean_wght*day / haxis=axis1 vaxis = axis2 name = 'f2_6a';
run; quit;

goptions reset = all;
 symbol1 value=circle color=black;
 axis1 order =(0 to 20 by 5) label=(a=0 'Days') minor=none;
 axis2 order =(0 to 140 by 20) label = (a=90 'mean (mg)') minor = none;

proc gplot data = summary;
 plot sd_wght*day / haxis=axis1 vaxis = axis2 name = 'f2_6b';
run; quit;

proc greplay igout = work.gseg tc=sashelp.templt template=h2 nofs;
 treplay 1:f2_6a 2:f2_6b;
run; quit;
Figure 2.7, page 42.
proc sort data = pain;
 by day trial;
run;

goptions reset = all ;
 symbol1 value=none color=black interpol = join repeat = 100;
 axis1 order =(1 2 3 4) label=(a=0 'Trial') minor=none;
 axis2 order =(0 to 250 by 50) label = (a=90 'Tolerance (sec)') minor=none ;

proc gplot data = pain;
 plot paintol*trial=id / haxis = axis1 vaxis = axis2 nolegend name = 'f2_7a';
run; quit;

goptions reset = all ;
 symbol1 value=none color=black interpol = join repeat = 100;
 axis1 order =(1 2 3 4) label=(a=0 'Trial') minor=none;
 axis2 label = (a=90 'Tolerance (sec)') minor=none ;

proc gplot data = pain;
 plot l2paintol*trial=id / haxis = axis1 vaxis = axis2 nolegend name = 'f2_7b';
run; quit;

proc greplay igout = work.gseg tc=sashelp.templt template=h2 nofs;
 treplay 1:f2_7a 2:f2_7b;
run; quit;
Figure 2.9, page 45.
proc sql;
 create table pain0 as
  select *,
         max(paintol) as max_pain,
         count(paintol) as count_paintol
  from pain
  group by id
  having max(paintol) ne 240 and count(paintol) eq 4;
quit;

proc sql;
 create table pain1 as
  select id,
         mean(paintol) as mean_pain,
         std(paintol) as std_pain,
         mean(l2paintol) as mean_l2pain,
         std(l2paintol) as std_l2pain
  from pain0
  group by id;
quit;

goptions reset = all;
 symbol1 value=circle color=black interpol = r;
 axis1 order =(0 to 100 by 20) label=(a=0 'Mean') minor=none;
 axis2 order =(0 to  80 by 20) label=(a=90 'Sd') minor = none;

proc gplot data = pain1;
 plot std_pain*mean_pain / haxis=axis1 vaxis = axis2 name = 'f2_9a';
run; quit;

goptions reset = all;
 symbol1 value=circle color=black interpol = r;
 axis1 order =(3 to 7 by 1) label=(a=0 'Mean') minor=none;
 axis2 order =(0 to 2  by .5) label=(a=90 'Sd') minor = none;

proc gplot data = pain1;
 plot std_l2pain*mean_l2pain / haxis=axis1 vaxis = axis2 name = 'f2_9b';
run; quit;

proc greplay igout = work.gseg tc=sashelp.templt template=h2 nofs;
 treplay 1:f2_9a 2:f2_9b;
run; quit;
Figure 2.10, page 46.
proc sort data = pain;
 by cs id trial;
run;

goptions reset = all ;
 symbol1 value=none color=black interpol = join repeat = 100;
 axis1 order =(1 2 3 4) label=(a=0 'Trial') minor=none;
 axis2 label = (a=90 'Tolerance (sec)') minor=none ;

proc gplot data = pain;
 by cs;
 plot l2paintol*trial=id / haxis = axis1 vaxis = axis2 nolegend name = 'f2_10_';
run; quit;

proc greplay igout = work.gseg tc=sashelp.templt template=h2 nofs;
 treplay 1:f2_10_ 2:f2_10_1;
run; quit;
Table 2.1, page 48.
Note that there is no variable valley.
proc sql;
 create table ozone as
  select fullname, site,
         mean(long) as long,
         mean(lat) as lat,
		 mean(alt) as altitude
  from newozone1
  group by site, fullname;
quit;

proc print data = ozone noobs;
 run;

fullname                        site      long       lat     altitude

ANAHEIM                         ANAH    117.919    33.821        41
AZUSA                           AZUS    117.923    34.136       189
BURBANK                         BURK    118.308    34.183       168
LOS-ANGELES-NORTH-MAIN          CELA    118.225    34.067        87
CLAREMONT-COLLEGE               CLAR    117.704    34.102       364
FONTANA-ARROW-HIGHWAY           FONT    117.505    34.099       381
HAWTHORNE                       HAWT    118.369    33.923        21
LA-HABRA                        LAHB    117.951    33.926        82
NORTH-LONG-BEACH                LGBH    118.189    33.824         7
LYNWOOD                         LYNN    118.210    33.929        27
PASADENA-WILSON                 PASA    118.127    34.134       250
PICO-RIVERA                     PICO    118.058    34.015        69
POMONA                          POMA    117.751    34.067       270
RESEDA                          RESE    118.533    34.199       226
RIVERSIDE-RUBIDOUX              RIVR    117.417    34.000       214
SIMI-VALLEY                     SIMI    118.685    34.278       310
SAN-BERNARDINO                  SNBO    117.273    34.107       317
UPLAND-ARB                      UPLA    117.628    34.104       369
WHITTIER                        WHIT    118.025    33.924        58
WEST-LOS-ANGELES-VA-HOSPITAL    WSLA    118.455    34.051        91
Figure 2.11, page 49.
Note that the x-axis in the text is reversed.
goptions reset = all;
 symbol1 value=none pointlabel=("#site") color=black;
 axis1 order =(117 to 119 by .4) label=(a=0 'Longitude') minor=none;
 axis2 order =(33.8 to 34.3 by .1) label = (a=90 'Lattitude') minor=none ;

proc gplot data = ozone;
 plot lat*long / haxis = axis1 vaxis = axis2 nolegend;
run; quit;
Figure 2.12, page 50.
proc sort data = newozone1;
 by day site;
run;

goptions reset = all;
 symbol1 value=none color=black interpol = join repeat = 20;
 axis1 order =(6 to 18 by 2) label=(a=0 'Hour') minor=none;
 axis2 order =(0 to 30 by 5) label = (a=90 'Ozone') minor=none ;

proc gplot data = newozone1;
 by day;
 plot ozone*hour=site / haxis = axis1 vaxis = axis2 nolegend name = 'f2_12_';
run; quit;

proc greplay igout = work.gseg tc=sashelp.templt template=h3 nofs;
 treplay 1:f2_12_ 2:f2_12_1 3:f2_12_2;
run; quit;
Figure 2.13, page 51.
Note that a 5×4 graph was made instead of a 4×5 graph as in the text.
proc greplay igout = work.gseg nofs;
  delete _all_;
run;

data ozone1;
 set newozone1;
run;

proc sql;
 create table ozone2 as
 select site,
        max(ozone) as max_ozone
 from newozone1
 group by site
 order by max_ozone desc, site desc;
quit;

data ozone2;
 set ozone2;
 order = _N_;
run;

data fmt_dataset;
  retain fmtname "site";
  set ozone2 ;
  start = order;
  label = site;
run;

proc format cntlin = fmt_dataset fmtlib;
  select site;
run;

proc sql;
  create table ozone3 as
  select  *
  from ozone2, ozone1
  where ozone2.site=ozone1.site
  order by ozone2.order, ozone2.max_ozone, ozone2.site, ozone1.day, ozone1.hour;
quit;

goptions reset = all;
 symbol1 value=none color=black interpol = join repeat = 20;
 axis1 order =(6 to 18 by 2) label=(a=0 'Hour') minor=none;
 axis2 order =(0 to 30 by 5) label = (a=90 'Ozone') minor=none ;

proc gplot data = ozone3;
 by order;
 format order site.;
 plot ozone*hour=day / haxis = axis1 vaxis = axis2 nolegend name = 'f2_13_';
run; quit;

proc greplay igout = work.gseg tc=sashelp.templt template=h4 nofs ;
 treplay  4:f2_13_ 3:f2_13_1 2:f2_13_2 1:f2_13_3 ;
 treplay  4:f2_13_4 3:f2_13_5 2:f2_13_6 1:f2_13_7;
 treplay  4:f2_13_8 3:f2_13_9 2:f2_13_10 1:f2_13_11;
 treplay  4:f2_13_12 3:f2_13_13 2:f2_13_14 1:f2_13_15;
 treplay  4:f2_13_16 3:f2_13_17 2:f2_13_18 1:f2_13_19;
run; quit;

proc greplay igout = work.gseg tc=sashelp.templt template = v3 nofs;
 treplay 1:template 2: templat1 3:templat2;
run; quit;

proc greplay igout = work.gseg tc=sashelp.templt template = v3 nofs;
 treplay 1:templat3 2:templat4;
run; quit;

proc greplay igout = work.gseg tc=sashelp.templt template = v2 nofs;
 treplay 1:templat5 2:templat6;
run; quit;
Figure 2.14, page 52.
proc greplay igout = work.gseg nofs;
  delete _all_;
run; quit;

goptions reset = all;
 symbol1 value=none color=black interpol = join repeat = 20;
 axis1 order =(6 to 18 by 2) label=(a=0 'Hour') minor=none;
 axis2 order =(0 to 30 by 10) label = (a=90 'Ozone') minor=none ;

proc gplot data = ozone3;
 by order day;
 where order le 6;
 format order site.;
 plot ozone*hour=day / haxis = axis1 vaxis = axis2 nolegend name = 'f2_14_';
run; quit;

proc greplay igout = work.gseg tc=sashelp.templt template=h3 nofs ;
 treplay  1:f2_14_ 2:f2_14_1 3:f2_14_2;
 treplay  1:f2_14_3 2:f2_14_4 3:f2_14_5;
 treplay  1:f2_14_6 2:f2_14_7 3:f2_14_8;
 treplay  1:f2_14_9 2:f2_14_10 3:f2_14_11;
 treplay  1:f2_14_12 2:f2_14_13 3:f2_14_14;
 treplay  1:f2_14_15 2:f2_14_16 3:f2_14_17;
run; quit;

proc greplay igout = work.gseg tc=sashelp.templt template = v3 nofs;
 treplay 1:template 2: templat1 3:templat2;
run; quit;

proc greplay igout = work.gseg tc=sashelp.templt template = v3 nofs;
 treplay 1:templat3 2:templat4 3:templat5;
run; quit;

proc greplay igout = work.gseg tc=sashelp.templt template = v2 nofs;
 treplay 1:templat6 2:templat7;
run; quit;
Figure 2.15, page 53.
goptions reset = all;
 symbol1 value=none color=black interpol = join repeat = 38;
 axis1 order =(1 to 8 by 1) label=(a=0 'Weight (lb)') minor=none;
 axis2 order =(140 to 280 by 20) label = (a=90 'Week') minor=none ;

proc gplot data = weight1;
 plot weight*week=id / haxis = axis1 vaxis = axis2 nolegend;
run; quit;
Figure 2.16, page 54.
goptions reset = all ;
 symbol1 value=none color=black interpol = join repeat = 38;
 axis1 order =(1 to 8 by 1) label=(a=0 'Weight (lb)') minor=none;
 axis2 order =(140 to 220 by 20) label = (a=90 'Week') minor=none ;

proc gplot data = weight1;
 where weight le 220;
 plot weight*week=id / haxis = axis1 vaxis = axis2 nolegend name = 'f2_16l';
run; quit;

goptions reset = all ;
 symbol1 value=none color=black interpol = join repeat = 38;
 axis1 order =(1 to 8 by 1) label=(a=0 'Week') minor=none;
 axis2 order =(200 to 280 by 20) label = (a=90 'Weight (lb)') minor=none ;

proc gplot data = weight1;
 where weight ge 200;
 plot weight*week=id / haxis = axis1 vaxis = axis2 nolegend name = 'f2_16r';
run; quit;

proc greplay igout = work.gseg tc=sashelp.templt template = h2 nofs;
 treplay 1:f2_16l 2:f2_16r;
run; quit;
Figure 2.17, page 56.
proc sql;
 create table resid_weight as
 select *,
        weight - mean(weight) as resid
 from weight1
 group by id;
quit;

goptions reset = all ;
 symbol1 value=none color=black interpol = join repeat = 38;
 axis1 order =(1 to 8 by 1) label=(a=0 'Week') minor=none;
 axis2 order =(-15 to 15 by 5) label = (a=90 'Weight (lb)') minor=none ;

proc gplot data = resid_weight;
 plot resid*week=id / haxis = axis1 vaxis = axis2 nolegend ;
run; quit;
Figure 2.18, page 57.
proc sql;
 create table resid_bigmice as
 select *,
        weight - mean(weight) as tresid
 from bigmice
 group by day;
quit;

goptions reset = all ;
 symbol1 value=none color=black interpol = join repeat = 38;
 axis1 order =(0 to 20 by 5) label=(a=0 'Day') minor=none;
 axis2 order =(-300 to 300 by 100) label = (a=90 'Weight (mg)') minor=none ;

proc gplot data = resid_bigmice;
 plot tresid*day=id / haxis = axis1 vaxis = axis2 nolegend ;
run; quit;
Table 2.2, page 58.
proc sort data = pain;
 by id trial;
run;

proc transpose data = pain out = wide_pain prefix = l2pain ;
 by id;
 id trial;
 var l2paintol;
run;

proc corr data = wide_pain noprob nosimple;
 var l2pain1-l2pain4;
run;

The CORR Procedure
   4  Variables:    l2pain1  l2pain2  l2pain3  l2pain4

               Pearson Correlation Coefficients
                    Number of Observations
              l2pain1       l2pain2       l2pain3       l2pain4
l2pain1       1.00000       0.72601       0.83634       0.60431
                   63            62            58            60
l2pain2       0.72601       1.00000       0.71765       0.66188
                   62            63            58            61
l2pain3       0.83634       0.71765       1.00000       0.76424
                   58            58            58            58
l2pain4       0.60431       0.66188       0.76424       1.00000
                   60            61            58            61
Table 2.3, page 59.
proc sort data = smallmice;
 by id day;
run;

proc transpose data = smallmice out = wide_smallmice prefix = weight ;
 by id;
 id day;
 var weight;
run;

proc corr data = wide_smallmice noprob nosimple;
 var weight2--weight20;
run;

The CORR Procedure
   7  Variables:    weight2  weight5  weight8  weight11 weight14 weight17 weight20

                          Pearson Correlation Coefficients, N = 14
             weight2     weight5     weight8    weight11    weight14    weight17    weight20
weight2      1.00000     0.92362     0.56648     0.36127     0.23102     0.23132     0.38449
weight5      0.92362     1.00000     0.77280     0.53562     0.44996     0.40932     0.54734
weight8      0.56648     0.77280     1.00000     0.86387     0.80079     0.75786     0.80914
weight11     0.36127     0.53562     0.86387     1.00000     0.92785     0.91622     0.86744
weight14     0.23102     0.44996     0.80079     0.92785     1.00000     0.95541     0.88877
Table 2.4, page 60.
proc sort data = newozone1;
 by site day hour;
run;

proc transpose data = newozone1 out = wide_ozone prefix = ozone ;
 by site day;
 id hour;
 var ozone;
run;

proc corr data = wide_ozone noprob nosimple;
 var ozone7 ozone8--ozone18;
run;

[...output omitted...]

proc corr data = wide_ozone noprob nosimple cov;
 var ozone7 ozone8--ozone18;
run;

[...output omitted...]
Figure 2.19, page 62.
ods html;
ods graphics on;

proc corr data = wide_pain noprint plots = matrix;
 var l2pain1-l2pain4;
run;

ods graphics off;
ods html close;
Figure 2.20, page 64.
ods html;
ods graphics on;

proc corr data = wide_smallmice noprint plots = matrix (nmaxvar = 0);
 var weight2--weight20;
run;

ods graphics off;
ods html close;
Figure 2.23, page 68.
proc greplay igout = work.gseg nofs;
  delete _all_;
run; quit;

goptions reset = all ;
 axis1 order =(0 to 20 by 5) label=(a=0 'Day') minor=none;
 axis2 order =(0 to 1200 by 200) label = (a=90 'Weight (mg)') minor=none ;
 symbol1 interpol=std2mjt v=none color=red r=1;

proc gplot data=bigmice;
  plot weight*day / haxis = axis1 vaxis=axis2 name = 'f2_23a';
run; quit;

goptions reset = all ;
 axis1 order =(0 to 20 by 5) label=(a=0 'Day') minor=none;
 axis2 order =(0 to 1200 by 200) label = (a=90 'Weight (mg)') minor=none ;
 symbol1 interpol=std2jt v=none color=red r=1;

proc gplot data=bigmice;
 plot weight*day / haxis = axis1 vaxis=axis2 name = 'f2_23b';
run; quit;

proc greplay igout = work.gseg tc=sashelp.templt template = h2 nofs;
 treplay 1:f2_23a 2:f2_23b;
run; quit;
Figure 2.24, page 69.
Plot A only.
data pain_offset;
 set pain;
 if cs = "distracter" then trial = trial + .01;
run;

goptions reset = all ;
 axis1 label=(a=0 'Trial') minor=none;
 axis2 label = (a=90 'Weight (mg)') minor=none ;
 symbol1 interpol=std2mjt v=none color=red r=1;
 symbol2 interpol=std2mjt v=none color=blue r=1;

proc gplot data=pain_offset;
  plot l2paintol*trial = cs / haxis = axis1 vaxis=axis2 ;
run; quit;
Table 2.7, page 70.
proc freq data = cognitive;
 where ravens ne . ;
 table round;
run;
The FREQ Procedure

                                  Cumulative    Cumulative
ROUND    Frequency     Percent     Frequency      Percent
    1         543       21.44           543        21.44
    2         510       20.13          1053        41.57
    3         509       20.09          1562        61.67
    4         497       19.62          2059        81.29
    5         474       18.71          2533       100.00
Table 2.8, page 70.
proc sql;
 create table cog as
  select id,
         sum((ravens ne .)) as observed_raven
  from cognitive
  group by id;
quit;

proc freq data = cog;
 table observed_raven;
run;

The FREQ Procedure

                                           Cumulative    Cumulative
observed_raven    Frequency     Percent     Frequency      Percent
             1           8        1.48             8         1.48
             2          21        3.89            29         5.37
             3          16        2.96            45         8.33
             4          40        7.41            85        15.74
             5         455       84.26           540       100.00
Figure 2.25, page 71.
proc univariate data = cognitive noprint;
 histogram relmonth / midpoints=-2.75 to 24.75 by .5;
run;
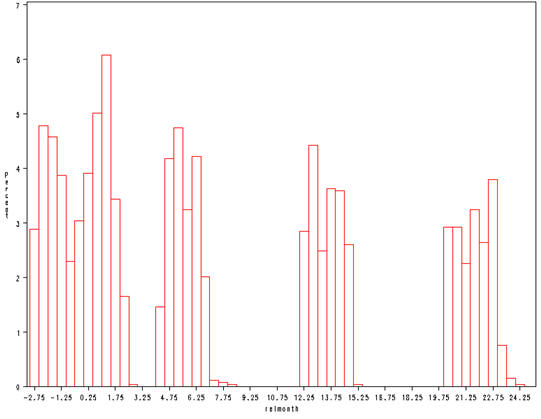
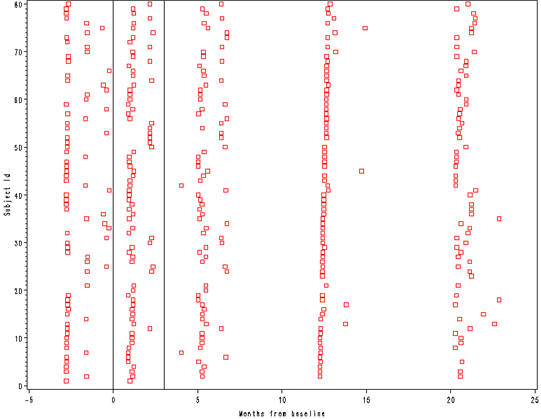
Figure 2.26, page 72.
goptions reset = all ;
 axis1 label=(a=0 'Months from baseline') order = (-5 to 25 by 5) minor=none;
 axis2 label = (a=90 'Subject Id');
 symbol1 value=square color=red;

proc gplot data=cognitive;
  where id le 80;
  plot id*relmonth / haxis = axis1 vaxis=axis2 href = 0 3;
run; quit;