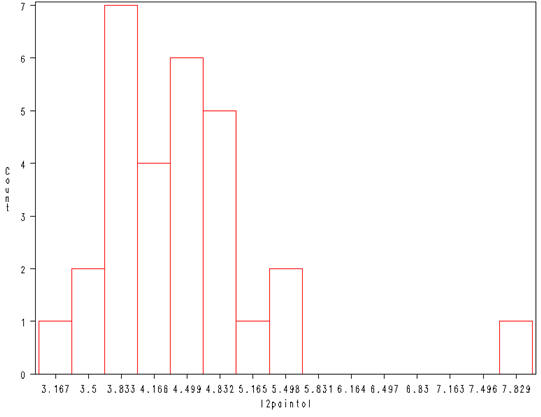
Figure 3.1, page 87.
(a)
proc print data = pain;
  where paintol = .;
run;

data pain; set pain;
  where id not in (4, 18, 20, 33, 42, 44);
run;

proc sort data = pain;
  by id cs;
run;

proc means data = pain;
  where trial ne 4;
  by id cs;
  var l2paintol;
  output out = pain2;
run;

data pain2; set pain2;
  if _STAT_ = "MEAN";
  rename _STAT_ = l2paintol;
  keep l2paintol id cs;
run;

proc univariate data = pain2 noprint;
  where cs = "attender";
  histogram l2paintol /  midpoints=3.167 to 7.833 by .333 vscale = count;
run;
(b)
proc univariate data = pain2 noprint;
 where cs = "distracter";
 histogram l2paintol /  midpoints=3.167 to 7.833 by .333 vscale = count;
run;
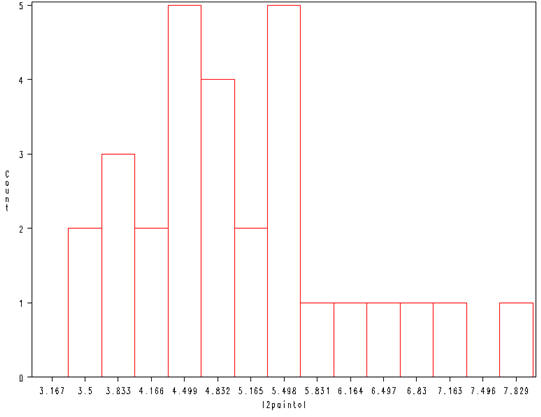
Table 3.1, page 88.
proc ttest data = pain2;
  class cs;
  var l2paintol;
run;
The TTEST Procedure

                                           Statistics

                              Lower CL          Upper CL  Lower CL           Upper CL
Variable   cs              N      Mean    Mean      Mean   Std Dev  Std Dev   Std Dev  Std Err

l2paintol  attender       29    4.1384   4.473    4.8075    0.6979   0.8795    1.1895   0.1633
l2paintol  distracter     29    4.6601  5.0762    5.4923    0.8681   1.0939    1.4794   0.2031
l2paintol  Diff (1-2)           -1.125  -0.603    -0.081    0.8379   0.9925    1.2175   0.2606

                               T-Tests

Variable     Method           Variances      DF    t Value    Pr > |t|

l2paintol    Pooled           Equal          56      -2.31      0.0243
l2paintol    Satterthwaite    Unequal      53.5      -2.31      0.0245

                    Equality of Variances

Variable     Method      Num DF    Den DF    F Value    Pr > F

l2paintol    Folded F        28        28       1.55    0.2544
Table 3.2, page 89.
data transform;
  input l2seconds;
  datalines;
  .6
  .88
  1.09
  4.47
  5.08
  3
  4
  5
  6
  7
  8
  ;
run;

data transform; set transform;
  seconds = 2 ** l2seconds;
run;

proc print data = transform;
run;
Obs    l2seconds    seconds

  1       0.60        1.516
  2       0.88        1.840
  3       1.09        2.129
  4       4.47       22.162
  5       5.08       33.825
  6       3.00        8.000
  7       4.00       16.000
  8       5.00       32.000
  9       6.00       64.000
 10       7.00      128.000
 11       8.00      256.000
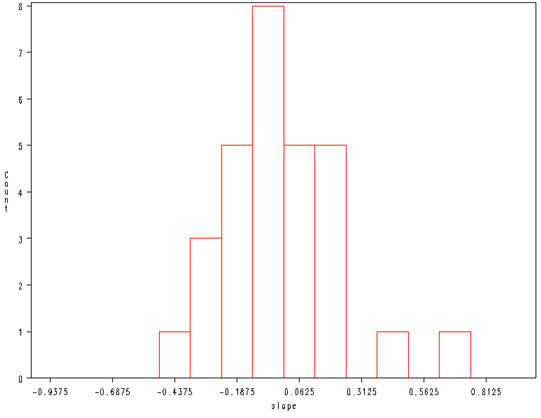
Figure 3.2, page 90.
(a) Follows formula from page 89
proc means data = pain;
  var l2paintol trial;
run;

data pain; set pain;
  ystar = l2paintol - 4.7730379;
  tstar = (trial - 2.5);
  tstar2 = (tstar) * (tstar);
  ytstar = ystar * tstar;
run;

proc sort data = pain;
  by id treatment cs;
run;

proc means data = pain sum;
	by id treatment cs;
	var ytstar tstar2;
	output out = pain3;
run;

data pain3; set pain3;
  where _STAT_ = "MEAN";
  drop _FREQ_ _STAT_ _TYPE_;
  ytstar = 4 * ytstar;
  tstar2 = 4 * tstar2;
  slope = ytstar / tstar2;
run;

proc univariate data = pain3 noprint;
  where cs = "attender";
  histogram slope / midpoints=-.9375 to 0.9375 by .125  vscale = count RTINCLUDE;
run;
(b)
proc univariate data = pain3 noprint;
  where cs = "distracter";
  histogram slope / midpoints=-.9375 to 0.9375 by .125  vscale = count RTINCLUDE;
run;
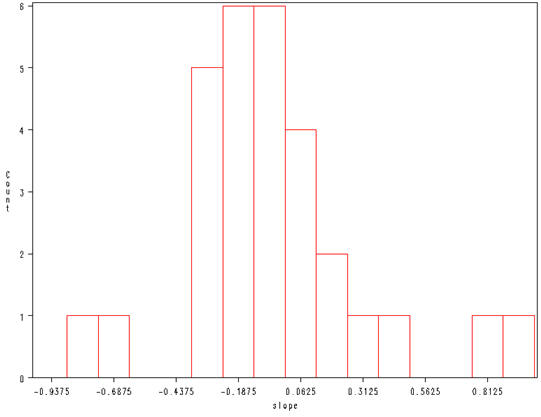
Table 3.3, page 90.
proc ttest data = pain3;
  class cs;
  var slope;
run;
The TTEST Procedure

                                          Statistics

                             Lower CL          Upper CL  Lower CL           Upper CL
Variable  cs              N      Mean    Mean      Mean   Std Dev  Std Dev   Std Dev  Std Err

slope     attender       29    -0.109  -0.017    0.0739    0.1904   0.2399    0.3245   0.0446
slope     distracter     29    -0.187  -0.046    0.0959    0.2954   0.3722    0.5034   0.0691
slope     Diff (1-2)           -0.136  0.0283     0.193    0.2644   0.3131    0.3841   0.0822

                               T-Tests

Variable    Method           Variances      DF    t Value    Pr > |t|

slope       Pooled           Equal          56       0.34      0.7324
slope       Satterthwaite    Unequal      47.8       0.34      0.7326

                    Equality of Variances

Variable    Method      Num DF    Den DF    F Value    Pr > F

slope       Folded F        28        28       2.41    0.0234
Figure 3.3, page 91.
data pain3; set pain3;
  if cs = "attender" then do;
    if treatment = "attend" then cst = "AA";
    else if treatment = "distract" then cst = "AD";
    else cst = "AN";
  end;
  if cs = "distracter" then do;
    if treatment = "attend" then cst = "DA";
    else if treatment = "distract" then cst = "DD";
    else cst = "DN";
  end;
run;

proc sort data = pain3;
  by cst;
run;

proc boxplot data = pain3;
  plot slope * cst;
run;
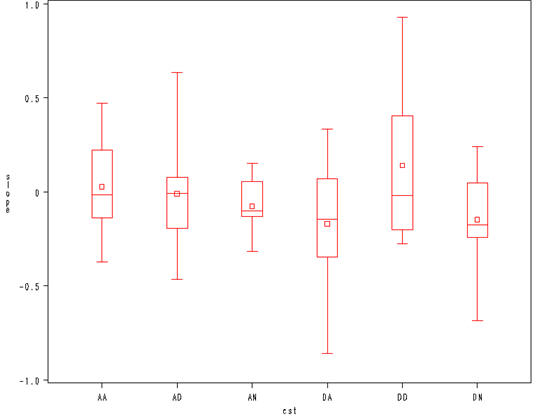
Table 3.4, page 92.
data t2; set pain;
  where trial = 2;
  keep id cs treatment l2paintol;
run;

data t4; set pain;
  where trial = 4;
  keep id cs treatment l2paintol;
run;

data t2; set t2;
  rename l2paintol = l2pt2;
run;

data t4; set t4;
  rename l2paintol = l2pt4;
run;

proc sort data = t2;
  by id;
run;

proc sort data = t4;
  by id;
run;

data pain24; merge t2 t4;
  by id;
  if cs = "attender" then do;
    if treatment = "attend" then cst = "AA";
    else if treatment = "distract" then cst = "AD";
    else cst = "AN";
  end;
  if cs = "distracter" then do;
    if treatment = "attend" then cst = "DA";
    else if treatment = "distract" then cst = "DD";
    else cst = "DN";
  end;
run;

proc sort data = pain24;
  by cst;
run;

proc ttest data = pain24;
  paired l2pt4 * l2pt2;
  by cst;
run;
[…output omitted…]
Figure 3.4, page 93.
data pain24; set pain24;
  diff = l2pt4 - l2pt2;
run;

proc sort data = pain24;
  by cst;
run;

proc boxplot data = pain24;
  plot diff * cst;
run;
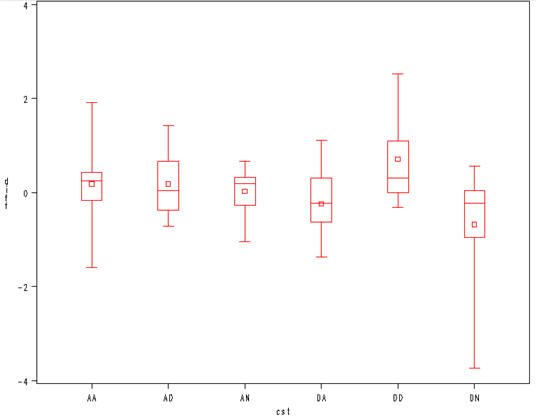
Table 3.5, page 93.
data AAAN DDDN; set pain24;
  if cst in ("AA" "AN") then output AAAN;
  if cst in ("DD" "DN") then output DDDN;
run;

proc ttest data = AAAN;
  class CST;
  var diff;
run;
The TTEST Procedure

                                          Statistics

                             Lower CL          Upper CL  Lower CL           Upper CL
Variable  cst             N      Mean    Mean      Mean   Std Dev  Std Dev   Std Dev  Std Err

diff      AA             10    -0.445  0.1819    0.8085    0.6025   0.8759     1.599    0.277
diff      AN              9    -0.393  0.0284    0.4501    0.3706   0.5486     1.051   0.1829
diff      Diff (1-2)           -0.564  0.1536     0.871    0.5554   0.7401    1.1096   0.3401

                               T-Tests

Variable    Method           Variances      DF    t Value    Pr > |t|

diff        Pooled           Equal          17       0.45      0.6573
diff        Satterthwaite    Unequal      15.3       0.46      0.6501

                    Equality of Variances

Variable    Method      Num DF    Den DF    F Value    Pr > F

diff        Folded F         9         8       2.55    0.2022
proc ttest data = DDDN;
  class CST;
  var diff;
run;
The TTEST Procedure

                                          Statistics

                             Lower CL          Upper CL  Lower CL           Upper CL
Variable  cst             N      Mean    Mean      Mean   Std Dev  Std Dev   Std Dev  Std Err

diff      DD             11    0.0682  0.7153    1.3625    0.6731   0.9633    1.6906   0.2905
diff      DN              8      -1.8  -0.679    0.4427    0.8868   1.3413    2.7299   0.4742
diff      Diff (1-2)            0.282   1.394    2.5061    0.8512   1.1343    1.7005   0.5271

                               T-Tests

Variable    Method           Variances      DF    t Value    Pr > |t|

diff        Pooled           Equal          17       2.64      0.0170
diff        Satterthwaite    Unequal        12       2.51      0.0275

                    Equality of Variances

Variable    Method      Num DF    Den DF    F Value    Pr > F

diff        Folded F         7        10       1.94    0.3303