The data files can be downloaded from
http://rem.ph.ucla.edu/~rob/mld/data.html .
Table 5.1, page 121.
proc means data=smallmice mean stderr;
 var weight;
 class day;
run;

The MEANS Procedure
            Analysis Variable : weight
                  N
         day    Obs            Mean       Std Error
---------------------------------------------------
           2     14     206.2857143       7.9569091
           5     14     376.9285714      12.7414976
           8     14     545.1428571      15.5852343
          11     14     684.2857143      27.4036631
          14     14     801.7142857      35.7411987
          17     14     864.4285714      36.6791425
          20     14     945.2857143      32.2497855
---------------------------------------------------
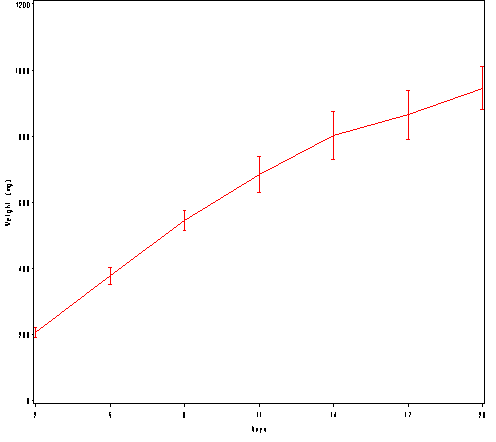
Figure 5.1, page 122.
goptions reset = all ;
 axis1 order =(2 to 20 by 3) label=(a=0 'Days') minor=none;
 axis2 order = (0 to 1200 by 200) label = (a=90 'Weight (mg)') minor=none ;
 symbol1 interpol=std2mjt v=none color=red r=1;

proc gplot data=smallmice;
  plot weight*day / haxis = axis1 vaxis=axis2;
run; quit;
Table 5.2, page 132.
data small;
 set smallmice;
 cont_day = day;
 cont_day2 = day**2;
 cont_day3 = day**3;
run;

proc mixed data = small method = reml;
 class id day;
 model weight = cont_day/ solution ddfm = bw;
 repeated day/ subject=id type = unstructured;
run;

[...output omitted...]
                   Solution for Fixed Effects
                         Standard
Effect       Estimate       Error      DF    t Value    Pr > |t|
Intercept      104.76      4.3891      13      23.87      <.0001
cont_day      41.4580      1.2904      13      32.13      <.0001

proc mixed data = small method = reml;
 class id day;
 model weight = cont_day cont_day2/ solution ddfm = bw;
 repeated day/ subject=id type = unstructured;
run;

[...output omitted...]
                   Solution for Fixed Effects
                         Standard
Effect       Estimate       Error      DF    t Value    Pr > |t|
Intercept     89.5909      4.5755      13      19.58      <.0001
cont_day      64.1899      2.3275      13      27.58      <.0001
cont_day2     -1.1105     0.09463      13     -11.74      <.0001

proc mixed data = small method = reml;
 class id day;
 model weight = cont_day cont_day2 cont_day3/ solution ddfm = bw;
 repeated day/ subject=id type = unstructured;
run;

[...output omitted...]
                   Solution for Fixed Effects
                         Standard
Effect       Estimate       Error      DF    t Value    Pr > |t|
Intercept     92.3225      5.8909      13      15.67      <.0001
cont_day      60.1419      5.9710      13      10.07      <.0001
cont_day2     -0.4181      0.9452      13      -0.44      0.6655
cont_day3    -0.02369     0.03218      13      -0.74      0.4747
Table 5.3, page 132.
proc mixed data = small method = reml;
 class id day;
 model weight = cont_day cont_day2/ solution ddfm = bw covb;
 repeated day/ subject=id type = unstructured;
run;

[...output omitted...]

         Covariance Matrix for Fixed Effects
 Row    Effect           Col1        Col2        Col3
   1    Intercept     20.9351     -1.8105      0.1222
   2    cont_day      -1.8105      5.4173     -0.1833
   3    cont_day2      0.1222     -0.1833    0.008954
Table 5.4, page 133.
Left side of table only.
proc mixed data = small method = reml;
 class id day;
 model weight = cont_day cont_day2/ solution ddfm = bw  outpredm = smallpred;
 repeated day/ subject=id type = unstructured ;
run;

proc means data =smallpred mean ;
 class day;
 var pred stderrpred;
run;

The MEANS Procedure
                  N
         day    Obs    Variable      Label                     Mean
-------------------------------------------------------------------
           2     14    Pred          Predicted Mean     213.5288267
                       StdErrPred    Std Err Pred         5.7922990
           5     14    Pred          Predicted Mean     382.7788698
                       StdErrPred    Std Err Pred        10.2051734
           8     14    Pred          Predicted Mean     532.0406668
                       StdErrPred    Std Err Pred        14.2582268
          11     14    Pred          Predicted Mean     661.3142178
                       StdErrPred    Std Err Pred        17.5878149
          14     14    Pred          Predicted Mean     770.5995228
                       StdErrPred    Std Err Pred        20.4445870
          17     14    Pred          Predicted Mean     859.8965817
                       StdErrPred    Std Err Pred        23.2891950
          20     14    Pred          Predicted Mean     929.2053946
                       StdErrPred    Std Err Pred        26.7038265
-------------------------------------------------------------------

