Table 7.2, page 182.
Log base 2 scale only.
proc mixed data = pain method= reml noitprint noclprint noinfo;
 class id cs trial;
 model l2paintol = cs / solution notest;
 repeated trial/ subject = id type = unstructured;
run;

The Mixed Procedure

Covariance Parameter Estimates
Cov Parm    Subject    Estimate
UN(1,1)     id           1.0065
UN(2,1)     id           0.7482
UN(2,2)     id           1.1281
UN(3,1)     id           0.9522
UN(3,2)     id           0.8736
UN(3,3)     id           1.3423
UN(4,1)     id           0.6725
UN(4,2)     id           0.7908
UN(4,3)     id           1.0022
UN(4,4)     id           1.3071

           Fit Statistics
-2 Res Log Likelihood           568.4
AIC (smaller is better)         588.4
AICC (smaller is better)        589.4
BIC (smaller is better)         610.0

  Null Model Likelihood Ratio Test
    DF    Chi-Square      Pr > ChiSq
     9        170.12          <.0001

                          Solution for Fixed Effects
             coping                    Standard
Effect       style         Estimate       Error      DF    t Value    Pr > |t|
Intercept                    5.0770      0.1620      62      31.35      <.0001
cs           attender       -0.5054      0.2291      62      -2.21      0.0311
cs           distracter           0           .       .        .         .
Table 7.3, page 184.
NOTE: The downloadable dataset "cognitive" does not match the one used for this analysis. The author was contacted and provided this version of the cognitive dataset: https://stats.idre.ucla.edu/wp-content/uploads/2016/02/cognitive_v2.sas7bdat .
proc mixed data = cognitive_v2 method= reml  noitprint noclprint ;
 class id sex;
 model ravens = sex ses / solution notest;
repeated  / type=sp(pow)(relyear) subject=id;
run;

The Mixed Procedure

                  Model Information

Data Set                     WORK.COGNITIVE
Dependent Variable           RAVENS
Covariance Structure         Spatial Power
Subject Effect               ID
Estimation Method            REML
Residual Variance Method     Profile
Fixed Effects SE Method      Model-Based
Degrees of Freedom Method    Between-Within


            Dimensions

Covariance Parameters             2
Columns in X                      4
Columns in Z                      0
Subjects                        529
Max Obs Per Subject               5


          Number of Observations

Number of Observations Read            2533
Number of Observations Used            2498
Number of Observations Not Used          35


 Covariance Parameter Estimates

Cov Parm     Subject    Estimate

SP(POW)      ID          0.04977
Residual                  8.8771


           Fit Statistics

-2 Res Log Likelihood         12290.3
AIC (smaller is better)       12294.3
AICC (smaller is better)      12294.3
BIC (smaller is better)       12302.9


  Null Model Likelihood Ratio Test

    DF    Chi-Square      Pr > ChiSq

     1        163.87          <.0001

                       Solution for Fixed Effects

                                 Standard
Effect       SEX     Estimate       Error      DF    t Value    Pr > |t|

Intercept             17.5755      0.2761     526      63.65      <.0001
SEX          boy       0.6223      0.1461     526       4.26      <.0001
SEX          girl           0           .       .        .         .
ses                  0.006100    0.003066     526       1.99      0.0472
Table 7.4, page 188.
Results for the first four columns only.
data weight;
 set weight1;
 week_cont = week;
run;

proc means data = weight n mean;
 class week;
 var weight;
run;

The MEANS Procedure
        Analysis Variable : weight
                  N
        week    Obs      N            Mean
------------------------------------------
           1     38     38     192.7815789
           2     38     38     193.5631579
           3     38     38     190.9342105
           4     38     38     187.9605263
           5     38     33     185.8484848
           6     38     31     190.8064516
           7     38     25     188.4080000
           8     38     24     190.3333333
------------------------------------------

proc mixed data = weight method = reml noitprint noinfo noclprint;
 class id week;
 model weight = week / solution notest noint;
 repeated week/ subject = id type =cs;
 random intercept week_cont/ subject=id type = un;
run;

[...output omitted...]

                     Solution for Fixed Effects
                              Standard
Effect    week    Estimate       Error      DF    t Value    Pr > |t|
week      1         192.78      4.1996     183      45.91      <.0001
week      2         193.56      4.1693     183      46.43      <.0001
week      3         190.93      4.1427     183      46.09      <.0001
week      4         187.96      4.1198     183      45.62      <.0001
week      5         186.64      4.1028     183      45.49      <.0001
week      6         188.11      4.0892     183      46.00      <.0001
week      7         186.90      4.0833     183      45.77      <.0001
week      8         185.34      4.0791     183      45.44      <.0001
Table 7.5, page 190.
proc mixed data = weight method = reml noitprint noinfo noclprint;
 class id week;
 model weight = week / notest noint;
 repeated week/ subject = id type =cs;
 random intercept week_cont/ subject=id type = cs;
  estimate "2 vs 1" week -1 1 0 0 0 0 0 0;
  estimate "3 vs 1" week -1 0 1 0 0 0 0 0;
  estimate "4 vs 1" week -1 0 0 1 0 0 0 0;
  estimate "5 vs 1" week -1 0 0 0 1 0 0 0;
  estimate "6 vs 1" week -1 0 0 0 0 1 0 0;
  estimate "7 vs 1" week -1 0 0 0 0 0 1 0;
  estimate "8 vs 1" week -1 0 0 0 0 0 0 1;

  estimate "2 vs 1" week -1 1 0 0 0 0 0 0;
  estimate "3 vs 2" week 0 -1 1 0 0 0 0 0;
  estimate "4 vs 3" week 0 0 -1 1 0 0 0 0;
  estimate "5 vs 4" week 0 0 0 -1 1 0 0 0;
  estimate "6 vs 5" week 0 0 0 0 -1 1 0 0;
  estimate "7 vs 6" week 0 0 0 0 0 -1 1 0;
  estimate "8 vs 7" week 0 0 0 0 0 0 -1 1;
run;

The Mixed Procedure

 Covariance Parameter Estimates
Cov Parm     Subject    Estimate
Variance     id           6.3352
CS           id          -5.7264
CS           id           677.34
Residual                  3.0679

           Fit Statistics
-2 Res Log Likelihood          1383.9
AIC (smaller is better)        1391.9
AICC (smaller is better)       1392.1
BIC (smaller is better)        1398.5

  Null Model Likelihood Ratio Test
    DF    Chi-Square      Pr > ChiSq
     3       1038.02          <.0001

                          Estimates
                      Standard
Label     Estimate       Error      DF    t Value    Pr > |t|
2 vs 1      0.7816      0.4213     183       1.86      0.0652
3 vs 1     -1.8474      0.4749     183      -3.89      0.0001
4 vs 1     -4.8211      0.5529     183      -8.72      <.0001
5 vs 1     -6.1440      0.6601     183      -9.31      <.0001
6 vs 1     -4.6689      0.7703     183      -6.06      <.0001
7 vs 1     -5.8820      0.9024     183      -6.52      <.0001
8 vs 1     -7.4452      1.0244     183      -7.27      <.0001
2 vs 1      0.7816      0.4213     183       1.86      0.0652
3 vs 2     -2.6289      0.4213     183      -6.24      <.0001
4 vs 3     -2.9737      0.4213     183      -7.06      <.0001
5 vs 4     -1.3229      0.4420     183      -2.99      0.0031
6 vs 5      1.4750      0.4671     183       3.16      0.0019
7 vs 6     -1.2131      0.5130     183      -2.36      0.0191
8 vs 7     -1.5632      0.5435     183      -2.88      0.0045
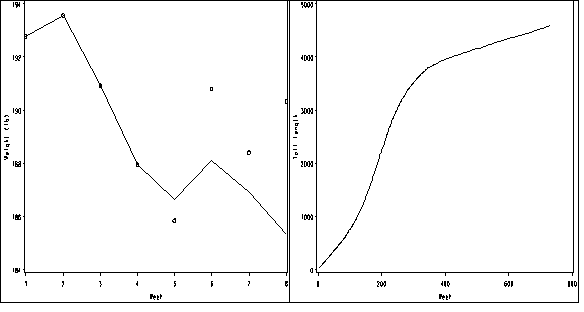
Figure 7.3 (a), page 191.
Note Figure 7.3(b)-(c) are hypothetical data. Hence, they are not reproduced.
proc mixed data = weight method = reml noitprint noinfo noclprint;
 class id week;
 model weight = week / notest noint outpredm=pred_weight;
 repeated week/ subject = id type =cs;
 random intercept week_cont/ subject=id type = cs;
run;

proc sql;
 create table summary_means as
  select week,
         mean(weight) as sample_mean,
         mean(pred) as pred_mean
  from pred_weight
  group by week;
quit;

goptions reset = all;
 symbol1 value=circle color=black;
 symbol2 value=none interpol = join repeat = 1;
 axis1 order =(1 to 8 by 1) label=(a=0 'Week') minor=none;
 axis2 order =(184 to 194 by 2) label = (a=90 'Weight (lb)') minor=none ;

proc gplot data = summary_means;
 plot (sample_mean pred_mean)*week /overlay haxis=axis1 vaxis=axis2 name = 'f7_3a';
run; quit;

proc loess data=wallaby;
  model tail=agedays /smooth=0.4;
  ods output OutputStatistics=smoothed_mean;
run; quit;

proc sort data = smoothed_mean;
 by agedays;
run;

goptions reset = all;
 symbol1 value=none interpol=join r=1;
 axis1 order =(0 to 800 by 200) label=(a=0 'Week') minor=none;
 axis2 order =(0 to 5000 by 1000) value = ('0' '1000' '2000' '3000' '4000' '5000')
    label = (a=90 'Tail length') minor=none ;

proc gplot data = smoothed_mean;
 plot pred*agedays/ haxis=axis1 vaxis=axis2 name = 'f7_3d';
run; quit;

proc greplay igout = work.gseg tc=sashelp.templt template=h2 nofs;
 treplay 1:f7_3a 2:f7_3d;
run; quit;
Table 7.6, page 199.
data pain1;
 set pain;
 tmt_a = (treatment = "attend")*(trial = 4);
 tmt_d = (treatment = "distract")*(trial = 4);
 tmt_n = (treatment = "no directions")*(trial = 4);
 distracter = (cs = "distracter");
run;

proc mixed data = pain1 method = reml noinfo noclprint noitprint;
 class id trial;
 model l2paintol = distracter tmt_a tmt_d tmt_n/ solution notest ;
 repeated trial / subject = id type = cs;
  estimate 'treatment d-a' tmt_d 1 tmt_a -1;
  estimate 'treatment d-n' tmt_d 1 tmt_n -1;
  estimate 'treatment a-n' tmt_a 1 tmt_n -1;

  estimate 'ab' intercept 1;
  estimate 'db' intercept 1 distracter 1;

  estimate 'aa' intercept 1 tmt_a 1;
  estimate 'ad' intercept 1 tmt_d 1;
  estimate 'an' intercept 1 tmt_n 1;
  estimate 'da' intercept 1 distracter 1 tmt_a 1;
  estimate 'dd' intercept 1 distracter 1 tmt_d 1;
  estimate 'dn' intercept 1 distracter 1 tmt_n 1;
run;

The Mixed Procedure

 Covariance Parameter Estimates
Cov Parm     Subject    Estimate
CS           id           0.8149
Residual                  0.3485

           Fit Statistics
-2 Res Log Likelihood           587.5
AIC (smaller is better)         591.5
AICC (smaller is better)        591.5
BIC (smaller is better)         595.8

  Null Model Likelihood Ratio Test
    DF    Chi-Square      Pr > ChiSq
     1        146.69          <.0001

                   Solution for Fixed Effects
                          Standard
Effect        Estimate       Error      DF    t Value    Pr > |t|
Intercept       4.5436      0.1701      62      26.71      <.0001
distracter      0.4545      0.2385      62       1.91      0.0613
tmt_a          -0.1217      0.1508     178      -0.81      0.4206
tmt_d           0.3203      0.1472     178       2.18      0.0309
tmt_n          -0.2922      0.1525     178      -1.92      0.0569

                             Estimates
                             Standard
Label            Estimate       Error      DF    t Value    Pr > |t|
treatment d-a      0.4421      0.2096     178       2.11      0.0364
treatment d-n      0.6126      0.2108     178       2.91      0.0041
treatment a-n      0.1705      0.2133     178       0.80      0.4251
ab                 4.5436      0.1701      62      26.71      <.0001
db                 4.9980      0.1699      62      29.42      <.0001
aa                 4.4218      0.2191     178      20.18      <.0001
ad                 4.8639      0.2170     178      22.41      <.0001
an                 4.2513      0.2198     178      19.34      <.0001
da                 4.8763      0.2190     178      22.27      <.0001
dd                 5.3184      0.2161     178      24.61      <.0001
dn                 4.7058      0.2190     178      21.49      <.0001
Table 7.7, page 200.
data pain2;
 set pain1;
  tmt = "Z";
  if trial = 4 and treatment = "attend" then tmt = "A";
  if trial = 4 and treatment = "distract" then tmt = "D";
  if trial = 4 and treatment = "no directions" then tmt = "N";
run;

proc mixed data = pain2 method = reml  noinfo noclprint noitprint;
 class id trial cs tmt ;
 model l2paintol = cs tmt / solution corrb notest ;
 repeated trial/ subject = id type = cs;
run;

The Mixed Procedure

 Covariance Parameter Estimates
Cov Parm     Subject    Estimate
CS           id           0.8149
Residual                  0.3485

           Fit Statistics
-2 Res Log Likelihood           587.5
AIC (smaller is better)         591.5
AICC (smaller is better)        591.5
BIC (smaller is better)         595.8

  Null Model Likelihood Ratio Test
    DF    Chi-Square      Pr > ChiSq
     1        146.69          <.0001

                             Solution for Fixed Effects
             coping                           Standard
Effect       style         tmt    Estimate       Error      DF    t Value    Pr > |t|
Intercept                           4.9980      0.1699      62      29.42      <.0001
cs           attender              -0.4545      0.2385      62      -1.91      0.0613
cs           distracter                  0           .       .        .         .
tmt                        A       -0.1217      0.1508      58      -0.81      0.4228
tmt                        D        0.3203      0.1472      58       2.18      0.0336
tmt                        N       -0.2922      0.1525      58      -1.92      0.0602
tmt                        Z             0           .       .        .         .

                            Correlation Matrix for Fixed Effects
                 coping
 Row  Effect     style       tmt      Col1      Col2      Col3      Col4      Col5      Col6
   1  Intercept                     1.0000   -0.7010            -0.07142  -0.07654  -0.08005
   2  cs         attender          -0.7010    1.0000            -0.00012  0.004686  0.003969
   3  cs         distracter                             1.0000
   4  tmt                    A    -0.07142  -0.00012              1.0000   0.01030   0.01086
   5  tmt                    D    -0.07654  0.004686             0.01030    1.0000   0.01115
   6  tmt                    N    -0.08005  0.003969             0.01086   0.01115    1.0000
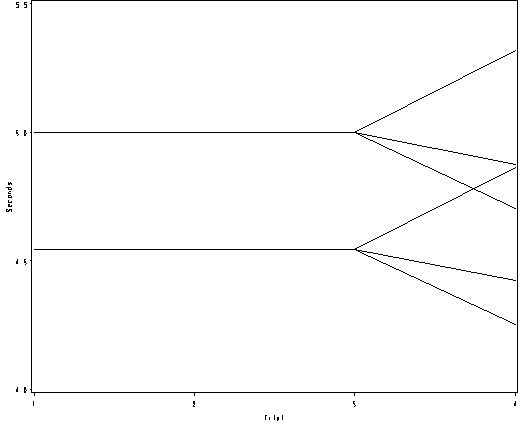
Figure 7.5(a), page 201.
Note y-axis in the graph is not back transformed.
proc mixed data = pain2 method = reml noinfo noclprint noitprint;
 class id trial;
 model l2paintol = distracter tmt_a tmt_d tmt_n/ solution notest outpredm=pain_pred;
 repeated trial / subject = id type = cs;
run;

proc sql;
 create table pain_mean as
  select trial, distracter, treatment,
   mean(pred) as pred_mean
 from pain_pred
 group by trial, distracter, treatment;
quit;

data pain_mean;
 set pain_mean;
  dt = distracter || treatment;
proc print; run;

goptions reset = all;
 symbol1 value=none color = black interpol=join r=6;
 axis1 order =(1 2 3 4) label=(a=0 'Trial') minor=none;
 axis2 order =(4 to 5.5 by .5) label = (a=90 'Seconds') minor=none ;

proc gplot data = pain_mean;
 plot pred_mean*trial =dt /haxis=axis1 vaxis = axis2 nolegend;
run; quit;
Table 7.8, page 204.
data pain3;
 set pain2;
 attend = (cs = "attender");
run;

proc mixed data = pain3 method = reml noinfo noclprint noitprint ;
 class id trial;
 model l2paintol = attend tmt_a tmt_d tmt_n attend*tmt_a attend*tmt_d attend*tmt_n/ solution notest;
 repeated trial / subject = id type = cs;
 *Second section;
  estimate 'tmt aa' tmt_a 1 attend*tmt_a 1 ;
  estimate 'tmt ad' tmt_d 1 attend*tmt_d 1;
  estimate 'tmt an' tmt_n 1 attend*tmt_n 1;
  estimate 'tmt da' tmt_a 1;
  estimate 'tmt dd' tmt_d 1;
  estimate 'tmt dn' tmt_n 1;
 *Third section;
  estimate 'tmt a da' tmt_d 1 attend*tmt_d 1 tmt_a -1 attend*tmt_a -1;
  estimate 'tmt a dn' tmt_d 1 attend*tmt_d 1 tmt_n -1 attend*tmt_n -1;
  estimate 'tmt a an' tmt_a 1 attend*tmt_a 1 tmt_n -1 attend*tmt_n -1;
  estimate 'tmt d da' tmt_d 1 tmt_a -1;
  estimate 'tmt d dn' tmt_d 1 tmt_n -1;
  estimate 'tmt d an' tmt_a 1 tmt_n -1;
 *Fourth section;
  estimate 'ab' intercept 1 attend 1;
  estimate 'db' intercept 1;
 *Fifth section;
  estimate 'aa' intercept 1 attend 1 tmt_a 1 attend*tmt_a 1;
  estimate 'ad' intercept 1 attend 1 tmt_d 1 attend*tmt_d 1;
  estimate 'an' intercept 1 attend 1 tmt_n 1 attend*tmt_n 1;
  estimate 'da' intercept 1 tmt_a 1;
  estimate 'dd' intercept 1 tmt_d 1;
  estimate 'dn' intercept 1 tmt_n 1;
  ods output Estimates = est;
run;

The Mixed Procedure

 Covariance Parameter Estimates
Cov Parm     Subject    Estimate
CS           id           0.7937
Residual                  0.3432

           Fit Statistics
-2 Res Log Likelihood           581.9
AIC (smaller is better)         585.9
AICC (smaller is better)        586.0
BIC (smaller is better)         590.3

  Null Model Likelihood Ratio Test
    DF    Chi-Square      Pr > ChiSq
     1        142.92          <.0001

                    Solution for Fixed Effects
                            Standard
Effect          Estimate       Error      DF    t Value    Pr > |t|
Intercept         5.0106      0.1692      62      29.62      <.0001
attend           -0.4780      0.2393      62      -2.00      0.0502
tmt_a            -0.3518      0.2116     175      -1.66      0.0982
tmt_d             0.5761      0.2019     175       2.85      0.0048
tmt_n            -0.4818      0.2154     175      -2.24      0.0266
attend*tmt_a      0.4599      0.2993     175       1.54      0.1261
attend*tmt_d     -0.5371      0.2924     175      -1.84      0.0680
attend*tmt_n      0.3736      0.3027     175       1.23      0.2187

                           Estimates
                        Standard
Label       Estimate       Error      DF    t Value    Pr > |t|
tmt aa        0.1082      0.2116     175       0.51      0.6098
tmt ad       0.03895      0.2116     175       0.18      0.8542
tmt an       -0.1082      0.2126     175      -0.51      0.6114
tmt da       -0.3518      0.2116     175      -1.66      0.0982
tmt dd        0.5761      0.2019     175       2.85      0.0048
tmt dn       -0.4818      0.2154     175      -2.24      0.0266
tmt a da    -0.06924      0.2977     175      -0.23      0.8164
tmt a dn      0.1472      0.2984     175       0.49      0.6225
tmt a an      0.2164      0.2984     175       0.73      0.4693
tmt d da      0.9278      0.2909     175       3.19      0.0017
tmt d dn      1.0579      0.2934     175       3.61      0.0004
tmt d an      0.1301      0.3002     175       0.43      0.6653
ab            4.5326      0.1693      62      26.77      <.0001
db            5.0106      0.1692      62      29.62      <.0001
aa            4.6408      0.2573     175      18.03      <.0001
ad            4.5715      0.2573     175      17.77      <.0001
an            4.4244      0.2576     175      17.18      <.0001
da            4.6589      0.2573     175      18.11      <.0001
dd            5.5867      0.2493     175      22.41      <.0001
dn            4.5288      0.2584     175      17.53      <.0001
Figure 7.6, page 205.
Note: Order of horizontal axis here does not match that in book.
data est2; set est;
 where label in ("ab" "aa" "ad" "an" "db" "da" "dd" "dn");
 Est_new = 2**Estimate;
 CI_lower = Estimate - 1.9934627*(StdErr);
 CI_upper = Estimate + 1.9934627*(StdErr);
 CI_lnew = 2**CI_lower;
 CI_unew = 2**CI_upper;
 keep label CI_lnew CI_unew Est_new;
run;

data est3; set est2;
 hilo = CI_lnew; output;
 hilo = CI_unew; output;
 drop CI_lnew CI_unew;
run;

goptions reset=all border;
symbol1 i=hilo v=dot c=blue;
symbol2 i=none v=dot  c=white;
symbol3 i=none v=circle c=red;
axis1 offset=(2,2);

proc gplot data=est3;
plot Est_new*label hilo*label hilo*label / overlay haxis=axis1;
run;
quit;
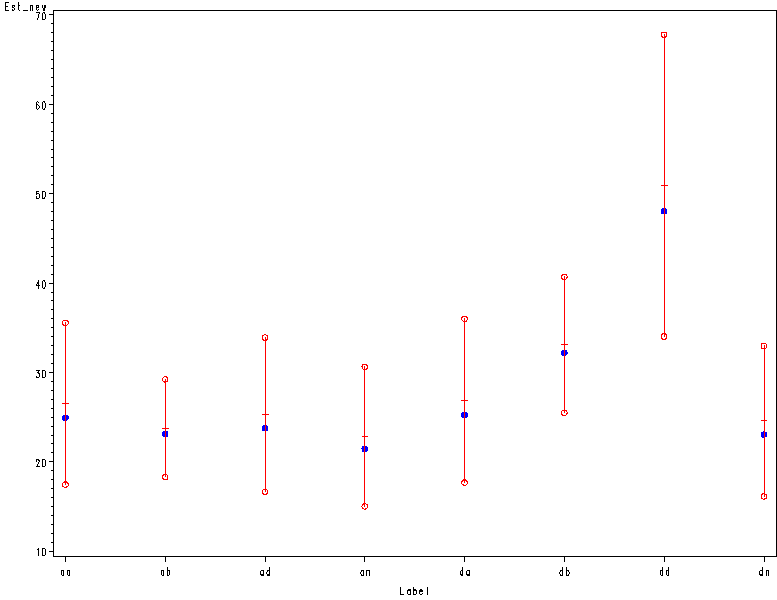
Table 7.9, page 210.
*Model (a);
proc mixed data = cognitive method= ml  noinfo noclprint noitprint;
 class id;
 model ravens = relmonth / solution notest;
 repeated / subject = id type = sp(pow)(relyear);
run;

The Mixed Procedure

 Covariance Parameter Estimates
Cov Parm     Subject    Estimate
SP(POW)      id          0.05432
Residual                  8.7852

           Fit Statistics
-2 Log Likelihood             12731.6
AIC (smaller is better)       12739.6
AICC (smaller is better)      12739.6
BIC (smaller is better)       12756.8

  Null Model Likelihood Ratio Test
    DF    Chi-Square      Pr > ChiSq
     1        171.13          <.0001

                   Solution for Fixed Effects
                         Standard
Effect       Estimate       Error      DF    t Value    Pr > |t|
Intercept     17.5635      0.1007     545     174.45      <.0001
relmonth      0.08706    0.007595    2051      11.46      <.0001

*Model (b);
proc mixed data = cognitive method= ml noinfo noclprint noitprint ;
 class id sex;
 model ravens = sex relmonth / solution notest;
 repeated / subject = id type = sp(pow)(relyear);
run;

The Mixed Procedure

 Covariance Parameter Estimates
Cov Parm     Subject    Estimate
SP(POW)      id          0.05120
Residual                  8.6928

           Fit Statistics
-2 Log Likelihood             12714.0
AIC (smaller is better)       12724.0
AICC (smaller is better)      12724.0
BIC (smaller is better)       12745.5

  Null Model Likelihood Ratio Test
    DF    Chi-Square      Pr > ChiSq
     1        164.49          <.0001

                         Solution for Fixed Effects
                                     Standard
Effect       sex         Estimate       Error      DF    t Value    Pr > |t|
Intercept                 17.2546      0.1239     544     139.29      <.0001
sex          boy           0.5978      0.1416     544       4.22      <.0001
sex          girl               0           .       .        .         .
relmonth                  0.08674    0.007547    2051      11.49      <.0001

*Model (c);
proc mixed data = cognitive method= ml noinfo noclprint noitprint ;
 class id sex;
 model ravens = relmonth relmonth*sex/ solution notest;
 repeated / subject = id type = sp(pow)(relyear);
run;

The Mixed Procedure

 Covariance Parameter Estimates
Cov Parm     Subject    Estimate
SP(POW)      id          0.05166
Residual                  8.7010

           Fit Statistics
-2 Log Likelihood             12714.9
AIC (smaller is better)       12724.9
AICC (smaller is better)      12725.0
BIC (smaller is better)       12746.5

  Null Model Likelihood Ratio Test
    DF    Chi-Square      Pr > ChiSq
     1        166.81          <.0001

                          Solution for Fixed Effects
                                        Standard
Effect          sex         Estimate       Error      DF    t Value    Pr > |t|
Intercept                    17.5655     0.09990     545     175.83      <.0001
relmonth                     0.06376    0.009443    2050       6.75      <.0001
relmonth*sex    boy          0.04394     0.01072    2050       4.10      <.0001
relmonth*sex    girl               0           .       .        .         .

*Model (d);
proc mixed data = cognitive method= ml noinfo noclprint noitprint ;
 class id sex;
 model ravens = sex|relmonth / solution notest;
 repeated / subject = id type = sp(pow)(relyear);
run;

The Mixed Procedure

 Covariance Parameter Estimates
Cov Parm     Subject    Estimate
SP(POW)      id          0.05105
Residual                  8.6828

           Fit Statistics
-2 Log Likelihood             12711.4
AIC (smaller is better)       12723.4
AICC (smaller is better)      12723.5
BIC (smaller is better)       12749.3

  Null Model Likelihood Ratio Test
    DF    Chi-Square      Pr > ChiSq
     1        164.12          <.0001

                          Solution for Fixed Effects
                                        Standard
Effect          sex         Estimate       Error      DF    t Value    Pr > |t|
Intercept                    17.3710      0.1439     544     120.72      <.0001
sex             boy           0.3744      0.1996     544       1.88      0.0612
sex             girl               0           .       .        .         .
relmonth                     0.07415     0.01094    2050       6.78      <.0001
relmonth*sex    boy          0.02397     0.01510    2050       1.59      0.1127
relmonth*sex    girl               0           .       .        .         .
Table 7.10, page 213.
data cog;
 set in.cognitive;
  newtmt = treatment;
  if relyear <0 then newtmt = "control";
run;

proc mixed data = cog method= reml noclprint noitprint noinfo;
 class id newtmt ;
 model ravens = relmonth relmonth*newtmt / solution notest outpred = cogp;
 repeated / subject = id type = sp(pow)(relyear);
 estimate 'meat'    relmonth 1 newtmt*relmonth 0 0 1 0;
 estimate 'control' relmonth 1 newtmt*relmonth 0 1 0 0;
 estimate 'calorie' relmonth 1 newtmt*relmonth 1 0 0 0;
 estimate 'milk'    relmonth 1 newtmt*relmonth 0 0 0 1;
 estimate 'meat-control'    newtmt*relmonth  0 -1  1  0;
 estimate 'meat-calorie'    newtmt*relmonth -1  0  1  0;
 estimate 'meat-milk'       newtmt*relmonth  0  0  1 -1;
 estimate 'control-calorie' newtmt*relmonth -1  1  0  0;
 estimate 'control-milk'    newtmt*relmonth  0  1  0 -1;
 estimate 'calorie-milk'    newtmt*relmonth  1  0  0 -1;
run;

The Mixed Procedure

 Covariance Parameter Estimates
Cov Parm     Subject    Estimate
SP(POW)      id          0.05247
Residual                  8.7308

           Fit Statistics
-2 Res Log Likelihood         12748.0
AIC (smaller is better)       12752.0
AICC (smaller is better)      12752.0
BIC (smaller is better)       12760.6

  Null Model Likelihood Ratio Test
    DF    Chi-Square      Pr > ChiSq
     1        168.10          <.0001

                           Solution for Fixed Effects
                                          Standard
Effect             newtmt     Estimate       Error      DF    t Value    Pr > |t|
Intercept                      17.5702      0.1005     545     174.77      <.0001
relmonth                       0.05816     0.01191    2048       4.88      <.0001
relmonth*newtmt    calorie     0.02314     0.01490    2048       1.55      0.1205
relmonth*newtmt    control     0.03547     0.01524    2048       2.33      0.0201
relmonth*newtmt    meat        0.05843     0.01523    2048       3.84      0.0001
relmonth*newtmt    milk              0           .       .        .         .

                              Estimates
                               Standard
Label              Estimate       Error      DF    t Value    Pr > |t|
meat                 0.1166     0.01233    2048       9.45      <.0001
control             0.09363     0.01185    2048       7.90      <.0001
calorie             0.08130     0.01198    2048       6.79      <.0001
milk                0.05816     0.01191    2048       4.88      <.0001
meat-control        0.02297     0.01557    2048       1.48      0.1402
meat-calorie        0.03529     0.01523    2048       2.32      0.0206
meat-milk           0.05843     0.01523    2048       3.84      0.0001
control-calorie     0.01232     0.01526    2048       0.81      0.4194
control-milk        0.03547     0.01524    2048       2.33      0.0201
calorie-milk        0.02314     0.01490    2048       1.55      0.1205
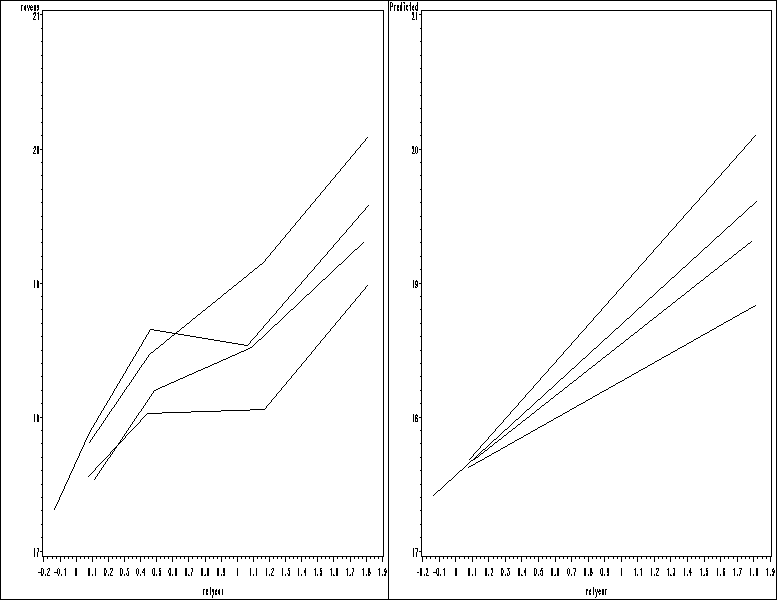
Figure 7.8, page 213.
* (a);
goptions reset = all;
 symbol1 value=none color = black interpol=join r=6;

proc sort data = cog;
	by newtmt rn;
run;
proc means data = cog;
	by newtmt rn;
	var ravens relyear;
	output out = mean_rav;
run;
data means2; set mean_rav;
	where _STAT_ = "MEAN";
run;
proc gplot data = means2;
 plot ravens*relyear = newtmt / nolegend name = 'f78_a';
run; quit;

* (b);
goptions reset = all;
 symbol1 value=none color = black interpol=join r=6;

proc sort data = cogp;
	by newtmt rn;
run;
proc means data = cogp;
	by newtmt rn;
	var pred relyear;
	output out = mean_rav;
run;
data means2; set mean_rav;
	where _STAT_ = "MEAN";
run;
proc gplot data = means2;
 plot pred*relyear = newtmt / nolegend name = 'f78_b';
run; quit;

proc greplay igout = work.gseg tc=sashelp.templt template=h2 nofs;
 treplay 1:f78_a 2:f78_b;
run; quit;
Table 7.11, page 217.
proc mixed data=cognitive method=reml covtest noitprint noclprint;
 class id;
 model ravens =age_at_time0 relyear / solution notest;
 repeated / type=sp(pow)(relyear) subject=id;
 estimate 'Age - time' relyear -1 age_at_time0 1 ;
run;

The Mixed Procedure

                  Model Information
Data Set                     COGNITIVE
Dependent Variable           ravens
Covariance Structure         Spatial Power
Subject Effect               id
Estimation Method            REML
Residual Variance Method     Profile
Fixed Effects SE Method      Model-Based
Degrees of Freedom Method    Between-Within

            Dimensions
Covariance Parameters             2
Columns in X                      3
Columns in Z                      0
Subjects                        542
Max Obs Per Subject               5


          Number of Observations
Number of Observations Read            2730
Number of Observations Used            2593
Number of Observations Not Used         137

                  Covariance Parameter Estimates
                                    Standard         Z
Cov Parm     Subject    Estimate       Error     Value        Pr Z
SP(POW)      id          0.05258     0.01002      5.25      <.0001
Residual                  8.7454      0.2653     32.96      <.0001

           Fit Statistics
-2 Res Log Likelihood         12707.8
AIC (smaller is better)       12711.8
AICC (smaller is better)      12711.8
BIC (smaller is better)       12720.4

  Null Model Likelihood Ratio Test
    DF    Chi-Square      Pr > ChiSq
     1        168.26          <.0001

                    Solution for Fixed Effects
                            Standard
Effect          Estimate       Error      DF    t Value    Pr > |t|
Intercept        16.4041      0.4137     540      39.65      <.0001
age_at_time0      0.1515     0.05278     540       2.87      0.0043
relyear           1.0464     0.09101    2050      11.50      <.0001

                            Estimates
                          Standard
Label         Estimate       Error      DF    t Value    Pr > |t|
Age - time     -0.8949      0.1055     540      -8.48      <.0001
Figure 7.9, page 218.
proc mixed data=cognitive method=reml covtest noitprint noclprint;
 class id;
 model ravens =  female morbcut relyear female*morbcut female*relyear morbcut*relyear female*morbcut*relyear / solution notest outpred = cogp2;
 random Intercept / subject=id;
run;

data cogp2; set cogp2;
	if sex = "girl" and morbcut = 0 then sex_morb = 1;
	else if sex = "girl" and morbcut = 1 then sex_morb = 2;
	else if sex = "boy" and morbcut = 0 then sex_morb = 3;
	else if sex = "boy" and morbcut = 1 then sex_morb = 4;
run;

proc freq data = cogp2;
	table sex_morb;
run;

* (a);
goptions reset = all;
 symbol1 value=none color = black interpol=join r=6;

proc sort data = cogp2;
 by sex_morb rn;
run;
proc means data = cogp2;
 by sex_morb rn;
 var ravens relyear;
 output out = mean_rav;
run;

data means2; set mean_rav;
 where _STAT_ = "MEAN";
run;

proc gplot data = means2;
 plot ravens*relyear = sex_morb / nolegend name = 'f79_b';
run; quit;

* (b);
goptions reset = all;
 symbol1 value=none color = black interpol=join r=6;

proc sort data = cogp2;
 by sex_morb rn;
run;

proc means data = cogp2;
 by sex_morb rn;
 var pred relyear;
 output out = mean_rav;
run;

data means2; set mean_rav;
 where _STAT_ = "MEAN";
run;

proc gplot data = means2;
 plot pred*relyear = sex_morb / nolegend name = 'f79_a';
run; quit;


proc greplay igout = work.gseg tc=sashelp.templt template=h2 nofs;
 treplay 1:f79_a 2:f79_b;
run; quit;
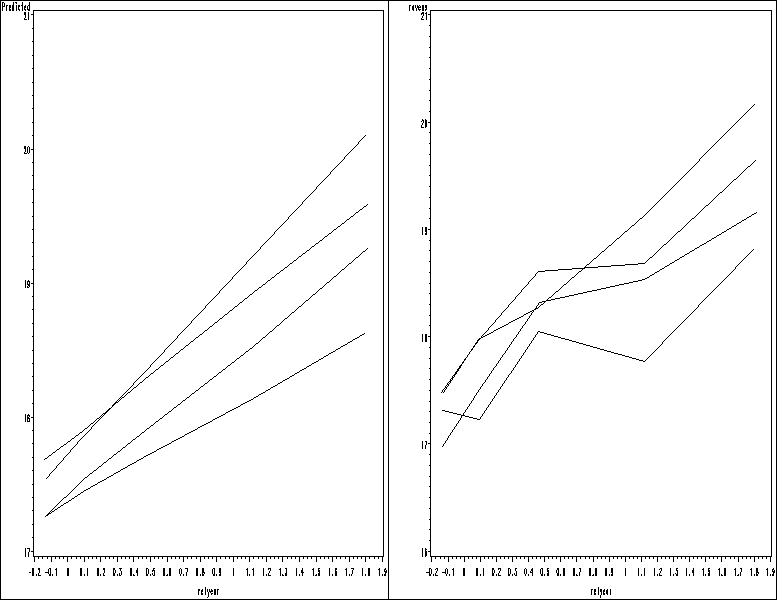
Table 7.12, page 225.
data bsi;
 set bsitotal;
 knot18 = (true_month - 18)*(true_month >= 18);
 knot36 = (true_month - 36)*(true_month >= 36);
 spring = (season = "spring (3-6)");
 summer = (season = "summer (7-10)");
 l2bsi_gsi = log2(bsi_gsi + 1/53);
run;

proc mixed data=bsi noclprint noitprint covtest method = reml;
  class pid parent rounded3_true_month gender ;
  model l2bsi_gsi = true_month knot18 knot36 spring summer gender / solution notest;
  repeated rounded3_true_month /subject=pid(parent) type=arma(1,1);
  random intercept / subject=parent;
  estimate 'slope before 18' true_month 1;
  estimate 'slope 18-36' true_month 1 knot18 1;
  estimate 'slope after 36' true_month 1 knot18 1 knot36 1;
  estimate 'spring - summer' spring 1 summer -1;
run ;

The Mixed Procedure

                  Model Information
Data Set                     WORK.BSI
Dependent Variable           l2bsi_gsi
Covariance Structures        Variance Components,
                             Autoregressive
                             Moving Average
Subject Effects              parent, pid(parent)
Estimation Method            REML
Residual Variance Method     Profile
Fixed Effects SE Method      Model-Based
Degrees of Freedom Method    Containment

            Dimensions
Covariance Parameters             4
Columns in X                      8
Columns in Z Per Subject          1
Subjects                        280
Max Obs Per Subject              70

          Number of Observations
Number of Observations Read            4857
Number of Observations Used            4857
Number of Observations Not Used           0

                    Covariance Parameter Estimates
                                         Standard         Z
Cov Parm      Subject        Estimate       Error     Value        Pr Z
Intercept     parent           0.4541      0.1586      2.86      0.0021
Rho           pid(parent)      0.9516    0.006524    145.88      <.0001
Gamma         pid(parent)      0.5846     0.02232     26.19      <.0001
Residual                       3.3062      0.1711     19.32      <.0001

           Fit Statistics
-2 Res Log Likelihood         17551.1
AIC (smaller is better)       17559.1
AICC (smaller is better)      17559.1
BIC (smaller is better)       17573.7

                        Solution for Fixed Effects
                                    Standard
Effect        gender    Estimate       Error      DF    t Value    Pr > |t|
Intercept                -1.8566      0.1204     279     -15.42      <.0001
true_month              -0.06238    0.004810    4571     -12.97      <.0001
knot18                   0.08056    0.008174    4571       9.86      <.0001
knot36                  -0.02015    0.006589    4571      -3.06      0.0022
spring                    0.1608     0.04415    4571       3.64      0.0003
summer                  -0.01344     0.04498    4571      -0.30      0.7652
gender        female      0.6524      0.1337    4571       4.88      <.0001
gender        male             0           .       .        .         .

                              Estimates
                               Standard
Label              Estimate       Error      DF    t Value    Pr > |t|
slope before 18    -0.06238    0.004810    4571     -12.97      <.0001
slope 18-36         0.01818    0.004849    4571       3.75      0.0002
slope after 36     -0.00197    0.002899    4571      -0.68      0.4962
spring - summer      0.1742     0.04482    4571       3.89      0.0001
Table 7.13, page 227.
data bmice_knot;
 set bigmice;
  cont_day = day;
  day2 = day**2;
  day3 = day**3;
  knot3_5 = (day-3.5)**3*(day>=3.5);
  knot8_5 = (day-8.5)**3*(day>=8.5);
  knot13_5 = (day-13.5)**3*(day>=13.5);
run;

proc mixed data = bmice_knot method = ml noitprint noclprint;
 class id day;
 model weight = cont_day day2 day3 knot3_5 knot8_5 knot13_5
  /solution notest;
 repeated day / subject = id type = arh(1);
run;

The Mixed Procedure

                  Model Information
Data Set                     WORK.BMICE_KNOT
Dependent Variable           weight
Covariance Structure         Heterogeneous
                             Autoregressive
Subject Effect               id
Estimation Method            ML
Residual Variance Method     None
Fixed Effects SE Method      Model-Based
Degrees of Freedom Method    Between-Within

            Dimensions
Covariance Parameters            22
Columns in X                      7
Columns in Z                      0
Subjects                         35
Max Obs Per Subject              21

          Number of Observations
Number of Observations Read             735
Number of Observations Used             273
Number of Observations Not Used         462

Covariance Parameter Estimates
Cov Parm    Subject    Estimate
Var(1)      id           228.20
Var(2)      id           333.26
Var(3)      id          2297.80
Var(4)      id          1723.93
Var(5)      id          2141.12
Var(6)      id          2485.15
Var(7)      id          3827.81
Var(8)      id          3556.06
Var(9)      id          2915.58
Var(10)     id          7403.05
Var(11)     id          6433.77
Var(12)     id          6046.23
Var(13)     id          5569.73
Var(14)     id          6010.33
Var(15)     id          7936.64
Var(16)     id          6861.19
Var(17)     id          9133.41
Var(18)     id          7948.99
Var(19)     id          7422.95
Var(20)     id          9994.02
Var(21)     id          6924.31
ARH(1)      id           0.9369

           Fit Statistics
-2 Log Likelihood              2716.7
AIC (smaller is better)        2774.7
AICC (smaller is better)       2781.9
BIC (smaller is better)        2819.8

  Null Model Likelihood Ratio Test
    DF    Chi-Square      Pr > ChiSq
    21        481.61          <.0001

                   Solution for Fixed Effects
                         Standard
Effect       Estimate       Error      DF    t Value    Pr > |t|
Intercept      148.78      2.7697      34      53.72      <.0001
cont_day       5.9927      4.2493     232       1.41      0.1598
day2          13.6207      2.1150     232       6.44      <.0001
day3          -1.2283      0.2693     232      -4.56      <.0001
knot3_5        1.0482      0.3501     232       2.99      0.0031
knot8_5        0.1476      0.1784     232       0.83      0.4089
knot13_5       0.3786      0.2276     232       1.66      0.0975
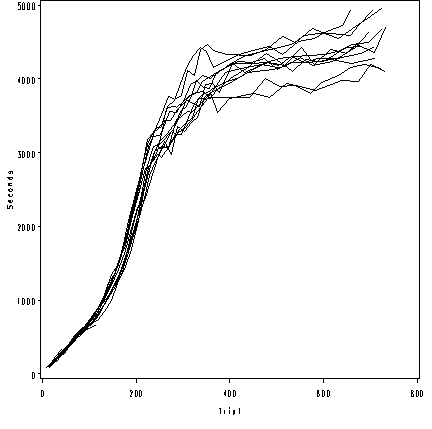
Figure 7.11(a), page 229. (b-d) omitted because SAS does not allow random effects with spline models.
goptions reset = all;
 symbol1 value=none color = black interpol=join r=20;
 axis1 order =(0 to 800 by 200) label=(a=0 'Trial') minor=none;
 axis2 order =(0 to 5000 by 1000) label = (a=90 'Seconds') minor=none ;

proc gplot data = small_wallaby;
 where animal le 76 ;
 plot tail*agedays =animal /haxis=axis1 vaxis = axis2 nolegend;
run; quit;

