Page 27, Table 2.3 SAS program for for null model
proc mixed data=imm10;
  model math = / solution ;
run;
Results for null model
Covariance Parameter
      Estimates

Cov Parm     Estimate

Residual       124.00


           Fit Statistics

-2 Res Log Likelihood          1989.0
AIC (smaller is better)        1991.0
AICC (smaller is better)       1991.0
BIC (smaller is better)        1994.6


                   Solution for Fixed Effects

                         Standard
Effect       Estimate       Error      DF    t Value    Pr > |t|

Intercept     51.3000      0.6906     259      74.28      <.0001
SAS Program for "With Homework" model
proc mixed data=imm10;
  model math = homework / solution ;
run;
Results
Covariance Parameter
      Estimates

Cov Parm     Estimate

Residual      93.7318


           Fit Statistics

-2 Res Log Likelihood          1915.6
AIC (smaller is better)        1917.6
AICC (smaller is better)       1917.6
BIC (smaller is better)        1921.2


                   Solution for Fixed Effects

                         Standard
Effect       Estimate       Error      DF    t Value    Pr > |t|

Intercept     44.0739      0.9886     258      44.58      <.0001
homework       3.5719      0.3882     258       9.20      <.0001
Table 2.4 (skipped)
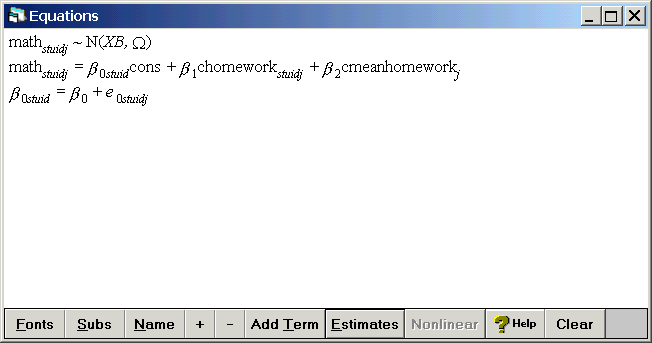
Table 2.5 equations (for model "with homework"). The "meanhomework" is the mean of homework by school, computed within MLwiN via the "data manipulation" and "multilevel operations" menu.
skipped for now.
Page 30, Table 2.6

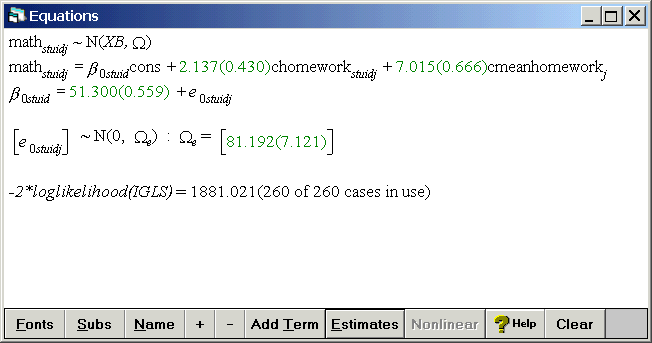
Results (these results have a different intercept and different standard errors)

Table 2.7, page 31, skipped
