The data set used in this chapter is popular.
Table 2.1 on page 17.
Part 1: Intercept only.
data pop;
  set popular;
run;
proc mixed data = pop ;
  model popular = /solution;
  random intercept / subject = school type = un;
run;
The Mixed Procedure
                  Model Information
Data Set                     WORK.POP
Dependent Variable           POPULAR
Covariance Structure         Unstructured
Subject Effect               SCHOOL
Estimation Method            REML
Residual Variance Method     Profile
Fixed Effects SE Method      Model-Based
Degrees of Freedom Method    Containment

            Dimensions
Covariance Parameters             2
Columns in X                      1
Columns in Z Per Subject          1
Subjects                        100
Max Obs Per Subject              26
Observations Used              2000
Observations Not Used             0
Total Observations             2000

 Covariance Parameter Estimates
Cov Parm     Subject    Estimate
UN(1,1)      SCHOOL       0.8798
Residual                  0.6387

           Fit Statistics
-2 Res Log Likelihood          5115.6
AIC (smaller is better)        5119.6
AICC (smaller is better)       5119.6
BIC (smaller is better)        5124.8
  Null Model Likelihood Ratio Test
    DF    Chi-Square      Pr > ChiSq
     1       1379.30          <.0001

                   Solution for Fixed Effects
                         Standard
Effect       Estimate       Error      DF    t Value    Pr > |t|
Intercept      5.3076     0.09550      99      55.58      <.0001
Part 2: The variable sex is included as a random effect and teacher experience (texp) as fixed effect (M1).
proc mixed data = pop;
  model popular = sex texp /solution;
  random intercept sex /subject = school type=un ;
run;
The Mixed Procedure

 Covariance Parameter Estimates
Cov Parm     Subject    Estimate
UN(1,1)      SCHOOL       0.4116
UN(2,1)      SCHOOL      0.02089
UN(2,2)      SCHOOL       0.2733
Residual                  0.3925

           Fit Statistics
-2 Res Log Likelihood          4275.9
AIC (smaller is better)        4283.9

           Fit Statistics
AICC (smaller is better)       4283.9
BIC (smaller is better)        4294.3

  Null Model Likelihood Ratio Test
    DF    Chi-Square      Pr > ChiSq
     3       1279.56          <.0001

                   Solution for Fixed Effects
                         Standard
Effect       Estimate       Error      DF    t Value    Pr > |t|
Intercept      3.3400      0.1608      98      20.77      <.0001
SEX            0.8431     0.05969      99      14.13      <.0001
TEXP           0.1084     0.01022    1800      10.61      <.0001

        Type 3 Tests of Fixed Effects
              Num     Den
Effect         DF      DF    F Value    Pr > F
SEX             1      99     199.54    <.0001
TEXP            1    1800     112.51    <.0001
Table 2.2. on page 20.
Part 1: M1, as shown above.
Part 2: Cross-level interaction with teacher experience (M2). We first created a variable genxexp an interaction term of sex and terp. The variable genxexp is included as a fixed effect.
data pop1;
  set pop;
  genxexp = sex*texp;
run;
proc mixed data = pop1 ;
  model popular = sex texp genxexp/solution;
  random intercept sex /subject = school type=un ;
run;
The Mixed Procedure
  Covariance Parameter Estimates
Cov Parm     Subject    Estimate
UN(1,1)      SCHOOL       0.4120
UN(2,1)      SCHOOL      0.02343
UN(2,2)      SCHOOL       0.2264
Residual                  0.3924

           Fit Statistics
-2 Res Log Likelihood          4268.4
AIC (smaller is better)        4276.4
AICC (smaller is better)       4276.5
BIC (smaller is better)        4286.9

  Null Model Likelihood Ratio Test
    DF    Chi-Square      Pr > ChiSq
     3       1274.81          <.0001

                   Solution for Fixed Effects
                         Standard
Effect       Estimate       Error      DF    t Value    Pr > |t|
Intercept      3.3135      0.1610      98      20.58      <.0001
SEX            1.3296      0.1330      98       9.99      <.0001
TEXP           0.1102     0.01023    1800      10.77      <.0001
genxexp      -0.03403    0.008457    1800      -4.02      <.0001

        Type 3 Tests of Fixed Effects
              Num     Den
Effect         DF      DF    F Value    Pr > F
SEX             1      98      99.86    <.0001
TEXP            1    1800     116.07    <.0001
genxexp         1    1800      16.20    <.0001
Table 2.3 on page 21.
Part 1: M1 from Table 2.2.
Part 2: Standardized variables. We first standardized all the variables
proc stdize data = pop out=pops;
 var popular sex texp;
run;
proc mixed data = pops;
  model popular = sex texp / solution ;
  random intercept sex /subject = school type=un ;
run;
Covariance Parameter Estimates
Cov Parm     Subject    Estimate
UN(1,1)      SCHOOL       0.3305
UN(2,1)      SCHOOL      0.05122
UN(2,2)      SCHOOL      0.04545
Residual                  0.2612

           Fit Statistics
-2 Res Log Likelihood          3460.0
AIC (smaller is better)        3468.0

           Fit Statistics
AICC (smaller is better)       3468.0
BIC (smaller is better)        3478.4

  Null Model Likelihood Ratio Test
    DF    Chi-Square      Pr > ChiSq
     3       1279.56          <.0001

                   Solution for Fixed Effects
                         Standard
Effect       Estimate       Error      DF    t Value    Pr > |t|
Intercept    -0.00978     0.05867      98      -0.17      0.8680
SEX            0.3439     0.02434      99      14.13      <.0001
TEXP           0.5791     0.05459    1800      10.61      <.0001

        Type 3 Tests of Fixed Effects
              Num     Den
Effect         DF      DF    F Value    Pr > F
SEX             1      99     199.54    <.0001
TEXP            1    1800     112.51    <.0001
Figure 2.1 on page 23. Return back to model M1. The outp option requests the predicted values, residuals and other statistics to be saved in a temporary file called test.
proc mixed data = pop;
  model popular = sex texp /solution outp=test;
  random intercept sex / subject = school type = un;
run;
proc stdize data= test out=fig2;
  var resid;
run;
proc univariate data = fig2 noprint;
  var resid;
  qqplot /href = 0 vref = 0 ;
run;
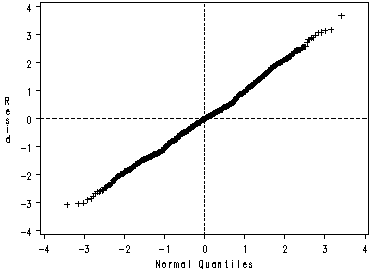
Figure 2.2 Level 1 standardized residuals plotted against predicted popularity using the fixed part of the model.
data pred;
  set test;
  eqpred =  3.3400 + 0.8431* sex + .1084*texp;
run;

proc stdize data = pred out = pred1;
  var resid;
run;

axis1 order = (-3.7, -2.8, -1.9, -.9, 0, .9, 1.9, 2.8, 3.7) label = (a=90 "std(const)");
axis2 order = (3.5 to 7.1 by .9) label = ("pred.val.") minor = none;
symbol value = star color = blue;
proc gplot data = pred1;
  plot resid*eqpred /vref=0 vaxs = axis1 haxis = axis2;
run;
quit;
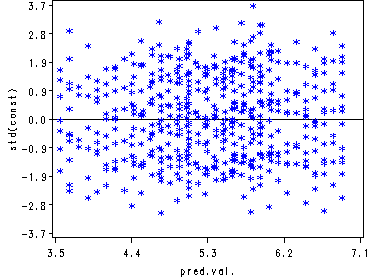
Figure 2.3 Level 2 residuals plotted against predicted popularity. We need to use the ods output statement to output the level 2 residuals. The output data file pop2 contains both the residuals for the intercept and variable sex. The data step after proc mixed separates them apart. Then we need to get the average prediction at level 2 and this is done using proc sql. Then we are ready to plot them one at a time. The final step is to put these two plots together and this is done using proc greplay.
goptions nodisplay;
proc greplay igout=mycat tc=tempcat nofs;
   delete _all_;
run;
proc mixed data = pop;
  model popular = sex texp /solution ;
  random intercept sex /solution subject = school type = un;
  ods output SolutionR = pop2;
run;

data int sex;
  set pop2;
  school = subject + 0;
  keep school estimate stderrpred;
  if effect = "Intercept" then output int;
  if effect = "SEX" then output sex;
run;
data pintall;
  merge pred int;
  by school;
run;
proc sql;
  create table pall1 as
  select distinct mean(eqpred) as p, estimate as int
  from pintall
  group by school;
quit;
symbol v = star w = 3 c=blue;
axis1 order = (-1.6 to 1.6 by .4) minor =none label=(a=90 "(const)");
axis2 order = (3.8 to 7 by .8) minor = none label=("pred. val." );
proc gplot data = pall1 gout=mycat ;
  format int p 4.1 ;
  plot int*p = 1 /vref=0 vaxis=axis1 haxis=axis2;
run;
quit;
data psex;
  merge pred sex;
  by school;
run;
proc sql;
  create table psex2 as
  select distinct mean(eqpred) as p, estimate as sex
  from psex
  group by school;
quit;
symbol v = star w = 3 c=blue;
axis1 order = (-1.2 to 1.2 by .3) label=(a = 90 "(sex)");
axis2 order = (3.8 to 7 by .8) minor = none label=("pred. val.");

proc gplot data = psex2 gout=mycat ;
  format sex p 4.1 ;
  plot sex*p = 1 /vref=0 vaxis=axis1 haxis=axis2;
run;
quit;
goptions display;
proc greplay nofs igout=mycat tc=sashelp.templt template=v2;
  treplay 1:gplot 2:gplot1 ;
run;
quit;
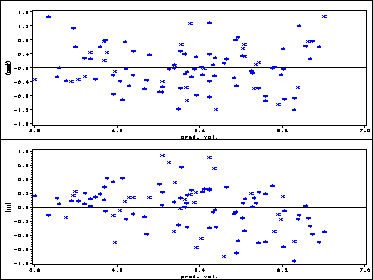
Figure 2.4 Error bar plot of level 2 residuals.
goptions nodisplay;
proc greplay igout=mycat2 tc=tempcat nofs;
   delete _all_;
run;

proc sort data =int;
 by estimate;
run;

data popint1;
  set int;
  id = _n_;
  est= estimate; id = id; output;
  est = estimate + 1.39*stderrpred; id = id; output;
  est = estimate - 1.39*stderrpred; id = id; output;
run;

symbol i=hiloT;
axis1 order =(-1.6, -1, -.5, 0, .5, 1, 1.6, 2.1) label=(a=90 "const") minor=none;
axis2 order = (1 to 101 by 25) label = ("Rank") minor=none;
proc gplot data = popint1 gout=mycat2;
  format est 4.1;
  plot ( est )*id  /overlay vref=0 vaxis=axis1 haxis=axis2;
run;
quit;
proc sort data = sex;
 by estimate;
run;

data popsex1;
  set sex;
  id = _n_;
  est = estimate; id = id; output;
  est = estimate + 1.39*stderrpred; id = id; output;
  est = estimate - 1.39*stderrpred; id = id; output;
run;

symbol i=hiloT;
axis1 order =(-1.6, -1, -.5, 0, .5, 1, 1.6, 2.1) label=(a=90 "const") minor=none;
axis2 order = (1 to 101 by 25) label = ("Rank") minor=none;
proc gplot data = popsex1 gout = mycat2;
  format est 4.1;
  plot ( est )*id  /overlay vref=0 vaxis=axis1 haxis=axis2;
run;
quit;
goptions display;
proc greplay nofs igout=mycat2 tc=sashelp.templt template=v2;
  treplay 1:gplot 2:gplot1 ;
run;
quit;
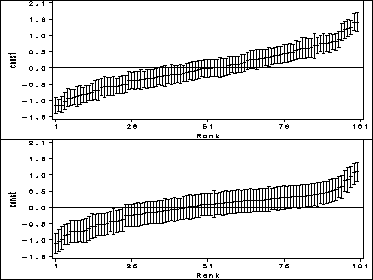
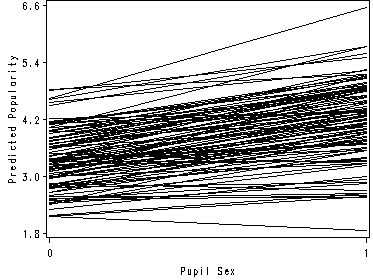
Figure 2.6. The predicted values from outp = test statement is from the random effect model. We can take away the fixed effect of variable texp.
data test1;
  set test;
  p = pred - .1084*texp;
run;
proc sort data = test1;
  by school;
run;

axis1 order =(1.8 to 6.6 by 1.2 ) minor=none label=(a=90 "Predicted Popularity");
axis2 order = (0 to 1 by 1) minor = none label =("Pupil Sex");
symbol i = join r=100  c = black;
proc gplot data = test1;
  plot p*sex=school /overlay nolegend haxis=axis2 vaxis=axis1;
run;
quit;