In this chapter we create and use the variables GndC_verb which is equal to iq_verb centered around the grand mean; GrpMC_verb which contains the group means of GndC_verb, so it contains the group means of iq_verb centered around the grand mean.
Table 4.1, p. 47.
The random intercept only model.
proc mixed data=schools covtest noclprint noitprint method=ml;
  class schoolnr;
  model langpost = / solution;
  random intercept / subject=schoolnr;
run;

<output omitted>

                   Covariance Parameter Estimates

                                      Standard         Z
Cov Parm      Subject     Estimate       Error     Value        Pr Z
Intercept     schoolNR     19.4126      3.0962      6.27      <.0001
Residual                   64.5704      1.9729     32.73      <.0001


           Fit Statistics
-2 Log Likelihood             16253.2
AIC (smaller is better)       16259.2
AICC (smaller is better)      16259.2
BIC (smaller is better)       16267.8

                   Solution for Fixed Effects

                         Standard
Effect       Estimate       Error      DF    t Value    Pr > |t|
Intercept     40.3642      0.4262     130      94.70      <.0001
Creating the variable GndC_verb which is equal to iq_verb centered around the grand mean.
proc sql;
  create table schools1 as
  select *, iq_verb - mean(iq_verb) as GndC_verb
  from schools;
quit;
Table 4.2, p. 49.
Random intercept model with effect for IQ centered around the grand mean.
proc mixed data=schools1 covtest noclprint noitprint;
  class schoolnr;
  model langpost = GndC_verb / solution;
  random intercept / subject=schoolnr;
run;

<output omitted>

                   Covariance Parameter Estimates

                                      Standard         Z
Cov Parm      Subject     Estimate       Error     Value        Pr Z
Intercept     schoolNR      9.6015      1.5927      6.03      <.0001
Residual                   42.2446      1.2893     32.77      <.0001


           Fit Statistics
-2 Res Log Likelihood         15255.8
AIC (smaller is better)       15259.8
AICC (smaller is better)      15259.8
BIC (smaller is better)       15265.5

                   Solution for Fixed Effects

                         Standard
Effect       Estimate       Error      DF    t Value    Pr > |t|
Intercept     40.6082      0.3082     130     131.77      <.0001
GndC_verb      2.4876     0.07008    2155      35.50      <.0001
Fig. 4.2, p. 49.
Randomly chosen regression lines according to the random intercept model of table 4.4.
proc mixed data=schools2 covtest noitprint noclprint method=ml;
class schoolnr;
model langpost = GndC_verb / outp=p ;
random intercept / subject=schoolnr type=un;
run;
goptions reset=all;
symbol i=j r=24;
axis1 order=(-4 to 4 by 1) label=('IQ');
axis2 order=(20 to 60 by 5) label=(a=90 'Predicted');
proc gplot data=p;
where schoolnr < 27;
plot pred*GndC_verb = schoolnr / vaxis=axis2 haxis=axis1 href=0 ;
run;
quit;
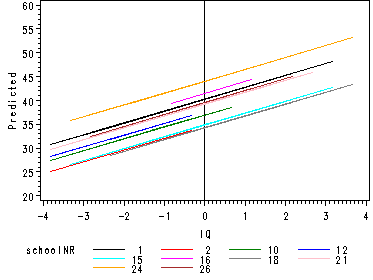
Table 4.3, p. 51.
Ordinary least squares regression of the model in table 4.2.
proc reg data=schools1;
  model langpost = GndC_verb;
run;
quit;
                             Analysis of Variance

                                    Sum of           Mean
Source                   DF        Squares         Square    F Value    Pr > F
Model                     1          68916          68916    1352.84    <.0001
Error                  2285         116402       50.94159
Corrected Total        2286         185317

Root MSE              7.13734    R-Square     0.3719
Dependent Mean       40.93485    Adj R-Sq     0.3716
Coeff Var            17.43585

                        Parameter Estimates

                     Parameter       Standard
Variable     DF       Estimate          Error    t Value    Pr > |t|
Intercept     1       40.93485        0.14925     274.28      <.0001
GndC_verb     1        2.65390        0.07215      36.78      <.0001
Table 4.4, p. 55.
Random intercept model with different within and between group regressions.
Note: The “IQ here is the raw variable” means that we are using the grand mean centered variable GndC_verb and not iq_verb. Furthermore, the group mean variable for IQ is actually the group mean variable of GndC_verb which we here have called GrpMC_verb.
*Group mean centering of GndC_verb. ;
proc sql;
  create table schools2 as
  select *, mean(GndC_verb) as GrpMC_verb
  from schools1
  group by schoolnr;
quit;
proc mixed data=schools2 covtest noitprint noclprint method=ml;
  class schoolnr;
  model langpost = GndC_verb GrpMC_verb / solution;
  random intercept / subject=schoolnr;
run;

<output omitted>
                   Covariance Parameter Estimates

                                      Standard         Z
Cov Parm      Subject     Estimate       Error     Value        Pr Z
Intercept     schoolNR      7.7275      1.3093      5.90      <.0001
Residual                   42.1519      1.2842     32.82      <.0001


           Fit Statistics

-2 Log Likelihood             15227.5
AIC (smaller is better)       15237.5
AICC (smaller is better)      15237.6
BIC (smaller is better)       15251.9


                   Solution for Fixed Effects

                          Standard
Effect        Estimate       Error      DF    t Value    Pr > |t|
Intercept      40.7423      0.2844     129     143.26      <.0001
GndC_verb       2.4148     0.07166    2155      33.70      <.0001
GrpMC_verb      1.5885      0.3127    2155       5.08      <.0001
The remaining tables and figures have been skipped.