A Three Variable Example
page 68 Table 3.1 Regression of postshortage (1981) water use on income and preshortage (1980) water use. The concord1 data set is used.
proc reg data = concord1;
model income water80 = water81;
run;
proc reg data = concord1;
model water81 = income water80;
run;
The REG Procedure Model: MODEL1 Dependent Variable: incomeAnalysis of Variance
Sum of Mean Source DF Squares Square F Value Pr > F
Model 1 14732 14732 104.46 <.0001 Error 494 69669 141.03078 Corrected Total 495 84401
Root MSE 11.87564 R-Square 0.1745 Dependent Mean 23.07661 Adj R-Sq 0.1729 Coeff Var 51.46179
Parameter Estimates
Parameter Standard Variable DF Estimate Error t Value Pr > |t|
Intercept 1 14.63948 0.98275 14.90 <.0001 water81 1 0.00367 0.00035917 10.22 <.0001
The REG Procedure Model: MODEL1 Dependent Variable: water80
Analysis of Variance
Sum of Mean Source DF Squares Square F Value Pr > F
Model 1 900727515 900727515 696.11 <.0001 Error 494 639212788 1293953 Corrected Total 495 1539940302
Root MSE 1137.52055 R-Square 0.5849 Dependent Mean 2732.05645 Adj R-Sq 0.5841 Coeff Var 41.63606
Parameter Estimates
Parameter Standard Variable DF Estimate Error t Value Pr > |t|
Intercept 1 645.82548 94.13406 6.86 <.0001 water81 1 0.90769 0.03440 26.38 <.0001
The REG Procedure Model: MODEL1 Dependent Variable: water81
Analysis of Variance
Sum of Mean Source DF Squares Square F Value Pr > F
Model 2 671025350 335512675 391.76 <.0001 Error 493 422213359 856417 Corrected Total 495 1093238710
Root MSE 925.42777 R-Square 0.6138 Dependent Mean 2298.38710 Adj R-Sq 0.6122 Coeff Var 40.26423
Parameter Estimates
Parameter Standard Variable DF Estimate Error t Value Pr > |t|
Intercept 1 203.82169 94.36129 2.16 0.0313 income 1 20.54504 3.38341 6.07 <.0001 water80 1 0.59313 0.02505 23.68 <.0001
Partial Effects
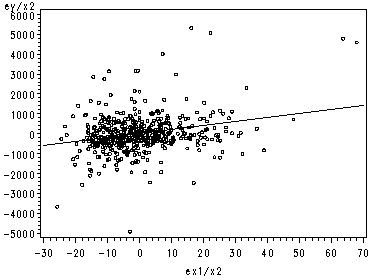
page 70 Figure 3.1 Partial regression leverage plot: postshortage water use (Y) versus income (X1), adjusting for preshortage water use.
proc sort data=concord1 out=concsort;
  by case;
run;
proc reg data=concsort;
  model water81 = income water80;
run;
proc reg data=concsort;
  model water81 = water80;
  output out=out1(keep=case yres) residual=yres;
run;
proc reg data=concsort;
  model income = water80;
  output out=out2(keep=case x1res) residual=x1res;
run;
data all;
  merge concsort out1 out2;
  by case;
  label yres = 'ey/x2';
  label x1res = 'ex1/x2';
run;
The REG Procedure Model: MODEL1 Dependent Variable: water81Analysis of Variance
Sum of Mean Source DF Squares Square F Value Pr > F
Model 2 671025350 335512675 391.76 <.0001 Error 493 422213359 856417 Corrected Total 495 1093238710
Root MSE 925.42777 R-Square 0.6138 Dependent Mean 2298.38710 Adj R-Sq 0.6122 Coeff Var 40.26423
Parameter Estimates
Parameter Standard Variable DF Estimate Error t Value Pr > |t|
Intercept 1 203.82169 94.36129 2.16 0.0313 income 1 20.54504 3.38341 6.07 <.0001 water80 1 0.59313 0.02505 23.68 <.0001
The REG Procedure Model: MODEL1 Dependent Variable: water81
Analysis of Variance
Sum of Mean Source DF Squares Square F Value Pr > F
Model 1 639446987 639446987 696.11 <.0001 Error 494 453791723 918607 Corrected Total 495 1093238710
Root MSE 958.43974 R-Square 0.5849 Dependent Mean 2298.38710 Adj R-Sq 0.5841 Coeff Var 41.70054
Parameter Estimates
Parameter Standard Variable DF Estimate Error t Value Pr > |t|
Intercept 1 537.87101 79.40114 6.77 <.0001 water80 1 0.64439 0.02442 26.38 <.0001
The REG Procedure Model: MODEL1 Dependent Variable: income
Analysis of Variance
Sum of Mean Source DF Squares Square F Value Pr > F
Model 1 9588.31670 9588.31670 63.31 <.0001 Error 494 74813 151.44286 Corrected Total 495 84401
Root MSE 12.30621 R-Square 0.1136 Dependent Mean 23.07661 Adj R-Sq 0.1118 Coeff Var 53.32764
Parameter Estimates
Parameter Standard Variable DF Estimate Error t Value Pr > |t|
Intercept 1 16.25937 1.01950 15.95 <.0001 water80 1 0.00250 0.00031360 7.96 <.0001
symbol1 color=black interpol=r value=circle height=0.5;
axis1 order=(-30 to 70 by 10);
proc gplot data=all;
  plot yres*x1res / haxis=axis1;
run;
quit;
Figure 3.1
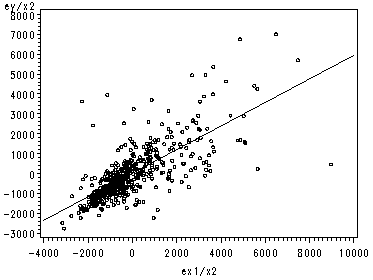
page 71 Figure 3.2 Partial regression leverage plot: postshortage water use water81 (Y) versus preshortage water use water80 (X2), adjusting for income.
proc sort data=concord1 out=concsort1;
  by case;
run;
proc reg data=concsort1;
  model water81 = income water80;
run;
proc reg data=concsort1;
  model water81 = income;
  output out=out3(keep=case yres) residual=yres;
run;
proc reg data=concsort1;
  model water80 = income;
  output out=out4(keep=case x1res) residual=x1res;
run;
quit;
data all;
  merge concsort out3 out4;
  by case;
  label yres = 'ey/x2';
  label x1res = 'ex1/x2';
run;
The REG Procedure Model: MODEL1 Dependent Variable: water81Analysis of Variance
Sum of Mean Source DF Squares Square F Value Pr > F
Model 2 671025350 335512675 391.76 <.0001 Error 493 422213359 856417 Corrected Total 495 1093238710
Root MSE 925.42777 R-Square 0.6138 Dependent Mean 2298.38710 Adj R-Sq 0.6122 Coeff Var 40.26423
Parameter Estimates
Parameter Standard Variable DF Estimate Error t Value Pr > |t|
Intercept 1 203.82169 94.36129 2.16 0.0313 income 1 20.54504 3.38341 6.07 <.0001 water80 1 0.59313 0.02505 23.68 <.0001
The REG Procedure Model: MODEL1 Dependent Variable: water81
Analysis of Variance
Sum of Mean Source DF Squares Square F Value Pr > F
Model 1 190820566 190820566 104.46 <.0001 Error 494 902418143 1826757 Corrected Total 495 1093238710
Root MSE 1351.57589 R-Square 0.1745 Dependent Mean 2298.38710 Adj R-Sq 0.1729 Coeff Var 58.80541
Parameter Estimates
Parameter Standard Variable DF Estimate Error t Value Pr > |t|
Intercept 1 1201.12436 123.32451 9.74 <.0001 income 1 47.54869 4.65229 10.22 <.0001
The REG Procedure Model: MODEL1 Dependent Variable: water80
Analysis of Variance
Sum of Mean Source DF Squares Square F Value Pr > F
Model 1 174943659 174943659 63.31 <.0001 Error 494 1364996643 2763151 Corrected Total 495 1539940302
Root MSE 1662.27287 R-Square 0.1136 Dependent Mean 2732.05645 Adj R-Sq 0.1118 Coeff Var 60.84328
Parameter Estimates
Parameter Standard Variable DF Estimate Error t Value Pr > |t|
Intercept 1 1681.43287 151.67405 11.09 <.0001 income 1 45.52763 5.72174 7.96 <.0001
symbol1 color=black interpol=r value=circle height=0.5;
axis1 order=(-4000 to 10000 by 2000);
proc gplot data=all;
  plot yres*x1res / haxis=axis1;
run;
quit;
Figure 3.2
A Seven-variable Example
page 74 Table 3.2 Regression of postshortage water use on income, preshortage water use, education, retirement, number of people resident, and increase in people resident.
data concx;
  set concord1;
  retired = .;
  if retire = 'yes' then retired = 1;
  if retire = 'no' then retired = 0;
run;
proc freq data=concx;
  tables retire*retired / missing;
run;
proc reg data=concx;
  model water81 = income water80 educat retired peop81 cpeop ;
run;
quit;
The FREQ ProcedureTable of retire by retired
retire retired
Frequency| Percent | Row Pct | Col Pct | 0| 1| Total ———+——–+——–+ no | 350 | 0 | 350 | 70.56 | 0.00 | 70.56 | 100.00 | 0.00 | | 100.00 | 0.00 | ———+——–+——–+ yes | 0 | 146 | 146 | 0.00 | 29.44 | 29.44 | 0.00 | 100.00 | | 0.00 | 100.00 | ———+——–+——–+ Total 350 146 496 70.56 29.44 100.00
The REG Procedure Model: MODEL1 Dependent Variable: water81
Analysis of Variance
Sum of Mean Source DF Squares Square F Value Pr > F
Model 6 740477522 123412920 171.08 <.0001 Error 489 352761188 721393 Corrected Total 495 1093238710
Root MSE 849.34859 R-Square 0.6773 Dependent Mean 2298.38710 Adj R-Sq 0.6734 Coeff Var 36.95411
Parameter Estimates
Parameter Standard Variable DF Estimate Error t Value Pr > |t|
Intercept 1 242.22043 206.86382 1.17 0.2422 income 1 20.96699 3.46372 6.05 <.0001 water80 1 0.49194 0.02635 18.67 <.0001 educat 1 -41.86552 13.22031 -3.17 0.0016 retired 1 189.18433 95.02142 1.99 0.0470 peop81 1 248.19702 28.72480 8.64 <.0001 cpeop 1 96.45360 80.51903 1.20 0.2315
F-tests for Sets of Coefficients
page 80 Table 3.3 Regression of postshortage water use omitting income and education.
proc reg data=concx;
  model water81 = water80 peop81 retired cpeop ;
run;
quit;
The REG Procedure Model: MODEL1 Dependent Variable: water81Analysis of Variance
Sum of Mean Source DF Squares Square F Value Pr > F
Model 4 712718346 178179587 229.91 <.0001 Error 491 380520363 774991 Corrected Total 495 1093238710
Root MSE 880.33548 R-Square 0.6519 Dependent Mean 2298.38710 Adj R-Sq 0.6491 Coeff Var 38.30232
Parameter Estimates
Parameter Standard Variable DF Estimate Error t Value Pr > |t|
Intercept 1 48.64897 107.05488 0.45 0.6497 water80 1 0.51974 0.02677 19.41 <.0001 peop81 1 265.28936 29.63234 8.95 <.0001 retired 1 67.27992 94.28846 0.71 0.4758 cpeop 1 134.46255 83.19590 1.62 0.1067
Intercept Dummy Variables
For the next examples, we will be using the wells data set. First, we need to recode chloride concentration into ln chloride concentration. In SAS, we use the log(x) command to do this.
data wells2;
  set wells;
  lnchlor = log(chlor);
run;
page 86 Equation [3.32]
proc reg data = wells2;
  model lnchlor = deep;
run;
quit;
The REG Procedure Model: MODEL1 Dependent Variable: lnchlorAnalysis of Variance
Sum of Mean Source DF Squares Square F Value Pr > F
Model 1 4.02334 4.02334 2.19 0.1455 Error 50 91.99885 1.83998 Corrected Total 51 96.02220
Root MSE 1.35646 R-Square 0.0419 Dependent Mean 3.20505 Adj R-Sq 0.0227 Coeff Var 42.32257
Parameter Estimates
Parameter Standard Variable DF Estimate Error t Value Pr > |t|
Intercept 1 3.77510 0.42895 8.80 <.0001 deep 1 -0.70578 0.47729 -1.48 0.1455
The code below is for a t-test that does the same thing as the regression above.
proc ttest data = wells2;
  class deep;
  var lnchlor;
run;
The TTEST ProcedureStatistics
Lower CL Upper CL Lower CL Upper CL Variable Class N Mean Mean Mean Std Dev Std Dev Std Dev Std Err lnchlor 10 2.5345 3.7751 5.0157 1.1929 1.7343 3.1661 0.5484 0 lnchlor 42 2.6772 3.0693 3.4615 1.0354 1.2584 1.6047 0.1942 1 lnchlor Diff (1-2) -0.253 0.7058 1.6644 1.135 1.3565 1.6862 0.4773
T-Tests
Variable Method Variances DF t Value Pr > |t|
lnchlor Pooled Equal 50 1.48 0.1455 lnchlor Satterthwaite Unequal 11.4 1.21 0.2497
Equality of Variances
Variable Method Num DF Den DF F Value Pr > F
lnchlor Folded F 9 41 1.90 0.1587
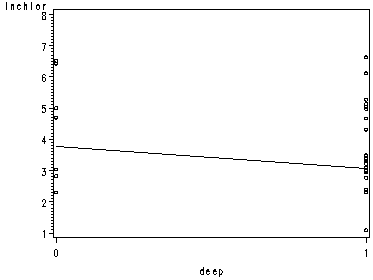
page 87 Figure 3.3 Regression of log chloride concentration on a dummy variable for well type.
symbol1 color=black interpol=r value=circle height=0.5;
axis1 order=(1 to 8 by 1);
axis2 order=(0 1);
proc gplot data=wells2;
  plot lnchlor*deep / vaxis=axis1 haxis=axis2;
run;
quit;
page 87 Equation [3.33]
data wells3;
  set wells2;
  lndroad = log(droad);
run;
proc reg data=wells3;
 model lnchlor = deep lndroad;
 output out = wells4 p = yhat;
run;
quit;
The REG Procedure Model: MODEL1 Dependent Variable: lnchlorAnalysis of Variance
Sum of Mean Source DF Squares Square F Value Pr > F
Model 2 4.50188 2.25094 1.21 0.3084 Error 49 91.52032 1.86776 Corrected Total 51 96.02220
Root MSE 1.36666 R-Square 0.0469 Dependent Mean 3.20505 Adj R-Sq 0.0080 Coeff Var 42.64091
Parameter Estimates
Parameter Standard Variable DF Estimate Error t Value Pr > |t|
Intercept 1 4.20954 0.96096 4.38 <.0001 deep 1 -0.69712 0.48119 -1.45 0.1538 lndroad 1 -0.09097 0.17972 -0.51 0.6150
Slope Dummy Variables
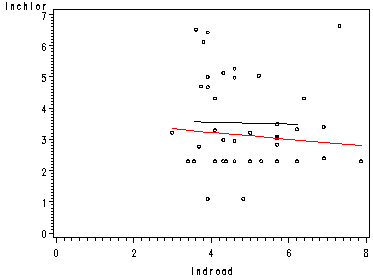
page 88 Figure 3.4 Regression of log chloride concentration on log distance from road and an intercept dummy variable for well type.
data wells5;
 set wells4;
 if deep=0 then yhat0=yhat;
 if deep=1 then yhat1=yhat;
run;
symbol1 color=black interpol=none value=circle height=0.5;
symbol2 interpol=join;
symbol3 interpol=join;
axis1 order=(0 to 7 by 1);
axis2 order=(0 to 8 by 2);
proc gplot data=wells5;
  plot lnchlor*lndroad=1 yhat0*lndroad=2 yhat1*lndroad=3 /
       overlay vaxis=axis1 haxis=axis2;
run;
quit;
The graph from the proc gplot above is shown below. The overlay option tells SAS to put the three graphs onto one graph. The numbers after the equals sign correspond to the symbol statements above, telling SAS which statement applies to which graph. If only one symbol statement was used, SAS would apply it to all three of the graphs. Also note that you can use the goptions reset=all command before symbol statements. This will reset the all of the options so that options that were used in previous graphs are not applied to your current graph.
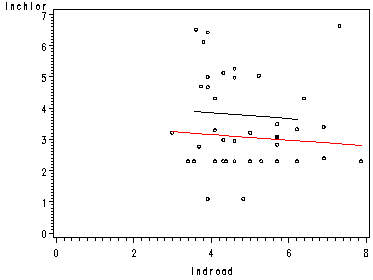
page 89 Figure 3.5 Regression of log chloride concentration on log distance from road and a slope dummy variable for well type.
data wells6;
 set wells5;
 deeproad = deep*lndroad;
 lndroad = log(droad);
run;
proc reg data = wells6;
 model lnchlor = lndroad deeproad;
 output out = wells7 p = yhata;
run;
quit;
The REG Procedure Model: MODEL1 Dependent Variable: lnchlorAnalysis of Variance
Sum of Mean Source DF Squares Square F Value Pr > F
Model 2 1.87088 0.93544 0.49 0.6175 Error 49 94.15131 1.92146 Corrected Total 51 96.02220
Root MSE 1.38617 R-Square 0.0195 Dependent Mean 3.20505 Adj R-Sq -0.0205 Coeff Var 43.24948
Parameter Estimates
Parameter Standard Variable DF Estimate Error t Value Pr > |t|
Intercept 1 3.66615 0.90518 4.05 0.0002 lndroad 1 -0.02897 0.20187 -0.14 0.8865 deeproad 1 -0.08147 0.09946 -0.82 0.4167
data wells8;
 set wells7;
 if deep=0 then yhat0=yhata;
 if deep=1 then yhat1=yhata;
run;
symbol1 color=black interpol=none value=circle height=0.5;
symbol2 interpol=join;
symbol3 interpol=join;
axis1 order=(0 to 7 by 1);
axis2 order=(0 to 8 by 2);
proc gplot data=wells8;
  plot lnchlor*lndroad=1 yhat0*lndroad=2 yhat1*lndroad=3 /
       overlay vaxis=axis1 haxis=axis2;
run;
quit;
page 90 Table 3.4 Regression of log chloride concentration on log distance from road, with intercept and slope dummy variables for well type.
proc reg data = wells8;
 model lnchlor = deep lndroad deeproad;
 output out = wells9 p = yhatb;
run;
quit;
The REG Procedure Model: MODEL1 Dependent Variable: lnchlorAnalysis of Variance
Sum of Mean Source DF Squares Square F Value Pr > F
Model 3 18.48313 6.16104 3.81 0.0157 Error 48 77.53907 1.61540 Corrected Total 51 96.02220
Root MSE 1.27098 R-Square 0.1925 Dependent Mean 3.20505 Adj R-Sq 0.1420 Coeff Var 39.65568
Parameter Estimates
Parameter Standard Variable DF Estimate Error t Value Pr > |t|
Intercept 1 9.07346 1.87938 4.83 <.0001 deep 1 -6.71737 2.09471 -3.21 0.0024 lndroad 1 -1.10942 0.38442 -2.89 0.0058 deeproad 1 1.25585 0.42688 2.94 0.0050
page 91 Figure 3.6 Regression of log chloride concentration on log distance from road, with slope and intercept dummy variables for well type.
data wells10;
 set wells9;
 if deep=0 then yhat0=yhatb;
 if deep=1 then yhat1=yhatb;
 if deep=0 then lnchlor0=lnchlor;
 if deep=1 then lnchlor1=lnchlor;
run;

symbol1 color=black interpol=none value=square height=1.0;
symbol2 color=black interpol=none value=circle height=1.0;
symbol3 interpol=join;
symbol4 interpol=join;
axis1 order=(0 to 9 by 1);
axis2 order=(0 to 8 by 2);
proc gplot data=wells10;
  plot lnchlor0*lndroad=1 lnchlor1*lndroad=2 yhat0*lndroad=3
  yhat1*lndroad=4 / overlay vaxis=axis1 haxis=axis2;
run;
quit;
Figure 3.6
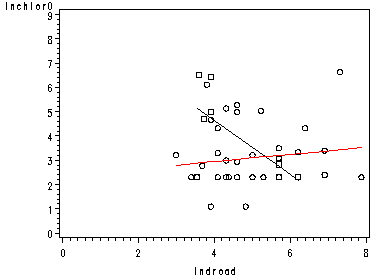
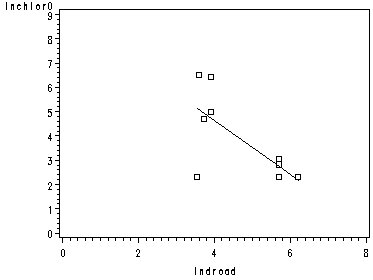
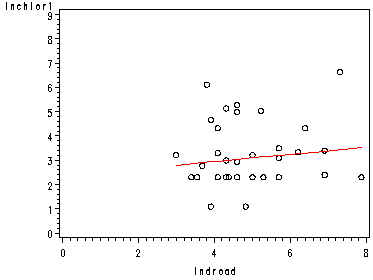
page 91 Figure 3.7 Separate regressions for shallow (left) and deep (right) wells, same lines as in Figure 3.6.
proc gplot data=wells10;
  plot lnchlor0*lndroad=1 yhat0*lndroad=3 / overlay vaxis=axis1 haxis=axis2;
run;
quit;
proc gplot data=wells10;
 plot lnchlor1*lndroad=2 yhat1*lndroad=4 / overlay vaxis=axis1 haxis=axis2;
run;
quit;
Oneway Analysis of Variance
We will be using the radon data set for the next examples. First we need to create some dummy variables: rdx1 fdx2 mhr (recode of radon) lrdx3 mrdx4.
data radon1;
 set radon;
 if locale='RProng' then rdx1=1;
 if locale='Fringe' then rdx1=0;
 if locale='Control' then rdx1=0;
 if locale='RProng' then fdx2=0;
 if locale='Fringe' then fdx2=1;
 if locale='Control' then fdx2=0;
 if radon >= 0 and radon <= 1.5 then mhr='low';
 if radon >= 1.6 and radon <= 2.4 then mhr='mid';
 if radon > 2.5 then mhr='hig';
 if mhr='low' then lrdx3=1;
 if mhr='mid' then lrdx3=0;
 if mhr='hig' then lrdx3=0;
 if mhr='low' then mrdx4=0;
 if mhr='mid' then mrdx4=1;
 if mhr='hig' then mrdx4=0;
run;
page 93 Table 3.5 Cancer, bedrock, and radon in 26 counties.
proc print data=radon1 noobs;
 var county cancer locale rdx1 fdx2 mhr lrdx3 mrdx4;
run;
county cancer locale rdx1 fdx2 mhr lrdx3 mrdx4Orange 6.0 RProng 1 0 low 1 0 Putnam 10.5 RProng 1 0 mid 0 1 Sussex 6.7 RProng 1 0 mid 0 1 Warren 6.0 RProng 1 0 hig 0 0 Morris 6.1 RProng 1 0 low 1 0 Hunterdon 6.7 RProng 1 0 hig 0 0 Berks 5.2 Fringe 0 1 hig 0 0 Lehigh 5.6 Fringe 0 1 hig 0 0 Northampton 5.8 Fringe 0 1 hig 0 0 Pike 4.5 Fringe 0 1 low 1 0 Dutchess 5.5 Fringe 0 1 mid 0 1 Sullivan 5.4 Fringe 0 1 low 1 0 Ulster 6.3 Fringe 0 1 low 1 0 Columbia 6.3 Control 0 0 mid 0 1 Delaware 4.3 Control 0 0 mid 0 1 Greene 4.0 Control 0 0 mid 0 1 Otsego 5.9 Control 0 0 mid 0 1 Tioga 4.7 Control 0 0 mid 0 1 Carbon 4.8 Control 0 0 mid 0 1 Lebanon 5.8 Control 0 0 hig 0 0 Lackawanna 5.4 Control 0 0 low 1 0 Luzerne 5.2 Control 0 0 low 1 0 Schuylkill 3.6 Control 0 0 hig 0 0 Susquehanna 4.3 Control 0 0 low 1 0 Wayne 3.5 Control 0 0 low 1 0 Wyoming 6.9 Control 0 0 mid 0 1
page 94 Table 3.6 Relation between cancer rate and bedrock area.
proc reg data=radon1;
 model cancer = rdx1 fdx2;
 t1: test rdx1=0, fdx2=0;
run;
quit;
The REG Procedure Model: MODEL1 Dependent Variable: cancerAnalysis of Variance
Sum of Mean Source DF Squares Square F Value Pr > F
Model 2 16.90879 8.45440 6.41 0.0061 Error 23 30.33736 1.31902 Corrected Total 25 47.24615
Root MSE 1.14848 R-Square 0.3579 Dependent Mean 5.57692 Adj R-Sq 0.3021 Coeff Var 20.59351
Parameter Estimates
Parameter Standard Variable DF Estimate Error t Value Pr > |t|
Intercept 1 4.97692 0.31853 15.62 <.0001 rdx1 1 2.02308 0.56683 3.57 0.0016 fdx2 1 0.49451 0.53842 0.92 0.3679
The REG Procedure Model: MODEL1
Test T1 Results for Dependent Variable cancer
Mean Source DF Square F Value Pr > F
Numerator 2 8.45440 6.41 0.0061 Denominator 23 1.31902
proc glm data=radon1;
 model cancer = rdx1 fdx2;
run;
quit;
The GLM ProcedureNumber of observations 26 The GLM Procedure
Dependent Variable: cancer
Sum of Source DF Squares Mean Square F Value Pr > F
Model 2 16.90879121 8.45439560 6.41 0.0061
Error 23 30.33736264 1.31901577
Corrected Total 25 47.24615385
R-Square Coeff Var Root MSE cancer Mean
0.357887 20.59351 1.148484 5.576923
Source DF Type I SS Mean Square F Value Pr > F
rdx1 1 15.79615385 15.79615385 11.98 0.0021 fdx2 1 1.11263736 1.11263736 0.84 0.3679
Source DF Type III SS Mean Square F Value Pr > F
rdx1 1 16.80218623 16.80218623 12.74 0.0016 fdx2 1 1.11263736 1.11263736 0.84 0.3679
Standard Parameter Estimate Error t Value Pr > |t|
Intercept 4.976923077 0.31853218 15.62 <.0001 rdx1 2.023076923 0.56683217 3.57 0.0016 fdx2 0.494505495 0.53841766 0.92 0.3679
Twoway Analysis of Variance
page 96 Table 3.7 Relation among cancer rate, bedrock area, and radon.
proc reg data=radon1;
 model cancer = rdx1 fdx2 lrdx3 mrdx4;
 t2: test rdx1=0, fdx2=0;
 t3: test lrdx3=0, mrdx4=0;
run;
quit;
The REG Procedure Model: MODEL1 Dependent Variable: cancerAnalysis of Variance
Sum of Mean Source DF Squares Square F Value Pr > F
Model 4 22.12361 5.53090 4.62 0.0078 Error 21 25.12254 1.19631 Corrected Total 25 47.24615
Root MSE 1.09376 R-Square 0.4683 Dependent Mean 5.57692 Adj R-Sq 0.3670 Coeff Var 19.61225
Parameter Estimates
Parameter Standard Variable DF Estimate Error t Value Pr > |t|
Intercept 1 4.52504 0.52808 8.57 <.0001 rdx1 1 2.21189 0.55102 4.01 0.0006 fdx2 1 0.86698 0.54921 1.58 0.1294 lrdx3 1 -0.11668 0.55602 -0.21 0.8358 mrdx4 1 0.90588 0.57595 1.57 0.1307
The REG Procedure Model: MODEL1
Test T2 Results for Dependent Variable cancer
Mean Source DF Square F Value Pr > F
Numerator 2 9.64232 8.06 0.0025 Denominator 21 1.19631
The REG Procedure Model: MODEL1
Test T3 Results for Dependent Variable cancer
Mean Source DF Square F Value Pr > F
Numerator 2 2.60741 2.18 0.1380 Denominator 21 1.19631
proc glm data=radon1;
 model cancer = rdx1 fdx2 lrdx3 mrdx4;
run;
quit;
The GLM ProcedureNumber of observations 26 The GLM Procedure
Dependent Variable: cancer
Sum of Source DF Squares Mean Square F Value Pr > F
Model 4 22.12361500 5.53090375 4.62 0.0078
Error 21 25.12253885 1.19631137
Corrected Total 25 47.24615385
R-Square Coeff Var Root MSE cancer Mean
0.468263 19.61225 1.093760 5.576923
Source DF Type I SS Mean Square F Value Pr > F
rdx1 1 15.79615385 15.79615385 13.20 0.0016 fdx2 1 1.11263736 1.11263736 0.93 0.3458 lrdx3 1 2.25529715 2.25529715 1.89 0.1842 mrdx4 1 2.95952664 2.95952664 2.47 0.1307
Source DF Type III SS Mean Square F Value Pr > F
rdx1 1 19.27700707 19.27700707 16.11 0.0006 fdx2 1 2.98111766 2.98111766 2.49 0.1294 lrdx3 1 0.05267737 0.05267737 0.04 0.8358 mrdx4 1 2.95952664 2.95952664 2.47 0.1307
Standard Parameter Estimate Error t Value Pr > |t|
Intercept 4.525039288 0.52807932 8.57 <.0001 rdx1 2.211891042 0.55101833 4.01 0.0006 fdx2 0.866980967 0.54921466 1.58 0.1294 lrdx3 -0.116675397 0.55601868 -0.21 0.8358 mrdx4 0.905884407 0.57594866 1.57 0.1307
page 98 Table 3.8 Relation among cancer rate, bedrock area, and radon.
data radon2;
 set radon1;
 x1x3=rdx1*lrdx3;
 x1x4=rdx1*mrdx4;
 x2x3=fdx2*lrdx3;
 x2x4=fdx2*mrdx4;

proc reg data=radon2;
  model cancer = rdx1 fdx2 lrdx3 mrdx4 x1x3 x1x4 x2x3 x2x4;
  t4: test x1x3=0, x1x4=0, x2x3=0, x2x4=0;
run;
quit;
The REG Procedure Model: MODEL1 Dependent Variable: cancerAnalysis of Variance
Sum of Mean Source DF Squares Square F Value Pr > F
Model 8 26.03520 3.25440 2.61 0.0460 Error 17 21.21095 1.24770 Corrected Total 25 47.24615
Root MSE 1.11701 R-Square 0.5511 Dependent Mean 5.57692 Adj R-Sq 0.3398 Coeff Var 20.02908
Parameter Estimates
Parameter Standard Variable DF Estimate Error t Value Pr > |t|
Intercept 1 4.70000 0.78984 5.95 <.0001 rdx1 1 1.65000 1.11701 1.48 0.1579 fdx2 1 0.83333 1.01968 0.82 0.4251 lrdx3 1 -0.10000 0.96736 -0.10 0.9189 mrdx4 1 0.57143 0.89560 0.64 0.5319 x1x3 1 -0.20000 1.47766 -0.14 0.8939 x1x4 1 1.67857 1.43171 1.17 0.2572 x2x3 1 -0.03333 1.32950 -0.03 0.9803 x2x4 1 -0.60476 1.57025 -0.39 0.7049
The REG Procedure Model: MODEL1
Test T4 Results for Dependent Variable cancer
Mean Source DF Square F Value Pr > F
Numerator 4 0.97790 0.78 0.5513 Denominator 17 1.24770
page 99 Table 3.9 Effect coding of bedrock area from Table 3.5.
data radon3;
 set radon2;
 if locale='RProng' then rev1=1;
 if locale='Fringe' then rev1=0;
 if locale='Control' then rev1=-1;
 if locale='RProng' then fev2=0;
 if locale='Fringe' then fev2=1;
 if locale='Control' then fev2=-1;
 if mhr='low' then v3=1;
 if mhr='mid' then v3=0;
 if mhr='hig' then v3=-1;
 if mhr='low' then v4=0;
 if mhr='mid' then v4=1;
 if mhr='hig' then v4=-1;
 v1v3=rev1*v3;
 v1v4=rev1*v4;
 v2v3=fev2*v3;
 v2v4=fev2*v4;
run;
proc print data=radon3 noobs;
 var county locale rdx1 rev1 fdx2 fev2;
run;
county locale rdx1 rev1 fdx2 fev2Orange RProng 1 1 0 0 Putnam RProng 1 1 0 0 Sussex RProng 1 1 0 0 Warren RProng 1 1 0 0 Morris RProng 1 1 0 0 Hunterdon RProng 1 1 0 0 Berks Fringe 0 0 1 1 Lehigh Fringe 0 0 1 1 Northampton Fringe 0 0 1 1 Pike Fringe 0 0 1 1 Dutchess Fringe 0 0 1 1 Sullivan Fringe 0 0 1 1 Ulster Fringe 0 0 1 1 Columbia Control 0 -1 0 -1 Delaware Control 0 -1 0 -1 Greene Control 0 -1 0 -1 Otsego Control 0 -1 0 -1 Tioga Control 0 -1 0 -1 Carbon Control 0 -1 0 -1 Lebanon Control 0 -1 0 -1 Lackawanna Control 0 -1 0 -1 Luzerne Control 0 -1 0 -1 Schuylkill Control 0 -1 0 -1 Susquehanna Control 0 -1 0 -1 Wayne Control 0 -1 0 -1 Wyoming Control 0 -1 0 -1
The proc print below shows the rest of the effect coding and the interaction terms.
proc print data=radon3;
 var county locale rev1 fev2 mhr v3 v4 v1v3 v1v4 v2v3 v2v4;
 run;
Obs  county      locale  rev1 fev2    mhr    v3    v4    v1v3    v1v4    v2v3    v2v4
  1  Orange      RProng    1    0     low     1     0      1       0       0       0
  2  Putnam      RProng    1    0     mid     0     1      0       1       0       0
  3  Sussex      RProng    1    0     mid     0     1      0       1       0       0
  4  Warren      RProng    1    0     hig    -1    -1     -1      -1       0       0
  5  Morris      RProng    1    0     low     1     0      1       0       0       0
  6  Hunterdon   RProng    1    0     hig    -1    -1     -1      -1       0       0
  7  Berks       Fringe    0    1     hig    -1    -1      0       0      -1      -1
  8  Lehigh      Fringe    0    1     hig    -1    -1      0       0      -1      -1
  9  Northampton Fringe    0    1     hig    -1    -1      0       0      -1      -1
 10  Pike        Fringe    0    1     low     1     0      0       0       1       0
 11  Dutchess    Fringe    0    1     mid     0     1      0       0       0       1
 12  Sullivan    Fringe    0    1     low     1     0      0       0       1       0
 13  Ulster      Fringe    0    1     low     1     0      0       0       1       0
 14  Columbia    Control  -1   -1     mid     0     1      0      -1       0      -1
 15  Delaware    Control  -1   -1     mid     0     1      0      -1       0      -1
 16  Greene      Control  -1   -1     mid     0     1      0      -1       0      -1
 17  Otsego      Control  -1   -1     mid     0     1      0      -1       0      -1
 18  Tioga       Control  -1   -1     mid     0     1      0      -1       0      -1
 19  Carbon      Control  -1   -1     mid     0     1      0      -1       0      -1
 20  Lebanon     Control  -1   -1     hig    -1    -1      1       1       1       1
 21  Lackawanna  Control  -1   -1     low     1     0     -1       0      -1       0
 22  Luzerne     Control  -1   -1     low     1     0     -1       0      -1       0
 23  Schuylkill  Control  -1   -1     hig    -1    -1      1       1       1       1
 24  Susquehanna Control  -1   -1     low     1     0     -1       0      -1       0
 25  Wayne       Control  -1   -1     low     1     0     -1       0      -1       0
 26  Wyoming     Control  -1   -1     mid     0     1      0      -1       0      -1
page 100 Table 3.10 Relation among cancer rate, bedrock area, and radon.
proc reg data=radon3;
 model cancer = rev1 fev2 v3 v4 v1v3 v1v4 v2v3 v2v4;
 t5: test v1v3=0, v1v4=0, v2v3=0, v2v4=0;
run;
quit;
The REG Procedure Model: MODEL1 Dependent Variable: cancerAnalysis of Variance
Sum of Mean Source DF Squares Square F Value Pr > F
Model 8 26.03520 3.25440 2.61 0.0460 Error 17 21.21095 1.24770 Corrected Total 25 47.24615
Root MSE 1.11701 R-Square 0.5511 Dependent Mean 5.57692 Adj R-Sq 0.3398 Coeff Var 20.02908
Parameter Estimates
Parameter Standard Variable DF Estimate Error t Value Pr > |t|
Intercept 1 5.77831 0.25006 23.11 <.0001 rev1 1 1.22169 0.36311 3.36 0.0037 fev2 1 -0.30053 0.37356 -0.80 0.4322 v3 1 -0.42831 0.33555 -1.28 0.2190 v4 1 0.67884 0.37209 1.82 0.0857 v1v3 1 -0.52169 0.50123 -1.04 0.3125 v1v4 1 0.92116 0.52639 1.75 0.0981 v2v3 1 0.35053 0.48562 0.72 0.4802 v2v4 1 -0.65661 0.59507 -1.10 0.2852
The REG Procedure Model: MODEL1
Test T5 Results for Dependent Variable cancer
Mean Source DF Square F Value Pr > F
Numerator 4 0.97790 0.78 0.5513 Denominator 17 1.24770

